The children left behind - Innocenti Research Centre
The children left behind - Innocenti Research Centre
The children left behind - Innocenti Research Centre

You also want an ePaper? Increase the reach of your titles
YUMPU automatically turns print PDFs into web optimized ePapers that Google loves.
8 I n n o c e n t i R e p o r t C a r d 9<br />
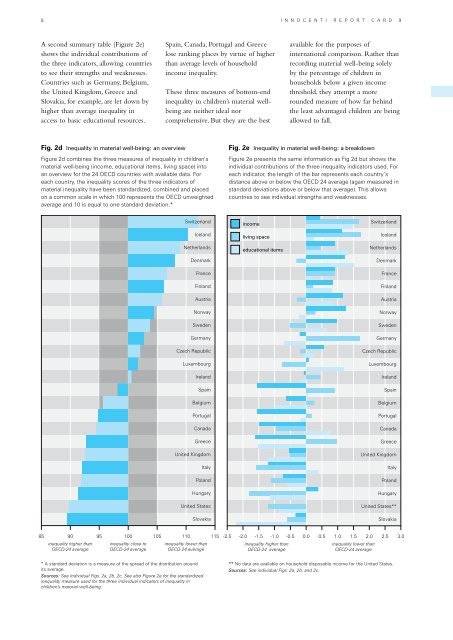
A second summary table (Figure 2e)<br />
shows the individual contributions of<br />
the three indicators, allowing countries<br />
to see their strengths and weaknesses.<br />
Countries such as Germany, Belgium,<br />
the United Kingdom, Greece and<br />
Slovakia, for example, are let down by<br />
higher than average inequality in<br />
access to basic educational resources.<br />
Spain, Canada, Portugal and Greece<br />
lose ranking places by virtue of higher<br />
than average levels of household<br />
income inequality.<br />
<strong>The</strong>se three measures of bottom-end<br />
inequality in <strong>children</strong>’s material wellbeing<br />
are neither ideal nor<br />
comprehensive. But they are the best<br />
available for the purposes of<br />
international comparison. Rather than<br />
recording material well-being solely<br />
by the percentage of <strong>children</strong> in<br />
households below a given income<br />
threshold, they attempt a more<br />
rounded measure of how far <strong>behind</strong><br />
the least advantaged <strong>children</strong> are being<br />
allowed to fall.<br />
Fig. 2d Inequality in material well-being: an overview<br />
Figure 2d combines the three measures of inequality in <strong>children</strong>’s<br />
material well-being (income, educational items, living space) into<br />
an overview for the 24 OECD countries with available data. For<br />
each country, the inequality scores of the three indicators of<br />
material inequality have been standardized, combined and placed<br />
on a common scale in which 100 represents the OECD unweighted<br />
average and 10 is equal to one standard deviation.*<br />
Fig. 2e Inequality in material well-being: a breakdown<br />
Figure 2e presents the same information as Fig 2d but shows the<br />
individual contributions of the three inequality indicators used. For<br />
each indicator, the length of the bar represents each country’s<br />
distance above or below the OECD 24 average (again measured in<br />
standard deviations above or below that average). This allows<br />
countries to see individual strengths and weaknesses.<br />
Switzerland<br />
Iceland<br />
Netherlands<br />
Denmark<br />
France<br />
Finland<br />
Austria<br />
Norway<br />
Sweden<br />
Germany<br />
Czech Republic<br />
Luxembourg<br />
Ireland<br />
Spain<br />
Belgium<br />
Portugal<br />
Canada<br />
Greece<br />
United Kingdom<br />
Italy<br />
Poland<br />
Hungary<br />
United States<br />
Slovakia<br />
income<br />
living space<br />
educational items<br />
Switzerland<br />
Iceland<br />
Netherlands<br />
Denmark<br />
France<br />
Finland<br />
Austria<br />
Norway<br />
Sweden<br />
Germany<br />
Czech Republic<br />
Luxembourg<br />
Ireland<br />
Spain<br />
Belgium<br />
Portugal<br />
Canada<br />
Greece<br />
United Kingdom<br />
Italy<br />
Poland<br />
Hungary<br />
United States**<br />
Slovakia<br />
85 90 95 100 105 110 115<br />
inequality higher than<br />
OECD-24 average<br />
inequality close to<br />
OECD-24 average<br />
inequality lower than<br />
OECD-24 average<br />
-2.5 -2.0 -1.5 -1.0 -0.5 0.0 0.5 1.0 1.5 2.0 2.5 3.0<br />
inequality higher than<br />
OECD-24 average<br />
inequality lower than<br />
OECD-24 average<br />
* A standard deviation is a measure of the spread of the distribution around<br />
its average.<br />
Sources: See individual Figs. 2a, 2b, 2c. See also Figure 2e for the standardized<br />
inequality measure used for the three individual indicators of inequality in<br />
<strong>children</strong>’s material well-being.<br />
** No data are available on household disposable income for the United States.<br />
Sources: See individual Figs. 2a, 2b, and 2c.