The children left behind - Innocenti Research Centre
The children left behind - Innocenti Research Centre
The children left behind - Innocenti Research Centre

You also want an ePaper? Increase the reach of your titles
YUMPU automatically turns print PDFs into web optimized ePapers that Google loves.
1 4 I n n o c e n t i R e p o r t C a r d 9<br />
the median (column 3). <strong>The</strong> inequality<br />
gap is presented both as an absolute<br />
difference between the two scores<br />
(column 4) and as a bar chart showing<br />
the bottom-end inequality gap as a<br />
percentage of each country’s median.<br />
Self-reporting has limitations as an<br />
indicator of health status. Cultural<br />
differences, for example, may play a part<br />
in explaining differences between each<br />
country’s average score (although selfreporting<br />
by <strong>children</strong> has been shown<br />
to be a good predictor of adult health<br />
outcomes v ). But the focus here is not<br />
on averages but on the inequalities<br />
revealed by comparing each country’s<br />
median score with the average score<br />
below the median.<br />
Again it is noticeable that the countries<br />
with the highest median levels of health<br />
– the Netherlands, Austria, and Portugal<br />
– are also the countries with the<br />
lowest levels of health inequality.<br />
Healthy eating and<br />
vigorous physical activity<br />
<strong>The</strong> second and third indicators<br />
available for the measurement of<br />
bottom-end inequalities in <strong>children</strong>’s<br />
health are based on HBSC survey<br />
data under the headings of ‘healthy<br />
eating’ and ‘vigorous physical activity’.<br />
Healthy eating is basic to a child’s<br />
normal growth and development and<br />
to long-term health. Unhealthy<br />
eating, by contrast, is associated with<br />
a wide range of immediate and<br />
long-term health problems including<br />
obesity, type 2 diabetes, and cardiovascular<br />
disease. vi A key component<br />
of healthy eating is the inclusion of<br />
fruit and vegetables in a child’s<br />
daily diet.<br />
Regular exercise in adolescence<br />
also brings short and long-term health<br />
benefits and is positively associated<br />
with cognitive development,<br />
emotional well-being, and even<br />
academic achievement. vii For <strong>children</strong><br />
and adolescents, the World Health<br />
Organization recommends<br />
60 minutes of ‘moderate to vigorous’<br />
physical exercise every day viii<br />
(a recommendation that is not widely<br />
followed; taking an unweighted<br />
average of the 41 countries included<br />
in the HBSC study, only 12%<br />
of 15-year-old girls and 20% of<br />
15-year-old boys report taking an<br />
hour of moderate to vigorous<br />
physical activity every day ix ).<br />
In both cases, HBSC survey data<br />
have been translated into scores for<br />
‘healthy eating’ (on a scale of 0 to 14)<br />
and ‘frequency of vigorous physical<br />
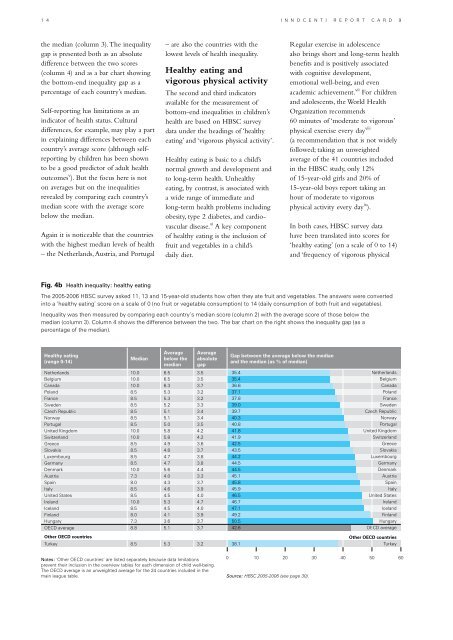
Fig. 4b Health inequality: healthy eating<br />
<strong>The</strong> 2005-2006 HBSC survey asked 11, 13 and 15-year-old students how often they ate fruit and vegetables. <strong>The</strong> answers were converted<br />
into a ‘healthy eating’ score on a scale of 0 (no fruit or vegetable consumption) to 14 (daily consumption of both fruit and vegetables).<br />
Inequality was then measured by comparing each country’s median score (column 2) with the average score of those below the<br />
median (column 3). Column 4 shows the difference between the two. <strong>The</strong> bar chart on the right shows the inequality gap (as a<br />
percentage of the median).<br />
Healthy eating<br />
(range 0-14)<br />
Median<br />
Average<br />
below the<br />
median<br />
Netherlands 10.0 6.5 3.5<br />
Belgium 10.0 6.5 3.5<br />
Canada 10.0 6.3 3.7<br />
Poland 8.5 5.3 3.2<br />
France 8.5 5.3 3.2<br />
Sweden 8.5 5.2 3.3<br />
Czech Republic 8.5 5.1 3.4<br />
Norway 8.5 5.1 3.4<br />
Portugal 8.5 5.0 3.5<br />
United Kingdom 10.0 5.8 4.2<br />
Switzerland 10.0 5.8 4.2<br />
Greece 8.5 4.9 3.6<br />
Slovakia 8.5 4.8 3.7<br />
Luxembourg 8.5 4.7 3.8<br />
Germany 8.5 4.7 3.8<br />
Denmark 10.0 5.6 4.4<br />
Austria 7.3 4.0 3.3<br />
Spain 8.0 4.3 3.7<br />
Italy 8.5 4.6 3.9<br />
United States 8.5 4.5 4.0<br />
Ireland 10.0 5.3 4.7<br />
Iceland 8.5 4.5 4.0<br />
Finland 8.0 4.1 3.9<br />
Hungary 7.3 3.6 3.7<br />
OECD average 8.8 5.1 3.7<br />
Other OECD countries<br />
Turkey 8.5 5.3 3.2<br />
Average<br />
absolute<br />
gap<br />
Gap between the average below the median<br />
and the median (as % of median)<br />
35.4<br />
35.4<br />
36.6<br />
37.1<br />
37.8<br />
39.0<br />
39.7<br />
40.3<br />
40.8<br />
41.8<br />
41.9<br />
42.5<br />
43.5<br />
44.2<br />
44.5<br />
44.5<br />
45.1<br />
45.8<br />
45.9<br />
46.5<br />
46.7<br />
47.1<br />
49.2<br />
50.5<br />
42.6<br />
38.1<br />
Netherlands<br />
Belgium<br />
Canada<br />
Poland<br />
France<br />
Sweden<br />
Czech Republic<br />
Norway<br />
Portugal<br />
United Kingdom<br />
Switzerland<br />
Greece<br />
Slovakia<br />
Luxembourg<br />
Germany<br />
Denmark<br />
Austria<br />
Spain<br />
Italy<br />
United States<br />
Ireland<br />
Iceland<br />
Finland<br />
Hungary<br />
OECD average<br />
Other OECD countries<br />
Turkey<br />
Notes: ‘Other OECD countries’ are listed separately because data limitations<br />
0 10 20 30 40 50 60<br />
prevent their inclusion in the overview tables for each dimension of child well-being.<br />
<strong>The</strong> OECD average is an unweighted average for the 24 countries included in the<br />
main league table. Source: HBSC 2005-2006 (see page 30).