The children left behind - Innocenti Research Centre
The children left behind - Innocenti Research Centre
The children left behind - Innocenti Research Centre

You also want an ePaper? Increase the reach of your titles
YUMPU automatically turns print PDFs into web optimized ePapers that Google loves.
6 I N N O C E N T I R E P O R T C A R D 9<br />
Figure 2b attempts an answer by<br />
drawing on survey data from the<br />
Programme of International Student<br />
Assessment (PISA).<br />
In the 2006 PISA survey (see page 30),<br />
a representative sample of 15-year-old<br />
students in OECD countries was asked<br />
which of the following were available<br />
in their own homes:<br />
a desk<br />
a quiet place to study<br />
a computer for school work<br />
educational software<br />
an internet connection<br />
a calculator<br />
a dictionary<br />
school textbooks.<br />
<strong>The</strong> resulting scores – registered on<br />
a scale of 0 to 8 – do not lend<br />
themselves to analysis by percentile.<br />
Inequality is therefore measured by the<br />
gap between the score of the child at<br />
the median and the average score of all<br />
<strong>children</strong> who fall below the median.<br />
<strong>The</strong> results are presented in Figure 2b.<br />
<strong>The</strong> availability of computers and<br />
internet access depends to some extent<br />
on the level of economic development<br />
in each country; even poor <strong>children</strong><br />
in very wealthy countries, for example,<br />
may have access to most or all of the<br />
items on the ‘home educational<br />
resources’ list. <strong>The</strong> median score<br />
therefore differs from country to<br />
country. But the focus here is on<br />
inequality – on the gap between the<br />
median score (column 2) and the<br />
average score below the median<br />
(column 3). Column 4 shows the<br />
difference between the two and the<br />
chart represents the inequality gap as<br />
a percentage of the median.<br />
Northern European countries again<br />
dominate the top of the table. <strong>The</strong><br />
lowest placed Nordic country, Norway,<br />
posts an equality score close to the<br />
average for the OECD as a whole.<br />
At the foot of the table, the United<br />
Kingdom, Greece, and Slovakia show<br />
the highest levels of inequality in<br />
access to basic educational resources.<br />
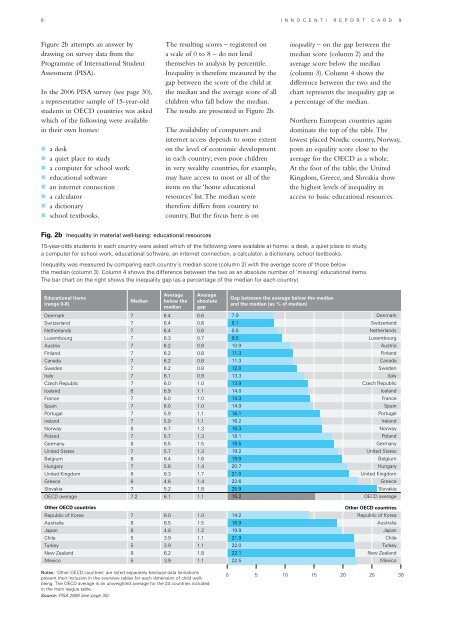
Fig. 2b Inequality in material well-being: educational resources<br />
15-year-olds students in each country were asked which of the following were available at home: a desk, a quiet place to study,<br />
a computer for school work, educational software, an internet connection, a calculator, a dictionary, school textbooks.<br />
Inequality was measured by comparing each country’s median score (column 2) with the average score of those below<br />
the median (column 3). Column 4 shows the difference between the two as an absolute number of ‘missing’ educational items.<br />
<strong>The</strong> bar chart on the right shows the inequality gap (as a percentage of the median for each country).<br />
Educational items<br />
(range 0-8)<br />
Median<br />
Average<br />
below the<br />
median<br />
Denmark 7 6.4 0.6<br />
Switzerland 7 6.4 0.6<br />
Netherlands 7 6.4 0.6<br />
Luxembourg 7 6.3 0.7<br />
Austria 7 6.2 0.8<br />
Finland 7 6.2 0.8<br />
Canada 7 6.2 0.8<br />
Sweden 7 6.2 0.8<br />
Italy 7 6.1 0.9<br />
Czech Republic 7 6.0 1.0<br />
Iceland 8 6.9 1.1<br />
France 7 6.0 1.0<br />
Spain 7 6.0 1.0<br />
Portugal 7 5.9 1.1<br />
Ireland 7 5.9 1.1<br />
Norway 8 6.7 1.3<br />
Poland 7 5.7 1.3<br />
Germany 8 6.5 1.5<br />
United States 7 5.7 1.3<br />
Belgium 8 6.4 1.6<br />
Hungary 7 5.6 1.4<br />
United Kingdom 8 6.3 1.7<br />
Greece 6 4.6 1.4<br />
Slovakia 7 5.2 1.8<br />
OECD average 7.2 6.1 1.1<br />
Other OECD countries<br />
Republic of Korea 7 6.0 1.0<br />
Australia 8 6.5 1.5<br />
Japan 6 4.8 1.2<br />
Chile 5 3.9 1.1<br />
Turkey 5 3.9 1.1<br />
New Zealand 8 6.2 1.8<br />
Mexico 5 3.9 1.1<br />
Average<br />
absolute<br />
gap<br />
Gap between the average below the median<br />
and the median (as % of median)<br />
7.9<br />
8.1<br />
8.8<br />
9.5<br />
10.9<br />
11.3<br />
11.3<br />
12.0<br />
13.3<br />
13.9<br />
14.0<br />
14.3<br />
14.9<br />
16.1<br />
16.2<br />
16.3<br />
18.1<br />
18.5<br />
19.2<br />
19.9<br />
20.7<br />
21.0<br />
22.6<br />
25.9<br />
15.2<br />
14.2<br />
18.9<br />
19.9<br />
21.9<br />
22.0<br />
22.1<br />
22.5<br />
Denmark<br />
Switzerland<br />
Netherlands<br />
Luxembourg<br />
Austria<br />
Finland<br />
Canada<br />
Sweden<br />
Italy<br />
Czech Republic<br />
Iceland<br />
France<br />
Spain<br />
Portugal<br />
Ireland<br />
Norway<br />
Poland<br />
Germany<br />
United States<br />
Belgium<br />
Hungary<br />
United Kingdom<br />
Greece<br />
Slovakia<br />
OECD average<br />
Other OECD countries<br />
Republic of Korea<br />
Australia<br />
Japan<br />
Chile<br />
Turkey<br />
New Zealand<br />
Mexico<br />
Notes: ‘Other OECD countries’ are listed separately because data limitations<br />
prevent their inclusion in the overview tables for each dimension of child wellbeing.<br />
<strong>The</strong> OECD average is an unweighted average for the 24 countries included<br />
in the main league table.<br />
Source: PISA 2006 (see page 30).<br />
0 5 10 15 20 25 30