The children left behind - Innocenti Research Centre
The children left behind - Innocenti Research Centre
The children left behind - Innocenti Research Centre

You also want an ePaper? Increase the reach of your titles
YUMPU automatically turns print PDFs into web optimized ePapers that Google loves.
2 I n n o c e n t i R e p o r t C a r d 9<br />
T h e c h i l d r e n l e f t b e h i n d<br />
A league table of inequality in child well-being<br />
in the world’s rich countries<br />
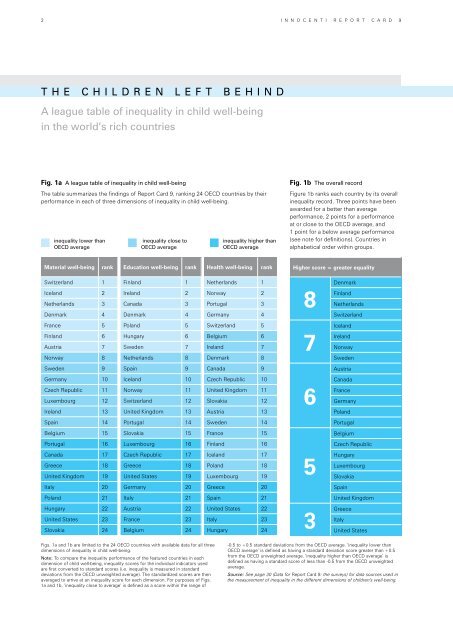
Fig. 1a A league table of inequality in child well-being<br />
<strong>The</strong> table summarizes the findings of Report Card 9, ranking 24 OECD countries by their<br />
performance in each of three dimensions of inequality in child well-being.<br />
inequality lower than<br />
OECD average<br />
inequality close to<br />
OECD average<br />
inequality higher than<br />
OECD average<br />
Fig. 1b <strong>The</strong> overall record<br />
Figure 1b ranks each country by its overall<br />
inequality record. Three points have been<br />
awarded for a better than average<br />
performance, 2 points for a performance<br />
at or close to the OECD average, and<br />
1 point for a below average performance<br />
(see note for definitions). Countries in<br />
alphabetical order within groups.<br />
Material well-being rank Education well-being rank Health well-being rank<br />
Higher score = greater equality<br />
Switzerland 1 Finland 1 Netherlands 1<br />
Iceland 2 Ireland 2 Norway 2<br />
Netherlands 3 Canada 3 Portugal 3<br />
Denmark 4 Denmark 4 Germany 4<br />
France 5 Poland 5 Switzerland 5<br />
Finland 6 Hungary 6 Belgium 6<br />
Austria 7 Sweden 7 Ireland 7<br />
Norway 8 Netherlands 8 Denmark 8<br />
Sweden 9 Spain 9 Canada 9<br />
Germany 10 Iceland 10 Czech Republic 10<br />
Czech Republic 11 Norway 11 United Kingdom 11<br />
Luxembourg 12 Switzerland 12 Slovakia 12<br />
Ireland 13 United Kingdom 13 Austria 13<br />
Spain 14 Portugal 14 Sweden 14<br />
Belgium 15 Slovakia 15 France 15<br />
Portugal 16 Luxembourg 16 Finland 16<br />
Canada 17 Czech Republic 17 Iceland 17<br />
Greece 18 Greece 18 Poland 18<br />
United Kingdom 19 United States 19 Luxembourg 19<br />
Italy 20 Germany 20 Greece 20<br />
Poland 21 Italy 21 Spain 21<br />
Hungary 22 Austria 22 United States 22<br />
United States 23 France 23 Italy 23<br />
Slovakia 24 Belgium 24 Hungary 24<br />
8<br />
7<br />
6<br />
5<br />
3<br />
Denmark<br />
Finland<br />
Netherlands<br />
Switzerland<br />
Iceland<br />
Ireland<br />
Norway<br />
Sweden<br />
Austria<br />
Canada<br />
France<br />
Germany<br />
Poland<br />
Portugal<br />
Belgium<br />
Czech Republic<br />
Hungary<br />
Luxembourg<br />
Slovakia<br />
Spain<br />
United Kingdom<br />
Greece<br />
Italy<br />
United States<br />
Figs. 1a and 1b are limited to the 24 OECD countries with available data for all three<br />
dimensions of inequality in child well-being.<br />
Note: To compare the inequality performance of the featured countries in each<br />
dimension of child well-being, inequality scores for the individual indicators used<br />
are first converted to standard scores (i.e. inequality is measured in standard<br />
deviations from the OECD unweighted average). <strong>The</strong> standardized scores are then<br />
averaged to arrive at an inequality score for each dimension. For purposes of Figs.<br />
1a and 1b, ‘inequality close to average’ is defined as a score within the range of<br />
-0.5 to +0.5 standard deviations from the OECD average. ‘inequality lower than<br />
OECD average’ is defined as having a standard deviation score greater than +0.5<br />
from the OECD unweighted average. ‘inequality higher than OECD average’ is<br />
defined as having a standard score of less than -0.5 from the OECD unweighted<br />
average.<br />
Source: See page 30 (Data for Report Card 9: the surveys) for data sources used in<br />
the measurement of inequality in the different dimensions of <strong>children</strong>’s well-being.