The children left behind - Innocenti Research Centre
The children left behind - Innocenti Research Centre
The children left behind - Innocenti Research Centre

Create successful ePaper yourself
Turn your PDF publications into a flip-book with our unique Google optimized e-Paper software.
I n n o c e n t i R e p o r t C a r d 9 1 5<br />
activity’ (on a scale of 0 to 11).<br />
Following the pattern already<br />
established, Figs. 4b and 4c measure<br />
inequality by the gap between the<br />
median score of each country and the<br />
average score for all <strong>children</strong> below<br />
the median. <strong>The</strong> bar charts again<br />
show each country’s inequality gap as<br />
a percentage of the national median.<br />
For ‘healthy eating,’ the lowest level<br />
of inequality is to be found in the<br />
Netherlands, Belgium and Canada<br />
and the highest in Iceland, Finland<br />
and Hungary.<br />
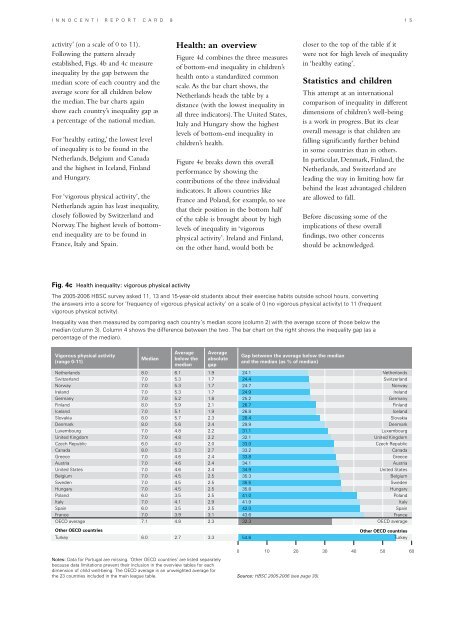
For ‘vigorous physical activity’, the<br />
Netherlands again has least inequality,<br />
closely followed by Switzerland and<br />
Norway. <strong>The</strong> highest levels of bottomend<br />
inequality are to be found in<br />
France, Italy and Spain.<br />
Health: an overview<br />
Figure 4d combines the three measures<br />
of bottom-end inequality in <strong>children</strong>’s<br />
health onto a standardized common<br />
scale. As the bar chart shows, the<br />
Netherlands heads the table by a<br />
distance (with the lowest inequality in<br />
all three indicators). <strong>The</strong> United States,<br />
Italy and Hungary show the highest<br />
levels of bottom-end inequality in<br />
<strong>children</strong>’s health.<br />
Figure 4e breaks down this overall<br />
performance by showing the<br />
contributions of the three individual<br />
indicators. It allows countries like<br />
France and Poland, for example, to see<br />
that their position in the bottom half<br />
of the table is brought about by high<br />
levels of inequality in ‘vigorous<br />
physical activity’. Ireland and Finland,<br />
on the other hand, would both be<br />
closer to the top of the table if it<br />
were not for high levels of inequality<br />
in ‘healthy eating’.<br />
Statistics and <strong>children</strong><br />
This attempt at an international<br />
comparison of inequality in different<br />
dimensions of <strong>children</strong>’s well-being<br />
is a work in progress. But its clear<br />
overall message is that <strong>children</strong> are<br />
falling significantly further <strong>behind</strong><br />
in some countries than in others.<br />
In particular, Denmark, Finland, the<br />
Netherlands, and Switzerland are<br />
leading the way in limiting how far<br />
<strong>behind</strong> the least advantaged <strong>children</strong><br />
are allowed to fall.<br />
Before discussing some of the<br />
implications of these overall<br />
findings, two other concerns<br />
should be acknowledged.<br />
Fig. 4c Health inequality: vigorous physical activity<br />
<strong>The</strong> 2005-2006 HBSC survey asked 11, 13 and 15-year-old students about their exercise habits outside school hours, converting<br />
the answers into a score for ‘frequency of vigorous physical activity’ on a scale of 0 (no vigorous physical activity) to 11 (frequent<br />
vigorous physical activity).<br />
Inequality was then measured by comparing each country’s median score (column 2) with the average score of those below the<br />
median (column 3). Column 4 shows the difference between the two. <strong>The</strong> bar chart on the right shows the inequality gap (as a<br />
percentage of the median).<br />
Vigorous physical activity<br />
(range 0-11)<br />
Median<br />
Average<br />
below the<br />
median<br />
Netherlands 8.0 6.1 1.9<br />
Switzerland 7.0 5.3 1.7<br />
Norway 7.0 5.3 1.7<br />
Ireland 7.0 5.3 1.7<br />
Germany 7.0 5.2 1.8<br />
Finland 8.0 5.9 2.1<br />
Iceland 7.0 5.1 1.9<br />
Slovakia 8.0 5.7 2.3<br />
Denmark 8.0 5.6 2.4<br />
Luxembourg 7.0 4.8 2.2<br />
United Kingdom 7.0 4.8 2.2<br />
Czech Republic 6.0 4.0 2.0<br />
Canada 8.0 5.3 2.7<br />
Greece 7.0 4.6 2.4<br />
Austria 7.0 4.6 2.4<br />
United States 7.0 4.6 2.4<br />
Belgium 7.0 4.5 2.5<br />
Sweden 7.0 4.5 2.5<br />
Hungary 7.0 4.5 2.5<br />
Poland 6.0 3.5 2.5<br />
Italy 7.0 4.1 2.9<br />
Spain 6.0 3.5 2.5<br />
France 7.0 3.9 3.1<br />
OECD average 7.1 4.8 2.3<br />
Other OECD countries<br />
Turkey 6.0 2.7 3.3<br />
Average<br />
absolute<br />
gap<br />
Gap between the average below the median<br />
and the median (as % of median)<br />
24.1<br />
24.4<br />
24.7<br />
24.9<br />
25.2<br />
26.7<br />
26.8<br />
28.4<br />
29.9<br />
31.1<br />
32.1<br />
33.0<br />
33.2<br />
33.8<br />
34.1<br />
34.9<br />
35.3<br />
35.5<br />
35.8<br />
41.0<br />
41.9<br />
42.0<br />
43.6<br />
32.3<br />
54.6<br />
Netherlands<br />
Switzerland<br />
Norway<br />
Ireland<br />
Germany<br />
Finland<br />
Iceland<br />
Slovakia<br />
Denmark<br />
Luxembourg<br />
United Kingdom<br />
Czech Republic<br />
Canada<br />
Greece<br />
Austria<br />
United States<br />
Belgium<br />
Sweden<br />
Hungary<br />
Poland<br />
Italy<br />
Spain<br />
France<br />
OECD average<br />
Other OECD countries<br />
Turkey<br />
0 10 20 30 40 50 60<br />
Notes: Data for Portugal are missing. ‘Other OECD countries’ are listed separately<br />
because data limitations prevent their inclusion in the overview tables for each<br />
dimension of child well-being. <strong>The</strong> OECD average is an unweighted average for<br />
the 23 countries included in the main league table. Source: HBSC 2005-2006 (see page 30).