Description of Error Tabulation File Format (.pdf)
Description of Error Tabulation File Format (.pdf)
Description of Error Tabulation File Format (.pdf)

Create successful ePaper yourself
Turn your PDF publications into a flip-book with our unique Google optimized e-Paper software.
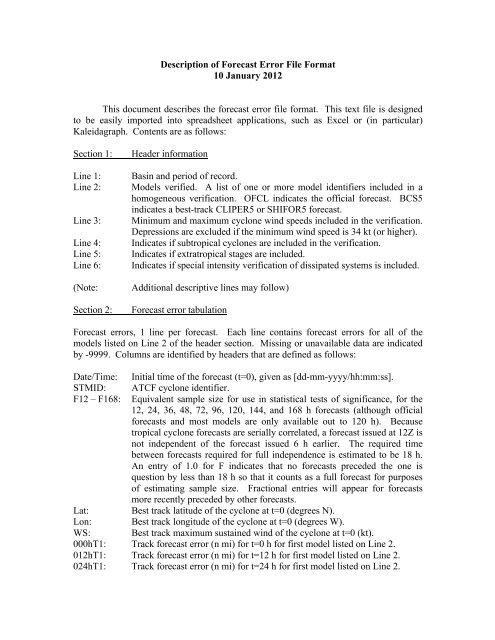
<strong>Description</strong> <strong>of</strong> Forecast <strong>Error</strong> <strong>File</strong> <strong>Format</strong><br />
10 January 2012<br />
This document describes the forecast error file format. This text file is designed<br />
to be easily imported into spreadsheet applications, such as Excel or (in particular)<br />
Kaleidagraph. Contents are as follows:<br />
Section 1:<br />
Line 1:<br />
Line 2:<br />
Line 3:<br />
Line 4:<br />
Line 5:<br />
Line 6:<br />
(Note:<br />
Section 2:<br />
Header information<br />
Basin and period <strong>of</strong> record.<br />
Models verified. A list <strong>of</strong> one or more model identifiers included in a<br />
homogeneous verification. OFCL indicates the <strong>of</strong>ficial forecast. BCS5<br />
indicates a best-track CLIPER5 or SHIFOR5 forecast.<br />
Minimum and maximum cyclone wind speeds included in the verification.<br />
Depressions are excluded if the minimum wind speed is 34 kt (or higher).<br />
Indicates if subtropical cyclones are included in the verification.<br />
Indicates if extratropical stages are included.<br />
Indicates if special intensity verification <strong>of</strong> dissipated systems is included.<br />
Additional descriptive lines may follow)<br />
Forecast error tabulation<br />
Forecast errors, 1 line per forecast. Each line contains forecast errors for all <strong>of</strong> the<br />
models listed on Line 2 <strong>of</strong> the header section. Missing or unavailable data are indicated<br />
by -9999. Columns are identified by headers that are defined as follows:<br />
Date/Time: Initial time <strong>of</strong> the forecast (t=0), given as [dd-mm-yyyy/hh:mm:ss].<br />
STMID: ATCF cyclone identifier.<br />
F12 – F168: Equivalent sample size for use in statistical tests <strong>of</strong> significance, for the<br />
12, 24, 36, 48, 72, 96, 120, 144, and 168 h forecasts (although <strong>of</strong>ficial<br />
forecasts and most models are only available out to 120 h). Because<br />
tropical cyclone forecasts are serially correlated, a forecast issued at 12Z is<br />
not independent <strong>of</strong> the forecast issued 6 h earlier. The required time<br />
between forecasts required for full independence is estimated to be 18 h.<br />
An entry <strong>of</strong> 1.0 for F indicates that no forecasts preceded the one is<br />
question by less than 18 h so that it counts as a full forecast for purposes<br />
<strong>of</strong> estimating sample size. Fractional entries will appear for forecasts<br />
more recently preceded by other forecasts.<br />
Lat: Best track latitude <strong>of</strong> the cyclone at t=0 (degrees N).<br />
Lon: Best track longitude <strong>of</strong> the cyclone at t=0 (degrees W).<br />
WS: Best track maximum sustained wind <strong>of</strong> the cyclone at t=0 (kt).<br />
000hT1: Track forecast error (n mi) for t=0 h for first model listed on Line 2.<br />
012hT1: Track forecast error (n mi) for t=12 h for first model listed on Line 2.<br />
024hT1: Track forecast error (n mi) for t=24 h for first model listed on Line 2.
036hT1: Track forecast error (n mi) for t=36 h for first model listed on Line 2.<br />
048hT1: Track forecast error (n mi) for t=48 h for first model listed on Line 2.<br />
072hT1: Track forecast error (n mi) for t=72 h for first model listed on Line 2.<br />
096hT1: Track forecast error (n mi) for t=96 h for first model listed on Line 2.<br />
120hT1: Track forecast error (n mi) for t=120 h for first model listed on Line 2.<br />
144hT1: Track forecast error (n mi) for t=144 h for first model listed on Line 2.<br />
168hT1: Track forecast error (n mi) for t=168 h for first model listed on Line 2.<br />
000hI1: Intensity forecast error (kt) for t=0 h for first model listed on Line 2.<br />
012hI1: Intensity forecast error (kt) for t=12 h for first model listed on Line 2.<br />
024hI1: Intensity forecast error (kt) for t=24 h for first model listed on Line 2.<br />
036hI1: Intensity forecast error (kt) for t=36 h for first model listed on Line 2.<br />
048hI1: Intensity forecast error (kt) for t=48 h for first model listed on Line 2.<br />
072hI1: Intensity forecast error (kt) for t=72 h for first model listed on Line 2.<br />
096hI1: Intensity forecast error (kt) for t=96 h for first model listed on Line 2.<br />
120hI1: Intensity forecast error (kt) for t=120 h for first model listed on Line 2.<br />
144hI1: Intensity forecast error (kt) for t=144 h for first model listed on Line 2.<br />
168hI1: Intensity forecast error (kt) for t=168 h for first model listed on Line 2.<br />
(These 20 columns are then repeated for each model listed on Line 2, with column<br />
headers 000hT2 – 168hT2, 000hI2 – 168hI2, etc.)<br />
Note: Output forecast parameters, by default, are track error and intensity error.<br />
However, it is also possible to output along- and cross-track position errors, or x and y<br />
position errors. These would be indicated with column headers 000hA1, 012hA1, …,<br />
000hC1, etc., and 000hX1, 012hX1, …, 000hY1, etc., respectively. The following<br />
conventions should be noted: along-track errors are positive if the forecast lies ahead <strong>of</strong><br />
the verifying position (i.e., is too fast), and cross-track errors are positive if the forecast is<br />
to the right <strong>of</strong> the verifying position. X-errors are positive if the forecast lies to the east<br />
<strong>of</strong> the verifying position, and y-errors are positive if the forecast lies to the north <strong>of</strong> the<br />
verifying position.