High Wind Drag Coefficient and Sea Surface Roughness in Shallow ...
High Wind Drag Coefficient and Sea Surface Roughness in Shallow ...
High Wind Drag Coefficient and Sea Surface Roughness in Shallow ...

Create successful ePaper yourself
Turn your PDF publications into a flip-book with our unique Google optimized e-Paper software.
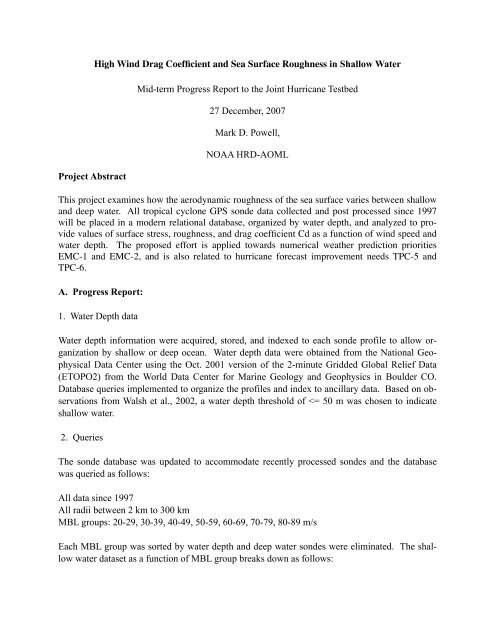
Project Abstract<br />
<strong>High</strong> <strong>W<strong>in</strong>d</strong> <strong>Drag</strong> <strong>Coefficient</strong> <strong>and</strong> <strong>Sea</strong> <strong>Surface</strong> <strong>Roughness</strong> <strong>in</strong> <strong>Shallow</strong> Water<br />
Mid-term Progress Report to the Jo<strong>in</strong>t Hurricane Testbed<br />
27 December, 2007<br />
Mark D. Powell,<br />
NOAA HRD-AOML<br />
This project exam<strong>in</strong>es how the aerodynamic roughness of the sea surface varies between shallow<br />
<strong>and</strong> deep water. All tropical cyclone GPS sonde data collected <strong>and</strong> post processed s<strong>in</strong>ce 1997<br />
will be placed <strong>in</strong> a modern relational database, organized by water depth, <strong>and</strong> analyzed to provide<br />
values of surface stress, roughness, <strong>and</strong> drag coefficient Cd as a function of w<strong>in</strong>d speed <strong>and</strong><br />
water depth. The proposed effort is applied towards numerical weather prediction priorities<br />
EMC-1 <strong>and</strong> EMC-2, <strong>and</strong> is also related to hurricane forecast improvement needs TPC-5 <strong>and</strong><br />
TPC-6.<br />
A. Progress Report:<br />
1. Water Depth data<br />
Water depth <strong>in</strong>formation were acquired, stored, <strong>and</strong> <strong>in</strong>dexed to each sonde profile to allow organization<br />
by shallow or deep ocean. Water depth data were obta<strong>in</strong>ed from the National Geophysical<br />
Data Center us<strong>in</strong>g the Oct. 2001 version of the 2-m<strong>in</strong>ute Gridded Global Relief Data<br />
(ETOPO2) from the World Data Center for Mar<strong>in</strong>e Geology <strong>and</strong> Geophysics <strong>in</strong> Boulder CO.<br />
Database queries implemented to organize the profiles <strong>and</strong> <strong>in</strong>dex to ancillary data. Based on observations<br />
from Walsh et al., 2002, a water depth threshold of
Table 1 Number of shallow <strong>and</strong> deep water sonde profiles as a function of MBL w<strong>in</strong>d speed<br />
group.<br />
MBL group (m/s)<br />
Sonde profiles <strong>in</strong> database<br />
(3-20-2006)<br />
Sonde profiles <strong>in</strong> deep<br />
water<br />
20-29 32 256<br />
30-39 65 229<br />
40-49 30 207<br />
50-59 18 133<br />
60-69 5 118<br />
70-79 0 94<br />
80-89 0 26<br />
totals 143 1063<br />
3. Upstream fetch<br />
<strong>Shallow</strong> water sondes are close enough to shore that the mean w<strong>in</strong>d profiles are affected by the<br />
upstream fetch. A sonde with an upstream fetch over l<strong>and</strong> (offshore flow) will exhibit more low<br />
level w<strong>in</strong>d speed shear than a sonde with an upstream fetch over open water (onshore flow),<br />
lead<strong>in</strong>g to very different surface layer quantities <strong>and</strong> different drag coefficients. Therefore sondes<br />
with<strong>in</strong> an MBL group were characterized by upstream fetch as follows:<br />
Onshore or open: Sonde splash w<strong>in</strong>d direction or last measured w<strong>in</strong>d direction <strong>in</strong>dicates a flow<br />
component that is either onshore or the sonde is <strong>in</strong> shallow water or shoals but > 50 km offshore<br />
from any l<strong>and</strong> mass.<br />
Along-shore: Sonde splash w<strong>in</strong>d direction or last measured w<strong>in</strong>d direction <strong>in</strong>dicates a flow component<br />
that is alongshore or with<strong>in</strong> 30 degrees of parallel to shore.<br />
Inl<strong>and</strong>: Sonde splash location <strong>in</strong>dicated the sonde drifted over l<strong>and</strong> <strong>in</strong>l<strong>and</strong> from the coast.<br />
Sondes with<strong>in</strong> an MBL group were subgrouped <strong>in</strong>to Keyhole Markup Language (KML) files for<br />
plott<strong>in</strong>g their location <strong>in</strong> Google Earth. A JAVA servlet was written to connect to Google Earth<br />
2
<strong>and</strong> plot the sonde locations <strong>and</strong> w<strong>in</strong>d barbs as scalable place marks. The w<strong>in</strong>d direction was<br />
then exam<strong>in</strong>ed relative to the coastl<strong>in</strong>e to determ<strong>in</strong>e the upstream fetch characterization for each<br />
shallow water sonde profile.<br />
Fig.1 Google Earth images of sondes splash locations <strong>and</strong> serial numbers <strong>in</strong> the 40-49 m/s MBL<br />
group. <strong>W<strong>in</strong>d</strong> barbs show direction last measured w<strong>in</strong>d but speeds are all given a dummy speed<br />
of 25. a) Off LA coast (note 3 sondes <strong>in</strong>l<strong>and</strong>). b) Off Cape Fear NC coast.<br />
3
Fig. 2. As <strong>in</strong> Fig. 1 but for 50-59 m/s MBL group from Hurricane Katr<strong>in</strong>a <strong>in</strong> 2005. Sonde serial<br />
numbers are shown adjacent to the splash location.<br />
4. Prelim<strong>in</strong>ary analysis<br />
Exploratory analysis was conducted on the 30-39 m/s MBL group s<strong>in</strong>ce this conta<strong>in</strong>s the largest<br />
number of shallow water sondes.<br />
Offshore flow<br />
For offshore flow 10 sonde profiles were available. A log Z vs w<strong>in</strong>d speed plot (Fig. 3a) <strong>in</strong>dicates<br />
that for several sondes, the lower 50 m of the w<strong>in</strong>d profile shows near constant w<strong>in</strong>d speed<br />
profiles with height characteristic of <strong>in</strong>ternal boundary layer development. This behavior suggests<br />
non stationary conditions associated with the lower levels of the offshore flow accelerat<strong>in</strong>g<br />
due to a new (sea) underly<strong>in</strong>g surface, whereas the upper levels of the boundary layer are characterized<br />
by higher shear associated with flow over l<strong>and</strong>. The specific humidity (Fig. 3b) also<br />
show evidence of an <strong>in</strong>ternal boundary layer development with relatively sharp decreases above<br />
50-100 m. Such non stationarity makes the offshore flow profiles unsuitable for estimat<strong>in</strong>g surface<br />
layer quantities.<br />
4
Height(m)<br />
700<br />
500<br />
400<br />
300<br />
200<br />
100<br />
70<br />
50<br />
40<br />
30<br />
20<br />
10<br />
20 30 40<br />
<strong>W<strong>in</strong>d</strong>speed(Mps)<br />
Height(m)<br />
800<br />
500<br />
300<br />
200<br />
100<br />
60<br />
40<br />
20<br />
10<br />
12 14 16 18 20<br />
SpecificHumidity(g/kg)<br />
Fig. 3 a) Height vs. <strong>W<strong>in</strong>d</strong> speed for offshore sondes show<strong>in</strong>g low shear or near constant w<strong>in</strong>d<br />
speed below 50m. b) Height vs. Specific humidity show<strong>in</strong>g a relatively shallow <strong>in</strong>ternal boundary<br />
layer with a decrease above the lowest 50 m layer.<br />
Onshore flow<br />
For shallow water onshore flow 42 sonde profiles are available (Fig 4a) <strong>and</strong> a mean profile fit<br />
suggests a roughness length of about 0.7 mm. A mean profile constructed from all 294 sondes <strong>in</strong><br />
the 30-39 MBL group (Fig. 5) suggests a smaller roughness length of about 0.3 mm. However<br />
this plot <strong>in</strong>cludes all the shallow water sondes. The differences should be larger once we separate<br />
out the shallow water sondes. However, another factor to consider will be the storm relative<br />
azimuth of the deep water sondes s<strong>in</strong>ce <strong>in</strong> our April 2007 JHT report we <strong>in</strong>dicated enhanced<br />
roughness <strong>in</strong> the storm-relative, left-front portion of the storm. By separat<strong>in</strong>g the shallow water<br />
profiles from the deep ones, we should be able to determ<strong>in</strong>e whether the higher roughness values<br />
observed to the front left are associated with shallow water or <strong>in</strong>teraction between the flow <strong>and</strong><br />
the wave motion. Furthermore we hope to determ<strong>in</strong>e whether onshore flow <strong>in</strong> shallow water exhibits<br />
different surface layer characteristics than open ocean flow over deep water.<br />
5
Height(m)<br />
700<br />
500<br />
400<br />
300<br />
200<br />
100<br />
70<br />
50<br />
30<br />
20<br />
10<br />
20 25 30 35 40 45<br />
<strong>W<strong>in</strong>d</strong>speed(Mps)<br />
Mean(Height(m))<br />
100<br />
40<br />
10<br />
4<br />
1<br />
0.4<br />
0.1<br />
0.04<br />
0.01<br />
0.004<br />
0.001<br />
0.0004<br />
0.0002<br />
0.0001<br />
0 5 10 15 20 25 30 35<br />
Mean(<strong>W<strong>in</strong>d</strong>speed(Mps))<br />
Fig. 4 a) Height vs. <strong>W<strong>in</strong>d</strong> speed for onshore flow sondes <strong>in</strong> the 30-39 m/s MBL group. b) Log<br />
fit to the b<strong>in</strong> mean w<strong>in</strong>d profile <strong>in</strong> the lowest 20-160 m (lowest two po<strong>in</strong>ts not used <strong>in</strong> the fit).<br />
Intersection with the height axis determ<strong>in</strong>es the roughness length (~ 0.7 mm).<br />
Mean(Height(m))<br />
100<br />
10<br />
1<br />
0.1<br />
0.01<br />
0.001<br />
0.0002<br />
0 5 10 15 20 25 30 35<br />
Mean(<strong>W<strong>in</strong>d</strong>speed(Mps))<br />
Fig. 5 As <strong>in</strong> 4b but mean profile for 20-160 m layer from all sondes <strong>in</strong> the 30-39 MBL group.<br />
Along shore flow<br />
For along shore flow <strong>in</strong> the 30-39 m/s MBL group, eight sonde profiles are available. Exam<strong>in</strong>ation<br />
of <strong>in</strong>dividual plots (Fig. 6) <strong>in</strong>dicates profiles with characteristics of the offshore flow as well<br />
as onshore flow. These profiles may be exam<strong>in</strong>ed more closely to see if some can be associated<br />
with the onshore <strong>and</strong> offshore profile categories.<br />
6
200<br />
Height(m)<br />
100<br />
70<br />
50<br />
40<br />
30<br />
20<br />
22 25 28 31 34 37<br />
<strong>W<strong>in</strong>d</strong>speed(Mps)<br />
Fig. 6 Height vs. <strong>W<strong>in</strong>d</strong> speed for Along-shore flow sondes <strong>in</strong> the 30-39 m/s MBL group.<br />
Inl<strong>and</strong> <strong>W<strong>in</strong>d</strong> Profiles<br />
Four sondes <strong>in</strong> the 30-39 m/s MBL group drifted <strong>in</strong>l<strong>and</strong> <strong>and</strong> were characterized by large w<strong>in</strong>d<br />
speed shear over the lowest 150 m, result<strong>in</strong>g <strong>in</strong> a roughness length near that associated with open<br />
terra<strong>in</strong> (15 mm).<br />
Height(m)<br />
300<br />
200<br />
100<br />
60<br />
40<br />
20<br />
10<br />
6<br />
20 25 30 35<br />
<strong>W<strong>in</strong>d</strong>speed(Mps)<br />
Mean(Height(m))<br />
100<br />
10<br />
1<br />
0.1<br />
0.01<br />
0.001<br />
0.0002<br />
0 5 10 15 20 25 30<br />
Mean(<strong>W<strong>in</strong>d</strong>speed(Mps))<br />
Fig. 7 <strong>W<strong>in</strong>d</strong> profiles over l<strong>and</strong> from the 30-39 m/s MBL group. a) <strong>in</strong>dividual profiles. b) B<strong>in</strong>mean<br />
profiles <strong>and</strong> log fit over the 20-260 m layer.<br />
7
We would hope to obta<strong>in</strong> > 10 profiles over l<strong>and</strong> to substantiate the differences with onshore<br />
flow over shallow water <strong>and</strong> open ocean flow over deep water <strong>in</strong> the MBL group. However,<br />
sondes are not permitted to be launched over l<strong>and</strong> so it is rare that such profiles are available<br />
(apparently the <strong>in</strong>l<strong>and</strong> sondes shown here were advected <strong>in</strong>l<strong>and</strong> from offshore or from a bay/<br />
sound (e.g. Onslow Bay, Pamlico Sound, Lake Ponchartra<strong>in</strong>).<br />
C. Rema<strong>in</strong><strong>in</strong>g work<br />
1. Open-ocean deep water profiles<br />
The database will be queried to remove the shallow water data from the open ocean profiles to<br />
better contrast the differences between onshore flow over shallow water <strong>and</strong> open ocean flow<br />
over deep water. Data will be QC’s accord<strong>in</strong>g to process<strong>in</strong>g QC flags, number of samples per<br />
b<strong>in</strong>, st<strong>and</strong>ard error of the b<strong>in</strong> mean, <strong>and</strong> outliers.<br />
2. <strong>Shallow</strong> water profiles<br />
The rema<strong>in</strong>der of the shallow water MBL groups will be analyzed to develop mean w<strong>in</strong>d profiles.<br />
Data will be QC’s accord<strong>in</strong>g to process<strong>in</strong>g QC flags, number of samples per b<strong>in</strong>, st<strong>and</strong>ard<br />
error of the b<strong>in</strong> mean, <strong>and</strong> outliers. Based on experience with the 30-39 m/s MBL group, only<br />
the 20-29 <strong>and</strong> 40-49 MBL groups are expected to have sufficient data to construct mean profiles<br />
to determ<strong>in</strong>e surface layer roughness length, friction velocity, <strong>and</strong> drag coefficient.<br />
3. Analysis<br />
Student’s t tests will be conducted to determ<strong>in</strong>e whether the b<strong>in</strong> means of the shallow <strong>and</strong> deep<br />
water profiles come from different populations. <strong>Surface</strong> layer parameters <strong>and</strong> associated error<br />
bars will be computed from least squares fits of the profiles <strong>and</strong> compared as a function of w<strong>in</strong>d<br />
speed for deep <strong>and</strong> shallow water. Analysis of covariance will be used to exam<strong>in</strong>e the slopes <strong>and</strong><br />
<strong>in</strong>tercepts of the mean log w<strong>in</strong>d profiles <strong>and</strong> determ<strong>in</strong>e whether differences exist between the<br />
shallow <strong>and</strong> deep water profiles. Prelim<strong>in</strong>ary results will be presented at the Interdepartmental<br />
Hurricane Conference <strong>in</strong> March 2008.<br />
References:<br />
Powell, M. D., 2007: <strong>Drag</strong> <strong>Coefficient</strong> Distribution <strong>and</strong> <strong>W<strong>in</strong>d</strong> Speed Dependence <strong>in</strong> Tropical Cyclones.<br />
F<strong>in</strong>al report to the JHT, April 2007, 26 pp.<br />
Walsh, E. J., others, M. D. Powell, Black, <strong>and</strong> F. D Marks, Jr., 2002: Hurricane directional<br />
wave spectrum spatial variation at l<strong>and</strong>fall. J. Physical Ocean., 32, 1667-1684.<br />
8