A REANALYSIS OF HURRICANE ANDREW'S INTENSITY - National ...
A REANALYSIS OF HURRICANE ANDREW'S INTENSITY - National ...
A REANALYSIS OF HURRICANE ANDREW'S INTENSITY - National ...

Create successful ePaper yourself
Turn your PDF publications into a flip-book with our unique Google optimized e-Paper software.
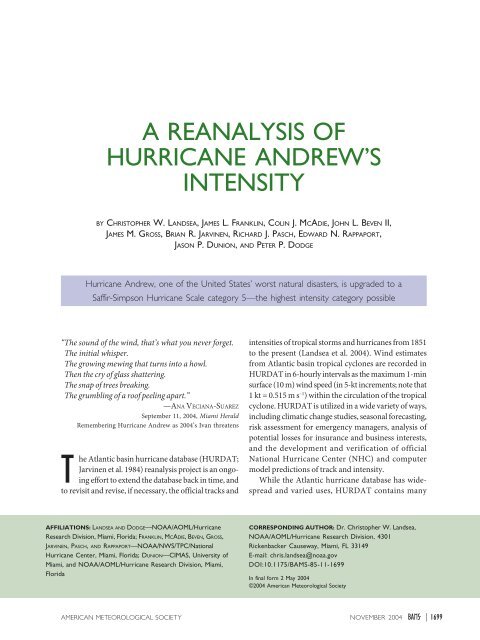
A <strong>REANALYSIS</strong> <strong>OF</strong><br />
<strong>HURRICANE</strong> ANDREW’S<br />
<strong>INTENSITY</strong><br />
BY CHRISTOPHER W. LANDSEA, JAMES L. FRANKLIN, COLIN J. MCADIE, JOHN L. BEVEN II,<br />
JAMES M. GROSS, BRIAN R. JARVINEN, RICHARD J. PASCH, EDWARD N. RAPPAPORT,<br />
JASON P. DUNION, AND PETER P. DODGE<br />
Hurricane Andrew, one of the United States’ worst natural disasters, is upgraded to a<br />
Saffir-Simpson Hurricane Scale category 5—the highest intensity category possible<br />
“The sound of the wind, that’s what you never forget.<br />
The initial whisper.<br />
The growing mewing that turns into a howl.<br />
Then the cry of glass shattering.<br />
The snap of trees breaking.<br />
The grumbling of a roof peeling apart.”<br />
—ANA VECIANA-SUAREZ<br />
September 11, 2004, Miami Herald<br />
Remembering Hurricane Andrew as 2004’s Ivan threatens<br />
The Atlantic basin hurricane database (HURDAT;<br />
Jarvinen et al. 1984) reanalysis project is an ongoing<br />
effort to extend the database back in time, and<br />
to revisit and revise, if necessary, the official tracks and<br />
intensities of tropical storms and hurricanes from 1851<br />
to the present (Landsea et al. 2004). Wind estimates<br />
from Atlantic basin tropical cyclones are recorded in<br />
HURDAT in 6-hourly intervals as the maximum 1-min<br />
surface (10 m) wind speed (in 5-kt increments; note that<br />
1 kt = 0.515 m s –1 ) within the circulation of the tropical<br />
cyclone. HURDAT is utilized in a wide variety of ways,<br />
including climatic change studies, seasonal forecasting,<br />
risk assessment for emergency managers, analysis of<br />
potential losses for insurance and business interests,<br />
and the development and verification of official<br />
<strong>National</strong> Hurricane Center (NHC) and computer<br />
model predictions of track and intensity.<br />
While the Atlantic hurricane database has widespread<br />
and varied uses, HURDAT contains many<br />
AFFILIATIONS: LANDSEA AND DODGE—NOAA/AOML/Hurricane<br />
Research Division, Miami, Florida; FRANKLIN, MCADIE, BEVEN, GROSS,<br />
JARVINEN, PASCH, AND RAPPAPORT—NOAA/NWS/TPC/<strong>National</strong><br />
Hurricane Center, Miami, Florida; DUNION—CIMAS, University of<br />
Miami, and NOAA/AOML/Hurricane Research Division, Miami,<br />
Florida<br />
CORRESPONDING AUTHOR: Dr. Christopher W. Landsea,<br />
NOAA/AOML/Hurricane Research Division, 4301<br />
Rickenbacker Causeway, Miami, FL 33149<br />
E-mail: chris.landsea@noaa.gov<br />
DOI:10.1175/BAMS-85-11-1699<br />
In final form 2 May 2004<br />
©2004 American Meteorological Society<br />
AMERICAN METEOROLOGICAL SOCIETY NOVEMBER 2004 | 1699
systematic and random errors that need to be corrected<br />
(Landsea 1993; Neumann 1994). Additionally, as our<br />
understanding of tropical cyclones has advanced, surface<br />
wind speed estimation techniques have changed<br />
over the years at NHC (e.g., Franklin et al. 2001), leading<br />
to biases in the historical database that have not<br />
been addressed. Finally, efforts led by J. Fernández-<br />
Partagas (Fernández-Partagas and Diaz 1996) to<br />
uncover previously undocumented hurricanes from<br />
the mid-1800s to early 1900s have greatly increased our<br />
knowledge of these past events. Based on Fernández-<br />
Partagas’ work, an extension from 1851 to 1885 has<br />
been incorporated into HURDAT and substantial revisions<br />
have been made for the period of 1886–1910.<br />
These changes were based upon quality-controlled<br />
assessments and digitization of Fernández-Partagas’<br />
work and consideration of other original data sources<br />
and studies (Landsea et al. 2004; see the sidebar on “The<br />
Atlantic Basin Hurricane Database Reanalysis Project”).<br />
Currently, reanalysis efforts are underway for the<br />
period from the 1910s through the 1990s. Although<br />
Hurricane Andrew was originally slated to be examined<br />
sequentially under this project in 2005, in the<br />
summer of 2002 NHC requested that the re-evaluation<br />
of this storm be addressed more promptly. This decision<br />
was driven by recent findings on the surface wind<br />
structure within the eyewall of major hurricanes and<br />
by the (then) upcoming 10-yr anniversary of this significant<br />
landfalling event. Hurricane Andrew caused an<br />
enormous amount of destruction in southeastern<br />
Florida: over 25,000 homes were destroyed and more<br />
than 100,000 homes damaged, 90% percent of all mobile<br />
homes in the region of landfall were leveled, over<br />
$1 billion in damage was done to local agriculture, and<br />
total direct losses exceeded $26 billion (Rappaport<br />
1994). More than 10 yr later, the region still feels the<br />
effects from this hurricane. For example, there has been<br />
a nearly tenfold increase in average property insurance<br />
THE ATLANTIC BASIN <strong>HURRICANE</strong> DATABASE <strong>REANALYSIS</strong> PROJECT<br />
The Hurricane Research Division<br />
(HRD) of NOAA’s Atlantic Oceanographic<br />
and Meteorological Laboratory<br />
is engaged in an effort to extend and<br />
improve the quality of NHC’s original<br />
North Atlantic best-track and intensity<br />
database, HURDAT, from 1851 to the<br />
present (online at www.aoml.noaa.gov/<br />
hrd/data_sub/re_anal.html). Employing<br />
consistent analysis methods and<br />
modern interpretations, the HRD<br />
HURDAT reanalysis project is helping<br />
to correct multiple errors and biases,<br />
determine better landfall attributes, and<br />
provide additional track and intensity<br />
data for tropical cyclones included in<br />
the database (Landsea et al. 2004).<br />
Through inspection of historical<br />
meteorological records and accounts,<br />
previously unknown tropical cyclones<br />
are also identified and considered as<br />
candidate storms to be added to the<br />
database. All recommended changes to<br />
HURDAT are subsequently submitted<br />
to NHC’s Best Track Change<br />
Committee for approval.<br />
As of early 2004, an extension of<br />
HURDAT from 1851 through 1885 was<br />
added to the database, and a reassessment<br />
was conducted for tropical<br />
cyclones already in HURDAT for the<br />
period of 1886–1910. These alterations<br />
resulted in the addition of over 262<br />
new tropical cyclones and revisions<br />
made to another 185 of the 456 total<br />
tropical storms and hurricanes that are<br />
in the latest version of the database<br />
between 1851 and 1910. While<br />
Hurricane Andrew’s changes reported<br />
here were expedited for special<br />
reasons, current work is focusing upon<br />
the reanalysis of the remainder of the<br />
twentieth century and will be included<br />
into HURDAT in sequential order. It is<br />
anticipated that alterations and<br />
additions to the database will be<br />
needed even up through the 1990s, due<br />
to changes in our understanding of the<br />
structure of tropical cyclones, better<br />
analysis tools that are available today,<br />
and the uncovering of meteorological<br />
observations not available or utilized<br />
operationally or in previous poststorm<br />
analyses.<br />
The implications of a changing “best<br />
track” dataset are multifold. In the<br />
societal aspect, eventual benefits of an<br />
improved meteorological record of<br />
tropical storms and hurricanes include a<br />
more accurate assessment of extreme<br />
event risk for insurance interests,<br />
building code designers, and emergency<br />
managers. For tropical meteorologists,<br />
a more complete, consistent, and<br />
reliable HURDAT will provide, for<br />
example, a homogeneous record to<br />
evaluate and better predict interannual,<br />
decadal, and interdecadal variability in<br />
Atlantic basin tropical cyclone activity,<br />
as well as better standards to evaluate<br />
and validate models for track and<br />
intensity of tropical cyclones. However,<br />
a changing database does present<br />
somewhat of a “moving target” for<br />
studies that utilize HURDAT. For<br />
example, as tropical cyclone tracks and<br />
intensities are altered, official and<br />
model-based errors from past years<br />
will also change. Moreover, even the<br />
benchmarks for assessing skill in<br />
tropical cyclone track and intensity<br />
predictions [i.e., the “no skill” models<br />
of climatology and persistence (CLIPER;<br />
McAdie and Lawrence 2000) and<br />
statistical hurricane intensity forecast<br />
(SHIFOR; DeMaria and Kaplan 1999),<br />
respectively] will need to be rederived<br />
once a stable database exists after the<br />
reanalysis is complete. In the meantime,<br />
researchers in the field should be<br />
aware that the officially assessed track<br />
and intensity of storms that they are<br />
studying may be changed in the near<br />
future. While such changes may be<br />
somewhat problematic in the short<br />
term, a uniformly analyzed, improvedquality<br />
tropical storm and hurricane<br />
database will be beneficial in the long<br />
run for all users of HURDAT.<br />
1700 |<br />
NOVEMBER 2004
costs for hurricane wind damage in some coastal locations<br />
and limited availability of privately underwritten<br />
insurance (Chandler and Charles 2002).<br />
Society needs reliable information as to the frequency<br />
and severity of past catastrophic events to best<br />
plan for the future. Therefore, it is crucial that accurate<br />
historical accounts of the characteristics of all tropical<br />
cyclones be obtained. This is of particular importance<br />
for significant landfalling hurricanes like Andrew.<br />
Recently, our understanding of the surface wind field<br />
in hurricanes has advanced dramatically (Franklin et al.<br />
2003; Dunion et al. 2003). New global positioning system<br />
(GPS) dropwindsonde observations in hurricane<br />
eyewalls—first collected in the eastern North Pacific<br />
from Hurricane Guillermo in 1997—suggest that the<br />
intensities of all of the hurricanes in the aircraft reconnaissance<br />
era up through 1998 should be re-examined<br />
when the primary method for estimating surface winds<br />
was from flight-level wind adjustments.<br />
In August 2002, NHC’s Best Track Change Committee,<br />
chaired by C. J. McAdie, with members J. L.<br />
Beven II, J. M. Gross, B. R. Jarvinen, R. J. Pasch, and<br />
E. N. Rappaport, with H. Saffir serving as a noncommittee<br />
observer, met to consider proposed revisions<br />
to the official intensity of Hurricane Andrew both over<br />
the open ocean and at landfall. Complete documentation<br />
of the presentations given by E. N. Rappaport, J. L.<br />
Franklin, M. D. Powell, P. G. Black, and C. W. Landsea,<br />
e-mail exchanges on the issue, the committee’s full<br />
decision, and the revised database can be found online<br />
(www.aoml.noaa.gov/hrd/hurdat/index.html). The<br />
purpose of this paper is to provide a more permanent<br />
summary of the evidence and issues considered by the<br />
committee, to record the outcome of the reanalysis, and<br />
to discuss some of the implications of these changes.<br />
ASSESSING MAXIMUM SURFACE WINDS<br />
IN <strong>HURRICANE</strong>S. The original NHC estimates of<br />
Hurricane Andrew’s intensity for most of its over-water<br />
life cycle were based primarily upon an adjustment of<br />
aircraft reconnaissance flight-level winds to the surface.<br />
In particular, Hurricane Andrew’s intensity at landfall<br />
in southeastern Florida was largely determined shortly<br />
after its passage by adjusting the peak U.S. Air Force<br />
reconnaissance aircraft 700-mb flight-level winds of<br />
162 kt to 125 kt at the surface—an adjustment factor of<br />
77%. 1 An analysis of Andrew by Powell and Houston<br />
(1996) came to a similar conclusion—that maximum<br />
1-min surface winds of 128 kt impacted the southeastern<br />
Florida coast. However, two recent studies by<br />
Franklin et al. (2003) and Dunion et al. (2003) provide<br />
strong evidence that the methodology originally used<br />
to assess the maximum 1-min surface wind in the<br />
poststorm analyses of Hurricane Andrew (Rappaport<br />
1994; Mayfield et al. 1994; Powell and Houston 1996)<br />
resulted in winds too low for a substantial portion<br />
(~5 days) of the lifetime of the storm. (See the sidebar<br />
on “New understanding of eyewall structure since<br />
Hurricane Andrew” for details that have led to these<br />
changes in the methodology for determining intensity,<br />
and for discussion about the adjustment factor.)<br />
Aircraft reconnaissance flights have been standard<br />
operating procedure since the 1940s for tropical storms<br />
and hurricanes threatening land in the Atlantic basin.<br />
In the absence of contradictory evidence, current operational<br />
practice at NHC is to estimate the surface<br />
maximum 1-min wind intensity of a hurricane at about<br />
90% of the peak 10-s wind present at the 700-mb level<br />
(i.e. the “90% rule,” Franklin et al. 2001, 2003). Such a<br />
methodology likely will remain a primary tool for assessing<br />
intensity in Atlantic basin hurricanes for at least<br />
the next few years.<br />
ESTIMATING ANDREW’S <strong>INTENSITY</strong>. Aircraft<br />
reconnaissance data. As Hurricane Andrew approached<br />
Florida in late August 1992, it was monitored almost<br />
continuously by U.S. Air Force reconnaissance aircraft<br />
measuring flight-level winds at 700 mb and obtaining<br />
minimum sea level pressure data. At 0810 UTC, about<br />
an hour prior to Andrew’s landfall in mainland<br />
southeastern Florida, an Air Force reconnaissance<br />
aircraft at 700 mb measured a 10-s-average wind of<br />
162 kt. Application of a 90% adjustment factor to this<br />
flight-level wind produces a surface wind estimate of<br />
146 kt. Similarly adjusted 10-s-average flight-level winds<br />
at 0809 and 0811 UTC yield surface values of 140 and<br />
141 kt, respectively. During the aircraft’s subsequent<br />
pass through the hurricane, an additional 10-s report<br />
at 0918 UTC yields a surface value of 137 kt using the<br />
same reduction. The importance of these additional<br />
observations is that they indicate that the flight-level<br />
observation at 0810 UTC was not an isolated condition.<br />
Analyses from the current Hurricane Wind Analysis<br />
System (H*Wind) surface wind algorithm (Dunion<br />
and Powell 2002) provide a marine exposure surface<br />
wind estimate of 153 kt, or 94% of the flight-level ob-<br />
1<br />
NHC’s operational estimate of Hurricane Andrew’s intensity at landfall in southeastern Florida was slightly lower—120 kt. The<br />
operational wind speed and position estimates of all Atlantic basin tropical storms and hurricane are reanalyzed soon after the<br />
event for a poststorm “best track” assessment, which may differ slightly from that given in real time.<br />
AMERICAN METEOROLOGICAL SOCIETY NOVEMBER 2004 | 1701
NEW UNDERSTANDING <strong>OF</strong> EYEWALL STRUCTURE SINCE <strong>HURRICANE</strong> ANDREW<br />
A key issue confronting both operational<br />
estimates and postanalysis assessments of<br />
hurricane intensity is the most appropriate<br />
way to adjust flight-level winds typically at<br />
700 mb down to surface wind values. Tensecond<br />
averages of the flight-level wind in<br />
the inner core of hurricanes are assumed to<br />
represent a 1-min-averaged wind (Powell<br />
et al. 1991). Longer averaging of the flightlevel<br />
winds would tend to underestimate<br />
the true maximum 1-min wind speeds<br />
because the aircraft does not remain long<br />
in the peak gradient region on a radial flight<br />
track, especially in relatively small hurricanes<br />
like Andrew. The best method for adjusting<br />
these winds to the surface had previously<br />
been unclear, because the most thorough<br />
study of flight-level winds to surface wind<br />
observations (i.e., Powell and Black 1990)<br />
contained mainly tropical storm–force<br />
maximum winds and few observations in<br />
the eyewall region.<br />
A new understanding of the surface<br />
wind structure in hurricanes was made<br />
possible by an advance in technology, the<br />
GPS dropwindsonde (Hock and Franklin<br />
1999), which provided the first detailed<br />
wind profile in a hurricane’s eyewall from<br />
the flight level to the ocean surface. Nearsurface<br />
data from individual dropwindsondes<br />
have compared favorably with<br />
concurrent observations from moored<br />
buoys and C-MAN stations (Houston et al.<br />
2000) and collocated Stepped Frequency<br />
Microwave Radiometer data (Uhlhorn and<br />
Black 2003), although both of these studies<br />
have limited observations from the core of<br />
major hurricanes. While individual GPS<br />
dropwindsondes provide only a momentary<br />
slice of data (which is not even a vertical<br />
profile because of the inflowing and swirling<br />
flow that the drop encounters in the<br />
hurricane eyewall), a judicious partitioning<br />
and averaging of the dropwindsondes can<br />
provide useful wind mean wind conditions<br />
within the hurricane.<br />
Franklin et al. (2003) examined several<br />
hundred over-ocean GPS dropwindsonde<br />
profiles in the hurricane eyewall and have<br />
shown that the mean ratio of surface-to-<br />
700-mb winds is about 90% in the eyewall<br />
region. Franklin et al. recommended a set of<br />
adjustment factors for the interpretation of<br />
tropical cyclone flight-level data. The results<br />
from the drop profile analyses in Franklin<br />
et al.’s (2003) study provide a way to infer<br />
winds at one level from those at another.<br />
This adjustment assumes a similar averaging<br />
time at both levels, but is not constrained<br />
to any particular averaging time. For the<br />
stronger (right hand) side of the eyewall,<br />
they found that the mean surface-to-<br />
700-mb ratio was between 86% and 90%.<br />
Thus, without additional information,<br />
estimates of the surface maximum 1-min<br />
wind intensity of a hurricane at the<br />
<strong>National</strong> Hurricane Center are assessed to<br />
be about 90% SB1 of the peak 10-s wind<br />
observed at the 700-mb level from an<br />
aircraft.<br />
Recent work by Dunion and Powell<br />
(2002) and Dunion et al. (2003) also<br />
supports a revised flight-level-to-surfacewind<br />
adjustment in the context of the<br />
Hurricane Research Division’s H*Wind<br />
surface wind analyses of tropical cyclones.<br />
H*Wind is an analysis tool that can<br />
assimilate a variety of observations within a<br />
tropical cyclone to produce a stormcentered<br />
few-hour composite of the<br />
surface wind field (Powell 1980; Powell<br />
et al. 1996, 1998). Given sufficient<br />
observations, the analyses can be used to<br />
make estimates of the maximum 1-min<br />
winds, as well as radii of tropical storm–<br />
force or hurricane-force winds.<br />
Using information from the GPS<br />
dropwindsondes, techniques were<br />
developed to improve H*Wind’s adjustment<br />
of aircraft flight-level winds to the<br />
surface. Dunion and Powell (2002) and<br />
Dunion et al. (2003) utilized the dropwindsonde<br />
data to revise the H*Wind<br />
algorithms in a two-step process. First,<br />
analyses of the dropwindsondes show that<br />
the original H*Wind assumption that<br />
700-mb flight-level winds were equivalent<br />
to mean boundary layer (0–500 m) winds<br />
produced an underestimation of the true<br />
boundary layer winds. Second, the<br />
dropwindsondes showed that the overocean<br />
surface-to-mean-boundary-layerwind<br />
ratio reached a minimum at mean<br />
boundary layer wind speeds of 100–110 kt.<br />
This ratio was found to increase with<br />
stronger winds, in contrast to an assumed<br />
steadily decreasing ratio with stronger<br />
boundary layer winds previously utilized in<br />
H*Wind (Dunion et al. 2003; Powell et al.<br />
2003). The combined effect of these two<br />
new changes to H*Wind produces<br />
substantially higher (10%–20%) analyzed<br />
maximum 1-min surface winds for major<br />
hurricanes, particularly when based on<br />
reductions of aircraft reconnaissance data<br />
from 700 mb. For major hurricanes, the<br />
new H*Wind methodology provides<br />
surface wind analyses with marine exposure<br />
from extrapolated flight-level wind<br />
observations that generally agree to within<br />
5% of the Franklin et al. (2003) estimates.<br />
Such agreement between the two<br />
methods may not be surprising, because<br />
they are both based upon new formulations<br />
from the nearly identical sets of<br />
archived GPS dropwindsonde data. It is<br />
worth noting, however, that both<br />
methodologies had limited data available in<br />
the extreme high-wind range typical of that<br />
found in Hurricane Andrew’s eyewall,<br />
though both schemes included<br />
dropwindsondes from Hurricane Mitch<br />
when it was a SSHS Category-5 system.<br />
Another consideration is that the<br />
dropwindsondes had a higher failure rate in<br />
providing winds near the surface under<br />
extreme conditions. This limitation was<br />
partially overcome by filling in the profile<br />
down to 10 m with mean conditions from<br />
hurricane eyewall dropwindsondes that did<br />
provide wind data to the ocean’s surface,<br />
as long as the filled-in dropwindsonde<br />
reported winds down to no higher than<br />
30 m (Dunion et al. 2003; Franklin et al.<br />
2003). This technique to maximize surface<br />
wind observations was likely conservative in<br />
its surface wind estimates because of the<br />
observed tendency for the surface winds to<br />
increase relative to the boundary layer<br />
average winds in higher wind regimes.<br />
SB1<br />
This factor is at the high end of the range<br />
established by the dropwindsondes (86%–<br />
90%), in part because of simple rounding<br />
of the midpoint of this range, but also to<br />
account for the likelihood that the<br />
cyclone’s highest 700-mb wind speed was<br />
not sampled during the typical “figure 4”<br />
tracks routinely flown through hurricanes<br />
by reconnaissance aircraft.<br />
1702 | NOVEMBER 2004
servations from the 0810 UTC reconnaissance data<br />
(Fig. 1). This result is in reasonable agreement with the<br />
recommended adjustment from the Franklin et al.<br />
(2003) methodology.<br />
Assuming that the 162-kt flight-level aircraft wind<br />
was representative of the peak 700-mb winds that were<br />
present in Andrew’s circulation, a surface adjustment<br />
factor of 77% is required to diagnose Andrew at 125 kt<br />
was originally assessed. Of the 17 hurricanes examined<br />
by Franklin et al. (2003), none were observed with GPS<br />
dropwindsondes to have a mean adjustment factor this<br />
low in the eyewall. The lowest observed ratio of 83%<br />
was found in Hurricane Bonnie—a weakly convective<br />
storm with a large eye. 2 Furthermore, the adjustment<br />
factor to provide surface winds appears to increase<br />
when the boundary layer winds are very<br />
high (Dunion et al. 2003; Franklin et al. 2003)<br />
and when vertical motions are particularly<br />
vigorous (at least 1.5 m s –1 absolute vertical<br />
velocity between the ocean’s surface to<br />
2000 m; Franklin et al. 2003). Andrew likely<br />
satisfied both of these conditions at its landfall<br />
in southeastern Florida. Thus, there is<br />
little evidence from the dropwindsondes<br />
datasets to support Andrew having a lowerthan-normal<br />
adjustment factor in the<br />
eyewall region.<br />
reported agreement with 700-mb flight-level winds to<br />
within 10%, though the radar-derived winds have a<br />
relatively noisy signal and must be quality controlled<br />
before use. The three highest feature speeds found in<br />
the Andrew data were 171 kt at 700 m at 0739 UTC,<br />
176 kt at 400 m at 0839 UTC, and 180 kt at 1100 m at<br />
0730 UTC (Fig. 2), with heights based upon the radar<br />
tilt and distance from the radar site. The strongest of<br />
these velocities does not appear consistent with nearby<br />
radar feature tracks. Making the assumption that the<br />
average of the remaining two observations (174 kt) represents<br />
the maximum eyewall winds near the boundary<br />
layer top (BLT), we can adjust this wind to the<br />
surface using mean dropwindsonde profiles. Applying<br />
the Franklin et al. (2003) eyewall mean profile for the<br />
Radar-derived wind vectors. Low-altitude radar<br />
feature tracking presented by P. Dodge<br />
to the committee suggested surface winds<br />
similar to those implied by applying a 90%<br />
adjustment factor to the flight-level data.<br />
Figures 2 and 3 show vectors based on<br />
feature tracking from the Miami, Florida,<br />
Weather Surveillance Radar-1957 (WSR-57)<br />
outside and within Andrew’s eyewall just<br />
prior to landfall in southeastern Florida (see<br />
a loop of this radar reflectivity data online<br />
at www.aoml.noaa.gov/hrd/hurdat/<br />
andrew_cells.mpg). This technique has<br />
been demonstrated to provide lower-tropospheric<br />
wind vectors in the circulation of<br />
a hurricane that are comparable to those<br />
measured by aircraft. Tuttle and Gall (1999)<br />
2<br />
However, hurricanes with stable boundary layers<br />
moving north of the Gulf Stream over cool waters,<br />
such as Gloria in 1985 (Powell and Black<br />
1990) and Bob in 1991, were analyzed to have surface-to-flight-level<br />
wind ratios as low as 55%<br />
based on buoy observations.<br />
FIG. 1. H*Wind 1-min surface wind analysis for Hurricane Andrew<br />
at landfall in southeastern Florida around 0900 UTC 24 Aug 1992<br />
from the revised methodology of Dunion et al. (2003) and Dunion<br />
and Powell (2002), which takes into account the vertical structure<br />
of the horizontal winds as demonstrated from recent GPS<br />
dropwindsonde data. Winds at the coast show a discontinuity due<br />
to increased roughness length as one goes from over open-ocean<br />
conditions to overland open-terrain conditions. Numbers in the<br />
upper-left corner indicate quadrant-based radii of 34-, 50-, and 64-<br />
kt surface winds.<br />
AMERICAN METEOROLOGICAL SOCIETY NOVEMBER 2004 | 1703
FIG. 2. Hurricane Andrew low-altitude radar feature<br />
tracks (kt) from the Miami WSR-57 radar before the<br />
radar was destroyed by the hurricane.<br />
strongest BLT wind speeds in their sample (135–155 kt,<br />
their Fig. 12) gives an 82% adjustment factor and a surface<br />
wind estimate of 143 kt.<br />
The Dunion and Powell (2002) methodology was<br />
also applied to these new radar-derived wind vectors.<br />
Their analysis system suggests that these low-altitude<br />
radar feature tracks correspond to winds of 148 kt at<br />
the ocean’s surface, again in close agreement with the<br />
estimates from the Franklin et al. (2003) methodology.<br />
FIG. 3. WSR-57 radar reflectivity image of Hurricane<br />
Andrew at 0759 UTC. The center of the diamond indicates<br />
the position of the Fowey Rocks C-MAN station<br />
relative to the location of the eyewall. The three “plus”<br />
symbols indicate reflectivity features that were tracked<br />
between successive radar sweeps to provide low-level<br />
wind vectors. The radar reflectivity scale is red (46),<br />
purple (39), orange (33), dark green (27), black (20), and<br />
dark blue (14 dBZ).<br />
Surface observations. The NHC Best Track Change<br />
Committee reviewed the available surface observations<br />
from Andrew’s landfall to determine whether<br />
they were consistent with the dropwindsonde-based<br />
adjustments of flight-level and radar winds discussed<br />
in the previous two sections. In particular, they focused<br />
upon two key observations: Fowey Rocks, Florida, and<br />
R. Fairbanks (an amateur weather observer located in<br />
Perrine, Florida) data (Rappaport 1994; Mayfield et al.<br />
1994; Powell et al. 1996). The Fowey Rocks Coastal<br />
Marine Automated Network (C-MAN) weather station<br />
(elevation 44 m) reported a peak 2-min mean wind<br />
of 122 kt at its last hourly transmission before it failed<br />
after 0802 UTC. This adjusts to approximately 111 kt<br />
for a maximum 1-min surface (10 m) wind valid for<br />
over open-water exposure. At this station, the winds<br />
increased dramatically in the last hour of reporting.<br />
In particular, an 18 kt increase in the 10-min mean wind<br />
between 0749 and 0759 UTC (not shown) in conjunction<br />
with the location of the station relative to<br />
Andrew’s eyewall (Fig. 3) provides strong evidence that<br />
the surface winds at that location had not yet leveled<br />
off and would likely have continued to increase to substantially<br />
higher values had it survived for at least a<br />
few more minutes. [Typically, the surface radius of<br />
maximum wind occurs at the inner edge of the eyewall<br />
or even just inside the eye when viewed by radar in<br />
the lower troposphere (Marks et al. 1992).] Based<br />
upon the position of the Fowey Rocks station, the<br />
movement of Hurricane Andrew, and an estimate of<br />
the surface radius of maximum wind for that portion<br />
of the storm, it is calculated by J. Beven that the station<br />
would likely have encountered the peak winds in<br />
the northern eyewall at about 0820 UTC, about 20 min<br />
after its final report. Assuming a linear increase of<br />
winds during this time (a conservative estimate), the<br />
peak 10-min mean station wind may have reached<br />
145 kt. After adjusting for both station height and averaging<br />
period, this converts to approximately 148 kt<br />
for a maximum 1-min surface (10 m) wind valid for<br />
over open-water exposure.<br />
R. Fairbanks noted a peak gust of 184 kt (corrected<br />
to 154 kt after adjusting for the overestimation bias of<br />
1704 | NOVEMBER 2004
this type of instrument) from his home-based anemometer<br />
just before it failed. This observation was<br />
believed to be consistent with a 1-min open-terrain<br />
surface wind of about 119 kt, after employing typical<br />
gust factors (Powell et al. 1996). R. Fairbanks’ observation<br />
had no wind direction associated with it and only<br />
an approximate time (0830–0900 UTC). The strongest<br />
winds experienced at the location of R. Fairbanks’ home<br />
were probably not earlier than 0900 UTC, based upon<br />
Miami, Florida, radar imagery extrapolated to the time<br />
that the inner edge of the eyewall and the surface radius<br />
of maximum winds would have encountered the<br />
home (Powell et al. 1996).<br />
As a result, C. Landsea argued that both the Fowey<br />
Rocks and R. Fairbanks instruments appeared to have<br />
failed before the strongest winds of Andrew arrived,<br />
because these observations were taken in the northwest<br />
portion of the eyewall 3 outside of the surface<br />
radius of maximum winds. The peak winds were likely<br />
closer to the storm’s center in the northern portion of<br />
the eyewall (Fig. 1). Thus, neither of these observations<br />
seem to represent the maximum winds of Hurricane<br />
Andrew at landfall in southeastern Florida.<br />
Inspection of these surface observations in comparison<br />
with surface-reduced flight-level data in Fig. 1 did<br />
not suggest a large inconsistency, though it is difficult<br />
to directly compare them for three reasons. First, the<br />
flight-level data primarily were in radial legs running<br />
north–south and east–west, which did not coincide well<br />
spatially with the Fowey Rocks and R. Fairbanks observations<br />
near the time of landfall after compositing<br />
the data with respect to the hurricane’s center. Second,<br />
the Powell and Houston (1996) methodology for estimating<br />
the surface radius of the maximum wind (which<br />
was used in Fig. 1) appears to be too large [11 n mi<br />
(20 km) versus 8–9 n mi (15–17 km)] compared with<br />
the observed location of the wind center and the highest<br />
storm surge, which was thought to coincide with<br />
the peak surface winds. 4 Thus, the strongest surface<br />
winds in Fig. 1 were spread out too far radially, making<br />
direct comparisons of extrapolated flight-level winds<br />
from H*Wind analyses and in situ surface observations<br />
problematic. Finally, because of the turbulent and transient<br />
nature of the hurricane wind field, it is not<br />
straightforward to make direct comparisons between<br />
a storm-centered composite of the adjusted flight-level<br />
winds and a small number of in situ observations. It<br />
would take a systematic discrepancy over many observation<br />
points to determine that the standard 90%<br />
flight-level adjustment factor was invalid for a particular<br />
storm.<br />
Winds at the coastline and over land. While there was<br />
unanimous agreement among the presenters and<br />
committee members that Andrew’s intensity was<br />
underanalyzed during its open-water approach to<br />
southeastern Florida, there was lengthy discussion<br />
whether these strong winds were also felt along the<br />
coastline and over land. The current understanding is<br />
that the well-developed hurricane boundary layer is<br />
different over land than it is over water and that there<br />
must be a transition zone at or near the coastline between<br />
these two regimes. It was suggested (Powell et al.<br />
2003) that the winds in the northern eyewall were weakened<br />
by increased roughness presented by shoaling and<br />
breaking waves in the shallow waters between the fringing<br />
reefs, Biscayne Bay, and the coastline before the<br />
storm made landfall. In this case, Biscayne Bay may<br />
not have represented a typical marine exposure with a<br />
small roughness length, but instead may have been<br />
more consistent with conditions experienced in an<br />
overland environment with open-exposure terrain.<br />
However, recent analyses of ocean waves within<br />
Hurricane Bonnie at landfall in North Carolina show<br />
that waves do not generally increase in height from<br />
shoaling in shallow waters, but instead show a large<br />
decrease from offshore (8–10-m mean wave heights)<br />
to the coastal locations (4–5 m) (Walsh et al. 2002).<br />
3<br />
The Fairbanks observation may instead have been in the north eyewall if it occurred around 0900 UTC, but the time of the<br />
measurement and, thus, its storm-relative location at the time of the peak measured gust are uncertain.<br />
4<br />
The location of the peak storm surge caused by a hurricane can be influenced by a number of factors in addition to the radius of<br />
the maximum wind, including coastline shape, local offshore bathymetry/inland topography, astronomical tides, wave setup,<br />
inflow angle, etc. (i.e., Jelesnianski 1993). However, for the specific case of Hurricane Andrew’s landfall in southeast Florida, these<br />
factors appear to be secondary in comparison to the surface radius of maximum winds (RMW) for forcing the peak storm-surge<br />
location along the coast. Sensitivity testing using the Sen, Lake, and Overland Surges from Hurricanes (SLOSH) model run with<br />
the observed Hurricane Andrew characteristics (track, central pressure, environmental pressure) and varying the RMW<br />
demonstrates the primary influence of RMW for this specific case. These runs suggest that only with a smaller RMW [8–9 n mi<br />
versus Powell and Houston’s (1996) 11 n mi] does one match the observed storm-surge pattern and location of the peak surge<br />
value. (It is, however, possible that the open exposure to the ocean east of the area of the peak storm surge may have allowed for<br />
additional wave impacts, which are not explicitly modeled by SLOSH and may somewhat complicate the RMW analysis.)<br />
AMERICAN METEOROLOGICAL SOCIETY NOVEMBER 2004 | 1705
While the bathymetry of the waters offshore of south<br />
Florida where Andrew hit is somewhat different from<br />
North Carolina, if such decreased wave heights did<br />
occur, it is not clear what these would imply when combined<br />
with breaking waves for changes to the roughness<br />
length relative to the open ocean.<br />
J. Franklin presented the committee with an analysis<br />
of available GPS dropwindsondes near shore (within<br />
10 km) and offshore (10–60 km) in the right eyewall of<br />
hurricanes making landfall in the United States. This<br />
preliminary study suggested that there could be some<br />
reduction in surface winds along the immediate coastal<br />
waters. A very limited sample of 19 dropwinsondes in<br />
the eyewalls of weak to moderate hurricanes shows an<br />
apparent 5%–10% reduction of surface wind as the<br />
coastline is approached. Using this alteration to the<br />
Franklin et al. (2003) surface wind methodology gives<br />
maximum 1-min winds at the coast of roughly 130 to<br />
140 kt. However, given the extremely small sample of<br />
dropwindsondes (i.e., 10 near shore and 9 just offshore)<br />
and lack of any major hurricanes in this coastal analysis,<br />
such results were considered by the Best Track<br />
Change Committee to be too speculative to be applied<br />
at this time. 5 Clearly, more dropwindsonde data are<br />
needed both in the transition zone between land and<br />
water, as well as in the hurricane boundary layer over<br />
land, to properly assess the degree to which a hurricane’s<br />
surface winds over open water reach the coastline.<br />
from the WSR-57 radar in Tampa, satellite intensity<br />
estimates, storm-surge modeling runs, and surveys of<br />
wind-caused damage. These measures (discussion of<br />
these parameters can be found online at www.aoml.<br />
noaa.gov/hrd/hurdat/index.html) were mainly consistent<br />
with the revised surface wind estimates discussed<br />
in earlier sections, though they were of secondary importance<br />
to the final NHC Best Track Change Committee<br />
decision.<br />
BEST-TRACK CHANGES. After considering the<br />
presentations regarding various recommendations for<br />
the revisions of Andrew’s best-track intensities, the<br />
NHC Best Track Change Committee made alterations<br />
to the winds in HURDAT for Hurricane Andrew<br />
(Table 1 and Fig. 4) for 22–26 August. These changes<br />
were made to Hurricane Andrew’s intensity data for<br />
the time while the storm was over the Atlantic Ocean<br />
just east of the Bahamas, over the Bahamas and south<br />
Florida, over the Gulf of Mexico, and at landfall in<br />
Louisiana (Fig. 5). Neither the best-track positions nor<br />
the central pressure values of Andrew were adjusted.<br />
The alterations in wind intensity were based upon the<br />
Franklin et al. (2003) methodology, which is consistent<br />
with the work of Dunion et al. (2003) and Dunion and<br />
Powell (2002) as discussed earlier. The changes to<br />
HURDAT were applied for these dates as aircraft reconnaissance<br />
observations were available throughout<br />
Other evidence for Andrew’s intensity.<br />
While the primary pieces of evidence<br />
for altering Hurricane<br />
Andrew’s intensity came from revised<br />
extrapolations of flight-level<br />
winds and radar feature track data,<br />
other information on the intensity<br />
was also available and considered<br />
in the reanalysis. These were the<br />
continued central pressure drop<br />
after the measurement of the peak<br />
aircraft wind report, pressure–<br />
wind relationships, surface pressure<br />
gradients, high-altitude radar<br />
reflectivity eyewall core velocities<br />
5<br />
The <strong>National</strong> Hurricane Center’s operational<br />
estimates, as well as the<br />
poststorm best-track assessments, have<br />
historically made the assumption that<br />
an otherwise steady-state hurricane’s<br />
maximum winds over water do survive<br />
to the coastline.<br />
FIG. 4. Selected wind observations and original (solid)/revised (dashed)<br />
best-track maximum 1-min surface wind speed curve for Hurricane<br />
Andrew, 20–27 Aug 1992. Aircraft observations have been adjusted for<br />
elevation using 90%, 80%, and 75% reduction factors for data collected at<br />
700 mb, at 850 mb, and near 450 m, respectively (Franklin et al. 2003).<br />
1706 | NOVEMBER 2004
TABLE 1. Revisions in the 6-hourly HURDAT and at landfall in the Bahamas and the United States for Hurricane<br />
Andrew, 16–28 August 1992. Changes are listed in bold, original best rack is in parenthesis. Note that the landfall<br />
indicated for Elliott Key had not previously been described explicitly. Note also that the continental U.S. hurricane<br />
impacts for HURDAT are changed from “CFL4BFL3 LA3” (southeastern Florida as Category 4, southwestern<br />
Florida as Category 3, and Louisiana as Category 3) to “CFL5BFL4 LA3” (southeastern Florida as Category 5,<br />
southwestern Florida as Category 4, and Louisiana as Category 3).<br />
Date/Time<br />
UTC<br />
Latitude<br />
°N<br />
Longitude<br />
°W<br />
Central<br />
pressure (mb)<br />
Maximum<br />
wind speed (kt)<br />
Storm<br />
status<br />
16/1800<br />
17/0000<br />
17/0600<br />
17/1200<br />
17/1800<br />
18/0000<br />
18/0600<br />
18/1200<br />
18/1800<br />
19/0000<br />
19/0600<br />
19/1200<br />
19/1800<br />
20/0000<br />
20/0600<br />
20/1200<br />
20/1800<br />
21/0000<br />
21/0600<br />
21/1200<br />
21/1800<br />
22/0000<br />
22/0600<br />
22/1200<br />
22/1800<br />
23/0000<br />
23/0600<br />
23/1200<br />
23/1800<br />
24/0000<br />
24/0600<br />
24/1200<br />
24/1800<br />
25/0000<br />
25/0600<br />
25/1200<br />
25/1800<br />
26/0000<br />
26/0600<br />
26/1200<br />
26/1800<br />
27/0000<br />
27/0600<br />
27/1200<br />
27/1800<br />
28/0000<br />
28/0600<br />
10.8<br />
11.2<br />
11.7<br />
12.3<br />
13.1<br />
13.6<br />
14.1<br />
14.6<br />
15.4<br />
16.3<br />
17.2<br />
18.0<br />
18.8<br />
19.8<br />
20.7<br />
21.7<br />
22.5<br />
23.2<br />
23.9<br />
24.4<br />
24.8<br />
25.3<br />
25.6<br />
25.8<br />
25.7<br />
25.6<br />
25.5<br />
25.4<br />
25.4<br />
25.4<br />
25.4<br />
25.6<br />
25.8<br />
26.2<br />
26.6<br />
27.2<br />
27.8<br />
28.5<br />
29.2<br />
30.1<br />
30.9<br />
31.5<br />
32.1<br />
32.8<br />
33.6<br />
34.4<br />
35.4<br />
35.5<br />
37.4<br />
39.6<br />
42.0<br />
44.2<br />
46.2<br />
48.0<br />
49.9<br />
51.8<br />
53.5<br />
55.3<br />
56.9<br />
58.3<br />
59.3<br />
60.0<br />
60.7<br />
61.5<br />
62.4<br />
63.3<br />
64.2<br />
64.9<br />
65.9<br />
67.0<br />
68.3<br />
69.7<br />
71.1<br />
72.5<br />
74.2<br />
75.8<br />
77.5<br />
79.3<br />
81.2<br />
83.1<br />
85.0<br />
86.7<br />
88.2<br />
89.6<br />
90.5<br />
91.3<br />
91.7<br />
91.6<br />
91.1<br />
90.5<br />
89.6<br />
88.4<br />
86.7<br />
84.0<br />
1010<br />
1009<br />
1008<br />
1006<br />
1003<br />
1002<br />
1001<br />
1000<br />
1000<br />
1001<br />
1002<br />
1005<br />
1007<br />
1011<br />
1013<br />
1015<br />
1014<br />
1014<br />
1010<br />
1007<br />
1004<br />
1000<br />
994<br />
981<br />
969<br />
961<br />
947<br />
933<br />
922<br />
930<br />
937<br />
951<br />
947<br />
943<br />
948<br />
946<br />
941<br />
937<br />
955<br />
973<br />
991<br />
995<br />
997<br />
998<br />
999<br />
1000<br />
1000<br />
25<br />
30<br />
30<br />
35<br />
35<br />
40<br />
45<br />
45<br />
45<br />
45<br />
45<br />
45<br />
45<br />
40<br />
40<br />
40<br />
40<br />
45<br />
45<br />
50<br />
50<br />
55<br />
65 (60)<br />
80 (70)<br />
95 (80)<br />
110 (90)<br />
130 (105)<br />
145 (120)<br />
150 (135)<br />
125<br />
130 (120)<br />
115 (110)<br />
115<br />
115<br />
115<br />
120 (115)<br />
125 (120)<br />
125(120)<br />
120 (115)<br />
80<br />
50<br />
35<br />
30<br />
30<br />
25<br />
20<br />
20<br />
Tropical depression<br />
“<br />
“<br />
Tropical storm<br />
“<br />
“<br />
“<br />
“<br />
“<br />
“<br />
“<br />
“<br />
“<br />
“<br />
“<br />
“<br />
“<br />
“<br />
“<br />
“<br />
“<br />
“<br />
Hurricane<br />
“<br />
“<br />
“<br />
“<br />
“<br />
“<br />
“<br />
“<br />
“<br />
“<br />
“<br />
“<br />
“<br />
“<br />
“<br />
“<br />
“<br />
Tropical storm<br />
“<br />
Tropical depression<br />
“<br />
“<br />
“<br />
“<br />
AMERICAN METEOROLOGICAL SOCIETY NOVEMBER 2004 | 1707
TABLE 1. Continued.<br />
Date/Time<br />
UTC<br />
Latitude<br />
°N<br />
Longitude<br />
°W<br />
Central<br />
pressure (mb)<br />
Maximum<br />
wind speed (kt)<br />
Storm<br />
status<br />
23/1800<br />
24/0905<br />
23/2100<br />
24/0100<br />
24/0840<br />
24/0905<br />
25.4<br />
25.5<br />
25.4<br />
25.4<br />
25.5<br />
25.5<br />
75.8<br />
80.3<br />
76.6<br />
77.8<br />
80.2<br />
80.3<br />
922<br />
922<br />
923<br />
931<br />
926<br />
922<br />
150 (135)<br />
145 (125)<br />
140 (130)<br />
130 (125)<br />
145<br />
145 (125)<br />
Minimum pressure<br />
“<br />
Eleuthera landfall<br />
Berry Island landfall<br />
Elliott Key, FL, landfall<br />
Fender Point, FL, landfall<br />
[8 nmi (13km) eastnortheast<br />
of Homestead, FL]<br />
Pt. Chevreuil, LA<br />
26/0830<br />
29.6<br />
91.5<br />
956<br />
100 (105)<br />
FIG. 5. A portion of the track for Hurricane Andrew with an emphasis on where<br />
changes were made in its intensity.<br />
this period and there were limited in situ surface observations<br />
indicative of the maximum 1-min surface<br />
winds. The revisions made Andrew a Saffir–Simpson<br />
Hurricane Scale (SSHS; Saffir 1973; Simpson 1974)<br />
category-5 (i.e., maximum 1-min surface winds of at<br />
least 136 kt) hurricane at landfall in both Eleuthera<br />
Island, Bahamas, and in southeastern Florida. The<br />
maximum 1-min surface wind for Hurricane Andrew<br />
at landfall in mainland southeastern Florida near<br />
Fender Point [8 n mi (13 km) east of Homestead,<br />
Florida] at 0905 UTC 24 August was officially estimated<br />
to be 145 kt. (The original 1992 NHC best-track landfall<br />
intensity estimate was 125 kt.) The peak intensity<br />
of Andrew, originally assessed at 135 kt, was reasoned<br />
to be 150 kt at 1800 UTC 23 August just east of the<br />
northern Bahamas.<br />
1708 | NOVEMBER 2004<br />
DISCUSSION <strong>OF</strong> UNCER-<br />
TAINTIES. The purpose of the<br />
reanalysis efforts is to ensure<br />
the most accurate historical<br />
hurricane record possible—<br />
one that is consistent with<br />
contemporary science. It has<br />
been suggested that the record<br />
in the case of Andrew should<br />
not have been changed, in part<br />
because of the uncertainty surrounding<br />
the maximum surface<br />
wind. However, the committee<br />
recognized that no storm’s intensity<br />
can be determined with<br />
complete accuracy; the surface<br />
observations are almost never<br />
sufficiently comprehensive, and<br />
indirect measures of surface<br />
wind must always be used.<br />
Uncertainty in a wind speed<br />
estimate should not be an obstacle<br />
to revising an earlier estimate that is inconsistent<br />
with the observations, especially if it has benefited from<br />
new advances in science and understanding.<br />
Powell et al. (1996) indicated an estimate of ±20%<br />
procedure error in assigning surface winds from<br />
flight-level aircraft reconnaissance wind data in their<br />
original methodology. For the maximum 1-min surface<br />
winds in Andrew that they analyzed, this ranges<br />
from 103 to 153 kt, reflecting the large uncertainty in<br />
the analysis methodology at that time. Franklin et al.’s<br />
(2003) examination of several hundred over-ocean<br />
hurricane eyewall dropwindsondes indicates that while<br />
the mean ratio of surface to 700-mb winds was about<br />
90%, the standard deviation was about 19%. This value<br />
is similar to the variability suggested by Powell et al.<br />
(1996).
However, this does not mean that the uncertainty<br />
in estimating peak surface winds from flight-level data<br />
is necessarily about 20%. It is important to distinguish<br />
between the following two questions: 1) given a wind<br />
observation taken at 700 mb somewhere in the hurricane<br />
eyewall, what is the underlying concurrent wind<br />
at the surface; and 2) given a storm’s maximum wind<br />
at 700 mb, what is the storm’s maximum sustained wind<br />
at the surface? The 19% standard deviation is directly<br />
applicable only to the first question posed above. This<br />
variance is not appropriate for estimating the variability<br />
in the ratio of the storm’s maximum surface to<br />
maximum 700-mb winds. The variance of the latter<br />
quantity is not known, but should be less than 19%, as<br />
illustrated by the following example.<br />
Imagine a steady-state storm in which the maximum<br />
1-min wind at the surface is 90 kt, while the maximum<br />
1-min wind at 700 mb is 100 kt. Over time, the<br />
precise location of the maxima at both the surface and<br />
700 mb may vary, but the peak values present at each<br />
level remain constant. By assumption, the variance of<br />
peak surface to peak 700-mb wind is zero. Even so, if<br />
the eyewall of this storm was to be sampled by GPS<br />
dropwindsondes, the dropwindsonde surface-to-<br />
700-mb-wind ratio would still have a large variance,<br />
because a) the wind distributions are not necessarily<br />
the same at the two levels, so a dropwindsonde that<br />
samples the maximum at 700 mb will not necessarily<br />
sample the surface maximum, and vice versa; and<br />
b) the dropwindsondes do not measure a 1-min wind,<br />
but measure whatever turbulence through which they<br />
happen to fall during a 0.5-s interval. These factors<br />
contribute to the high variance in adjustment-factor<br />
ratios computed from individual dropwindsondes, but<br />
it has very little to do with the relationship between<br />
peak winds from level to level. While a precise measure<br />
of the procedure error in applying the 90% rule<br />
may not be obtainable currently, mean eyewall profiles<br />
from different storms (Franklin et al. 2003) suggest<br />
that it may be near 10% (i.e., that the actual surface wind<br />
to 700-mb-flight-level ratio for Hurricane Andrew<br />
would have been between about 80% and 100%).<br />
It is acknowledged that the reanalysis presented<br />
here of Andrew’s intensity at landfall in southeastern<br />
Florida (and elsewhere in its lifetime) is not known with<br />
exact certainty, nor will it ever be. However, it is concluded<br />
here that Hurricane Andrew’s intensity is very<br />
likely to be in the range of 136–155 kt for the maximum<br />
1-min surface winds that impacted the coast at<br />
landfall in mainland southeastern Florida, with a best<br />
single estimate of 145 kt. It is quite unlikely that Andrew<br />
was a 125-kt hurricane at landfall (category 4) as was<br />
originally thought, consistent with the uncertainty discussion<br />
above. It should be noted that these category-<br />
5 conditions likely occurred on land only in a small region<br />
in south Dade County, Florida, close to the coast<br />
in Cutler Ridge. Most of the region in the country south<br />
of Kendall Drive (25.7°N) received category-4 or category-3<br />
hurricane conditions. Peak gusts over oceanic<br />
conditions and over land were likely to be on the order<br />
of 160–170 kt, based upon typical gust factors utilized<br />
(e.g., Powell and Houston 1996). (See the sidebar on<br />
“Implications of Hurricane Andrew’s reanalysis in the<br />
United States.”)<br />
While this reanalysis does not preclude revisiting<br />
Hurricane Andrew’s intensity in the future if needed, it<br />
is the official estimate at this time. We are working within<br />
the bounds of the state of the science to interpret surface<br />
wind conditions in hurricanes. The violent inner core<br />
of major hurricanes has always been an area with a dearth<br />
of in situ measurements of the peak winds. Numerous<br />
uncertainties remain (e.g., how representative was the<br />
162-kt flight-level winds of the peak winds in Andrew<br />
at 700 mb?; how much intensification to Andrew’s wind<br />
field occurred after the reconnaissance plane left the<br />
north eyewall?; how are surface winds in hurricanes<br />
altered in general at the ocean–coast interface?; how<br />
may further stratifications to the dropwindsonde data<br />
provide better surface wind estimates for various right<br />
versus left asymmetries and flight-level wind speed,<br />
convective, or stability regimes?). Continued data collection<br />
and research are strongly encouraged to help<br />
clarify these important issues. However, it is realized<br />
that despite progress in scientific uncertainties, the exact<br />
wind speeds caused by Hurricane Andrew in southeastern<br />
Florida and elsewhere will never be known<br />
with complete accuracy and confidence.<br />
SUMMARY.<br />
• Hurricane Andrew in 1992 originally was assessed<br />
to have reached a peak intensity and Bahamian/U.S.<br />
landfall intensity of SSHS category 4, based primarily<br />
upon adjustment of flight-level winds to the<br />
surface.<br />
• Research using GPS dropwindsondes in the late<br />
1990s and early 2000s has demonstrated that stronger<br />
winds exist at the surface in the hurricane eyewall<br />
than originally had been believed.<br />
• A reanalysis of Hurricane Andrew’s intensity,<br />
considering this new understanding, indicates that<br />
Andrew’s maximum 1-min surface winds for much<br />
of its lifetime were substantially stronger than was<br />
analyzed earlier. In particular, Hurricane Andrew<br />
is now estimated to have reached category-5 status<br />
at its landfall in both the northern Bahamas and in<br />
southeastern Florida.<br />
AMERICAN METEOROLOGICAL SOCIETY NOVEMBER 2004 | 1709
IMPLICATIONS <strong>OF</strong> <strong>HURRICANE</strong> ANDREW’S <strong>REANALYSIS</strong> IN SOUTH FLORIDA<br />
One example of a practical aspect of the<br />
outcome of Andrew’s reanalysis is the<br />
potential impact on building codes and<br />
insurance rates. Previously, Hurricane<br />
Andrew was estimated to be a SSHS<br />
category-4 hurricane at landfall in south<br />
Florida (comprising Pinellas,<br />
Hillsborough, Manatee, Sarasota,<br />
Charlotte, Lee, Collier, Monroe,<br />
Miami–Dade, Broward, Palm Beach,<br />
Martin, St. Lucie, Indian River, and<br />
Brevard counties). During the twentieth<br />
century, there are relatively<br />
complete records for this region<br />
(Landsea et al. 2004). Prior to<br />
Andrew’s reclassification, six category-<br />
4 and one category-5 hurricanes struck<br />
southeastern Florida: the 1919 Key<br />
West hurricane, the 1926 Great Miami<br />
hurricane, the 1928 Lake Okeechobee<br />
hurricane, the 1935 Labor Day<br />
(category 5) hurricane, the 1947<br />
Broward hurricane, 1960’s Hurricane<br />
Donna in the Florida Keys, and<br />
Hurricane Andrew (updated from<br />
Jarrell et al. 1992). This gave an average<br />
return period for “Andrew like”<br />
hurricanes (i.e., category 4 or 5) of<br />
about 15 yr for the south Florida<br />
region, though these occur rather<br />
unevenly in time during the twentieth<br />
century. However, with Andrew being<br />
reclassified as a category 5, it becomes<br />
one of two such tropical cyclones to<br />
strike the area in 100 yr. Thus, the<br />
return period is equal to or greater<br />
than 50 yr for a direct strike on the<br />
region by an Andrew-type hurricane<br />
(now upgraded to category 5).<br />
This conclusion may be somewhat<br />
counterintuitive at first, but is more<br />
understandable if one puts Andrew into<br />
context with the other catastrophic<br />
south Florida hurricanes of the<br />
twentieth century. Previously, with<br />
Andrew considered a category-5<br />
hurricane at landfall, it was considered<br />
as a strong as, and roughly as damaging<br />
as, the 1919, 1926, 1928, 1947, and<br />
1960 hurricanes. But elevating Hurricane<br />
Andrew to a category 5 means that<br />
it is unlikely that these other five<br />
category-4 hurricanes could cause the<br />
same type of extreme destruction that<br />
the 1992 hurricane caused, if these<br />
systems were to hit today’s southeast<br />
Florida. It is noted though that the<br />
1926, 1928, and 1947 hurricanes were<br />
substantially larger in size than 1992’s<br />
Andrew, so that they might cause more<br />
widespread, though locally less severe,<br />
damages if they were to hit today.<br />
[Moreover, it appears unlikely that any<br />
of these five remaining category-4<br />
hurricanes that struck south Florida<br />
will be reanalyzed at a higher category<br />
based upon Dunion et al. (2003) and<br />
other preliminary assessments.] Thus,<br />
the new classification alters the<br />
assessed odds of having an Andrew-like<br />
hurricane impact from being an<br />
uncommon occurrence to a rare event.<br />
This rough assessment agrees with<br />
specific calculations from the Hurricane<br />
Risk (HURISK) analysis program<br />
(Neumann 1987). This program<br />
synthesizes information from the entire<br />
HURDAT database to provide detailed<br />
statistics for more localized regions,<br />
including average return periods for<br />
various thresholds of wind speeds of<br />
interest. For the original and revised<br />
assessed intensities of Andrew at<br />
landfall, the return periods for various<br />
intensity hurricanes passing within<br />
50 n mi (93 km) are quite different:<br />
36 yr at ≥125 kt (original Andrew besttrack<br />
intensity) and 82 yr at ≥145 kt<br />
(revised Andrew best-track intensity).<br />
However, the return periods for<br />
various wind speed thresholds do not<br />
themselves change significantly near<br />
Miami–Dade County, with the alteration<br />
of one data point (i.e., Andrew’s<br />
estimated intensity), as one would<br />
expect from a large database of over<br />
100 yr of tropical storms and hurricanes<br />
to impact this region.<br />
For the public, government agencies,<br />
insurance companies, wind engineers,<br />
building code designers, and others<br />
interested in the return period of<br />
extremely devastating hurricanes, the<br />
category assigned is quite important.<br />
The implication of the above calculations<br />
is that originally an Andrew-like<br />
impact could be expected about every<br />
35 yr in Miami–Dade County (every<br />
15 yr for all of south Florida), while the<br />
reclassification means that an Andrewlike<br />
event is now expected to strike<br />
Miami–Dade County about once in<br />
80 yr (every 50 yr for all of south<br />
Florida). Such information should be of<br />
use for those involved with long-range<br />
planning for the region.<br />
• Continued research is needed to better understand<br />
the surface winds in strong hurricanes in a variety<br />
of differing environmental conditions and at the<br />
ocean–coast boundary, in particular.<br />
• Because of this reclassification, the return period of<br />
catastrophic hurricanes like Andrew increases from<br />
about 15 to at least 50 yr for south Florida. Thus,<br />
the risk from Andrew-like hurricanes at that<br />
location is significantly less than previously had been<br />
estimated.<br />
ACKNOWLEDGMENTS. The first author acknowledges<br />
the support of NOAA NASA Grant GC02-093—The Atlantic<br />
Hurricane Database (HURDAT) reanalysis project. The<br />
authors wish to thank Mike Black and Krystal Valde for their<br />
contributions toward better understanding of the hurricane’s<br />
violent inner-core wind structure. Additional thanks go to<br />
Pete Black and Mark Powell for their presentations of surface<br />
pressure gradients/surveys of wind-caused damage and<br />
surface wind estimation, respectively, for the NHC Best<br />
Track Change Committee’s deliberations. Lenworth<br />
Woolcock provided support for both figure preparation as<br />
well as Web site development and maintenance. Kind<br />
suggestions and recommendations for this reanalysis and<br />
paper were also provided by several additional people: William<br />
Bredemeyer, Steve Feuer, John Gamache, Paul Hebert, Jeff<br />
Kepert, Paul Leighton, Charlie Neumann, and Hugh<br />
Willoughby.<br />
1710 | NOVEMBER 2004
REFERENCES<br />
Chandler, M., and J. Charles, 2002: Hurricane insurance<br />
stirring a fight. The Miami Herald, 19 February, sec.<br />
A, morning edition.<br />
DeMaria, M., and J. Kaplan, 1999: An updated<br />
Statistical Hurricane Intensity Prediction Scheme<br />
(SHIPS) for the Atlantic and eastern North Pacific<br />
basins. Wea. Forecasting, 14, 326–337.<br />
Dunion, J. P., and M. D. Powell, 2002: Improvements<br />
to the NOAA Hurricane Research Division’s surface<br />
reduction algorithm for inner core aircraft flightlevel<br />
winds. Preprints, 25th Conf. on Hurricanes and<br />
Tropical Meteorology, San Diego, CA, Amer. Meteor.<br />
Soc., 581–582.<br />
——, C. W. Landsea, S. H. Houston, and M. D. Powell,<br />
2003: A reanalysis of the surface winds for<br />
Hurricane Donnna of 1960. Mon. Wea. Rev., 131,<br />
1992–2001.<br />
Fernández-Partagas, J., and H. F. Diaz, 1996: Atlantic<br />
hurricanes in the second half of the nineteenth<br />
century. Bull. Amer. Meteor. Soc., 77, 2899–2906.<br />
Franklin, J. L., L. A. Avila, J. L. Beven, M. B. Lawrence,<br />
R. J. Pasch, and S. R. Stewart, 2001: Atlantic<br />
hurricane season of 2000. Mon. Wea. Rev., 129,<br />
3037–3056.<br />
——, M. L. Black, and K. Valde, 2003: GPS<br />
dropwindsonde wind profiles in hurricanes and their<br />
operational implications. Wea. Forecasting, 18, 32–<br />
44.<br />
Hock, T. R., and J. L. Franklin, 1999: The NCAR GPS<br />
dropwindsonde. Bull. Amer. Meteor. Soc., 80, 407–420.<br />
Houston, S. H., P. P. Dodge, M. D. Powell, M. L. Black,<br />
G. M. Barnes, and P. S. Chu, 2000: Surface winds in<br />
hurricanes from GPS-sondes: Comparisons with<br />
observations. Preprints, 24th Conf. on Hurricanes<br />
and Tropical Meteorology, Ft. Lauderdale, FL, Amer.<br />
Meteor. Soc., 339.<br />
Jarrell, J. D., P. J. Hebert, and M. Mayfield, 1992:<br />
Hurricane experience levels of coastal county<br />
populations from Texas to Maine. NOAA Tech.<br />
Memo. NWS NHC 46, 152 pp.<br />
Jarvinen, B. R., C. J. Neumann, and M. A. S. Davis, 1984:<br />
A tropical cyclone data tape for the North Atlantic<br />
Basin, 1886-1983: Contents, limitations, and uses.<br />
NOAA Tech. Memo. NWS NHC 22, 21 pp.<br />
Jeslesnianski, C. P., 1993: The habitation layer. Global<br />
Guide to Tropical Cyclone Forecasting, World<br />
Meteorological Organization Tech. Doc. 560 4.1–<br />
4.29.<br />
Landsea, C. W., 1993: A climatology of intense (or<br />
major) Atlantic hurricanes. Mon. Wea. Rev., 121,<br />
1703–1713.<br />
——, and Coauthors, 2004: The Atlantic hurricane<br />
database re-analysis project: Documentation for<br />
the 1851-1910 alterations and additions to the<br />
HURDAT database. Hurricanes and Typhoons: Past,<br />
Present and Future, R. J. Murnane and K.-B. Liu,<br />
Eds., Columbia University Press, in press.<br />
Marks, F. D., R. A. Houze Jr., and J. F. Gamache, 1992:<br />
Dual-aircraft investigation of the inner core of<br />
Hurricane Norbert. Part I: Kinematic structure. J.<br />
Atmos. Sci., 49, 919–942.<br />
Mayfield, M., L. Avila, and E. N. Rappaport, 1994:<br />
Atlantic hurricane season of 1992. Mon. Wea. Rev.,<br />
122, 517–538.<br />
McAdie, C. J., and M. B. Lawrence, 2000: Improvements<br />
in tropical cyclone track forecasting in the Atlantic<br />
basin, 1970–98. Bull. Amer. Meteor. Soc., 81, 989–<br />
998.<br />
Neumann, C. J., 1987: The <strong>National</strong> Hurricane Center<br />
Risk Analysis Program (HURISK). NOAA Tech.<br />
Memo. NWS NHC 38, 56 pp.<br />
——, 1994: An update to the <strong>National</strong> Hurricane Center<br />
“Track Book.” Minutes of the 48th Interdepartmental<br />
Conf., Miami, FL, NOAA Office of Federal<br />
Coordinator for Meteorological Services and<br />
Supporting Research, A-47–A-53.<br />
Powell, M. D., 1980: Evaluations of diagnostic marine<br />
boundary layer models applied to hurricanes. Mon.<br />
Wea. Rev., 108, 757–766.<br />
——, and P. G. Black, 1990: The relationship of hurricane<br />
reconnaissance flight-level measurements to winds<br />
measured by NOAA’s oceanic platforms. J. Wind<br />
Eng. Ind. Aerodyn., 36, 381–392.<br />
——, and S. H. Houston, 1996: Hurricane Andrew’s<br />
landfall in South Florida. Part II: Surface wind fields<br />
and potential real-time applications. Wea.<br />
Forecasting, 11, 329–349.<br />
——, P. P. Dodge, and M. L. Black, 1991: The landfall of<br />
Hurricane Hugo in the Carolinas: Surface wind<br />
distribution. Wea. Forecasting, 6, 379–399.<br />
——, S. H. Houston, and T. A. Reinhold, 1996: Hurricane<br />
Andrew’s landfall in South Florida. Part I:<br />
Standardizing measurements for documentation of<br />
surface wind fields. Wea. Forecasting, 11, 304–328.<br />
——, ——, L. R. Amat, and N. Morisseau-Leroy, 1998:<br />
The HRD real-time surface wind analysis system. J.<br />
Wind Eng. Indust. Aerodyn., 77–78, 53–64.<br />
——, P. J. Vickery, and T. A. Reinhold, 2003: Reduced<br />
drag-coefficient for high wind speeds in tropical<br />
cyclones. Nature, 422, 279–283.<br />
Rappaport, E. N., 1994: Hurricane Andrew. Weather,<br />
49, 51–61.<br />
Saffir, H. S., 1973: Hurricane wind and storm surge. Mil.<br />
Eng., 423, 4–5.<br />
AMERICAN METEOROLOGICAL SOCIETY NOVEMBER 2004 | 1711
Simpson, R. H., 1974: The hurricane<br />
disaster potential scale.<br />
Weatherwise, 27, 169, 186.<br />
Tuttle, J., and R. Gall, 1999: A singleradar<br />
technique for estimating<br />
the winds in tropical cyclones.<br />
Bull. Amer. Meteor. Soc., 80, 653–<br />
668.<br />
Ulhorn, E. W., and P. G. Black, 2003:<br />
Verification of remotely sensed<br />
sea surface winds in hurricanes.<br />
J. Atmos. Oceanic Technol., 20,<br />
99–116.<br />
Walsh, E. J., and Coauthors, 2002:<br />
Hurricane directional wave<br />
spectrum spatial variation at<br />
landfall. J. Phys. Oceanogr., 32,<br />
1667–1684.<br />
1712 | NOVEMBER 2004