A REANALYSIS OF HURRICANE ANDREW'S INTENSITY - National ...
A REANALYSIS OF HURRICANE ANDREW'S INTENSITY - National ...
A REANALYSIS OF HURRICANE ANDREW'S INTENSITY - National ...

Create successful ePaper yourself
Turn your PDF publications into a flip-book with our unique Google optimized e-Paper software.
While the bathymetry of the waters offshore of south<br />
Florida where Andrew hit is somewhat different from<br />
North Carolina, if such decreased wave heights did<br />
occur, it is not clear what these would imply when combined<br />
with breaking waves for changes to the roughness<br />
length relative to the open ocean.<br />
J. Franklin presented the committee with an analysis<br />
of available GPS dropwindsondes near shore (within<br />
10 km) and offshore (10–60 km) in the right eyewall of<br />
hurricanes making landfall in the United States. This<br />
preliminary study suggested that there could be some<br />
reduction in surface winds along the immediate coastal<br />
waters. A very limited sample of 19 dropwinsondes in<br />
the eyewalls of weak to moderate hurricanes shows an<br />
apparent 5%–10% reduction of surface wind as the<br />
coastline is approached. Using this alteration to the<br />
Franklin et al. (2003) surface wind methodology gives<br />
maximum 1-min winds at the coast of roughly 130 to<br />
140 kt. However, given the extremely small sample of<br />
dropwindsondes (i.e., 10 near shore and 9 just offshore)<br />
and lack of any major hurricanes in this coastal analysis,<br />
such results were considered by the Best Track<br />
Change Committee to be too speculative to be applied<br />
at this time. 5 Clearly, more dropwindsonde data are<br />
needed both in the transition zone between land and<br />
water, as well as in the hurricane boundary layer over<br />
land, to properly assess the degree to which a hurricane’s<br />
surface winds over open water reach the coastline.<br />
from the WSR-57 radar in Tampa, satellite intensity<br />
estimates, storm-surge modeling runs, and surveys of<br />
wind-caused damage. These measures (discussion of<br />
these parameters can be found online at www.aoml.<br />
noaa.gov/hrd/hurdat/index.html) were mainly consistent<br />
with the revised surface wind estimates discussed<br />
in earlier sections, though they were of secondary importance<br />
to the final NHC Best Track Change Committee<br />
decision.<br />
BEST-TRACK CHANGES. After considering the<br />
presentations regarding various recommendations for<br />
the revisions of Andrew’s best-track intensities, the<br />
NHC Best Track Change Committee made alterations<br />
to the winds in HURDAT for Hurricane Andrew<br />
(Table 1 and Fig. 4) for 22–26 August. These changes<br />
were made to Hurricane Andrew’s intensity data for<br />
the time while the storm was over the Atlantic Ocean<br />
just east of the Bahamas, over the Bahamas and south<br />
Florida, over the Gulf of Mexico, and at landfall in<br />
Louisiana (Fig. 5). Neither the best-track positions nor<br />
the central pressure values of Andrew were adjusted.<br />
The alterations in wind intensity were based upon the<br />
Franklin et al. (2003) methodology, which is consistent<br />
with the work of Dunion et al. (2003) and Dunion and<br />
Powell (2002) as discussed earlier. The changes to<br />
HURDAT were applied for these dates as aircraft reconnaissance<br />
observations were available throughout<br />
Other evidence for Andrew’s intensity.<br />
While the primary pieces of evidence<br />
for altering Hurricane<br />
Andrew’s intensity came from revised<br />
extrapolations of flight-level<br />
winds and radar feature track data,<br />
other information on the intensity<br />
was also available and considered<br />
in the reanalysis. These were the<br />
continued central pressure drop<br />
after the measurement of the peak<br />
aircraft wind report, pressure–<br />
wind relationships, surface pressure<br />
gradients, high-altitude radar<br />
reflectivity eyewall core velocities<br />
5<br />
The <strong>National</strong> Hurricane Center’s operational<br />
estimates, as well as the<br />
poststorm best-track assessments, have<br />
historically made the assumption that<br />
an otherwise steady-state hurricane’s<br />
maximum winds over water do survive<br />
to the coastline.<br />
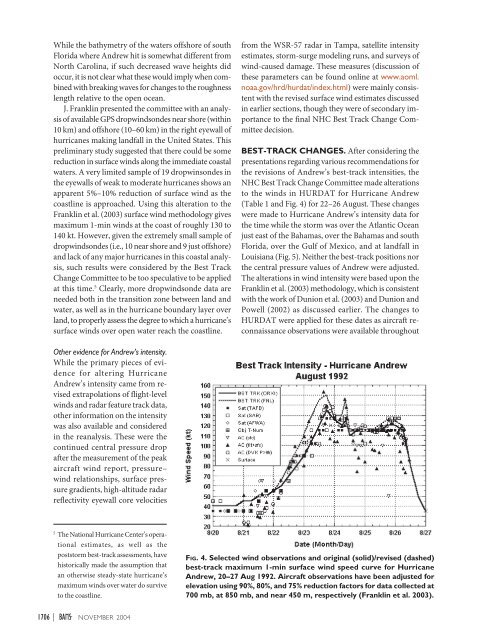
FIG. 4. Selected wind observations and original (solid)/revised (dashed)<br />
best-track maximum 1-min surface wind speed curve for Hurricane<br />
Andrew, 20–27 Aug 1992. Aircraft observations have been adjusted for<br />
elevation using 90%, 80%, and 75% reduction factors for data collected at<br />
700 mb, at 850 mb, and near 450 m, respectively (Franklin et al. 2003).<br />
1706 | NOVEMBER 2004