A REANALYSIS OF HURRICANE ANDREW'S INTENSITY - National ...
A REANALYSIS OF HURRICANE ANDREW'S INTENSITY - National ...
A REANALYSIS OF HURRICANE ANDREW'S INTENSITY - National ...

Create successful ePaper yourself
Turn your PDF publications into a flip-book with our unique Google optimized e-Paper software.
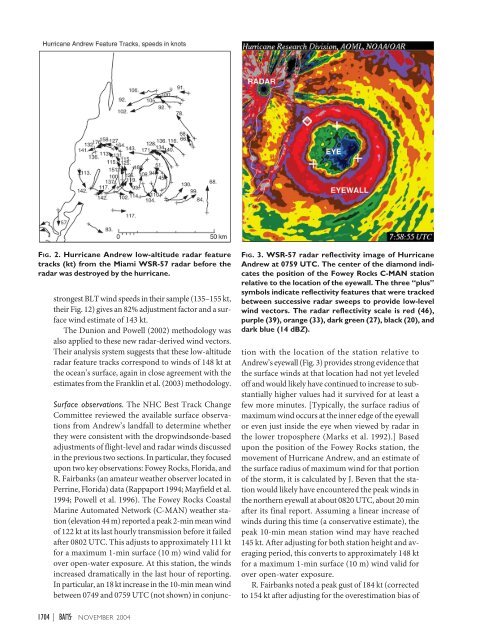
FIG. 2. Hurricane Andrew low-altitude radar feature<br />
tracks (kt) from the Miami WSR-57 radar before the<br />
radar was destroyed by the hurricane.<br />
strongest BLT wind speeds in their sample (135–155 kt,<br />
their Fig. 12) gives an 82% adjustment factor and a surface<br />
wind estimate of 143 kt.<br />
The Dunion and Powell (2002) methodology was<br />
also applied to these new radar-derived wind vectors.<br />
Their analysis system suggests that these low-altitude<br />
radar feature tracks correspond to winds of 148 kt at<br />
the ocean’s surface, again in close agreement with the<br />
estimates from the Franklin et al. (2003) methodology.<br />
FIG. 3. WSR-57 radar reflectivity image of Hurricane<br />
Andrew at 0759 UTC. The center of the diamond indicates<br />
the position of the Fowey Rocks C-MAN station<br />
relative to the location of the eyewall. The three “plus”<br />
symbols indicate reflectivity features that were tracked<br />
between successive radar sweeps to provide low-level<br />
wind vectors. The radar reflectivity scale is red (46),<br />
purple (39), orange (33), dark green (27), black (20), and<br />
dark blue (14 dBZ).<br />
Surface observations. The NHC Best Track Change<br />
Committee reviewed the available surface observations<br />
from Andrew’s landfall to determine whether<br />
they were consistent with the dropwindsonde-based<br />
adjustments of flight-level and radar winds discussed<br />
in the previous two sections. In particular, they focused<br />
upon two key observations: Fowey Rocks, Florida, and<br />
R. Fairbanks (an amateur weather observer located in<br />
Perrine, Florida) data (Rappaport 1994; Mayfield et al.<br />
1994; Powell et al. 1996). The Fowey Rocks Coastal<br />
Marine Automated Network (C-MAN) weather station<br />
(elevation 44 m) reported a peak 2-min mean wind<br />
of 122 kt at its last hourly transmission before it failed<br />
after 0802 UTC. This adjusts to approximately 111 kt<br />
for a maximum 1-min surface (10 m) wind valid for<br />
over open-water exposure. At this station, the winds<br />
increased dramatically in the last hour of reporting.<br />
In particular, an 18 kt increase in the 10-min mean wind<br />
between 0749 and 0759 UTC (not shown) in conjunction<br />
with the location of the station relative to<br />
Andrew’s eyewall (Fig. 3) provides strong evidence that<br />
the surface winds at that location had not yet leveled<br />
off and would likely have continued to increase to substantially<br />
higher values had it survived for at least a<br />
few more minutes. [Typically, the surface radius of<br />
maximum wind occurs at the inner edge of the eyewall<br />
or even just inside the eye when viewed by radar in<br />
the lower troposphere (Marks et al. 1992).] Based<br />
upon the position of the Fowey Rocks station, the<br />
movement of Hurricane Andrew, and an estimate of<br />
the surface radius of maximum wind for that portion<br />
of the storm, it is calculated by J. Beven that the station<br />
would likely have encountered the peak winds in<br />
the northern eyewall at about 0820 UTC, about 20 min<br />
after its final report. Assuming a linear increase of<br />
winds during this time (a conservative estimate), the<br />
peak 10-min mean station wind may have reached<br />
145 kt. After adjusting for both station height and averaging<br />
period, this converts to approximately 148 kt<br />
for a maximum 1-min surface (10 m) wind valid for<br />
over open-water exposure.<br />
R. Fairbanks noted a peak gust of 184 kt (corrected<br />
to 154 kt after adjusting for the overestimation bias of<br />
1704 | NOVEMBER 2004