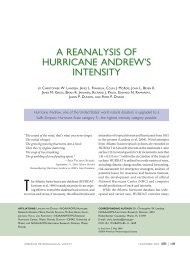
Along- and Cross-Track Errors - National Hurricane Center
Along- and Cross-Track Errors - National Hurricane Center
Along- and Cross-Track Errors - National Hurricane Center

You also want an ePaper? Increase the reach of your titles
YUMPU automatically turns print PDFs into web optimized ePapers that Google loves.
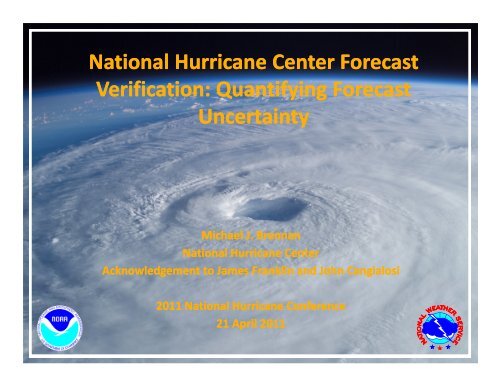
<strong>National</strong> <strong>Hurricane</strong> <strong>Center</strong> Forecast<br />
Verification: Quantifying Forecast<br />
Uncertainty<br />
Michael J. Brennan<br />
<strong>National</strong> <strong>Hurricane</strong> <strong>Center</strong><br />
Acknowledgement to James Franklin <strong>and</strong> John Cangialosi<br />
2011 <strong>National</strong> <strong>Hurricane</strong> Conference<br />
21 April 2011
NHC Forecast Verification<br />
• NHC verifies all official tropical cyclone track <strong>and</strong><br />
intensity forecasts each year<br />
• Why verify forecasts?<br />
1. We have to monitor performance <strong>and</strong> progress<br />
• Government Performance <strong>and</strong> Results Act (GPRA)<br />
2. Underst<strong>and</strong>ing forecast errors help forecasters <strong>and</strong><br />
modelers to reduce them<br />
3. Identify critical issues for the research community<br />
4. Basis for the development of certain products<br />
• Wind speed <strong>and</strong> storm surge probabilities<br />
5. Helps decision makers use NHC products more effectively<br />
2
NHC Forecast Verification<br />
• System must be a tropical or subtropical cyclone at<br />
both forecast initial time <strong>and</strong> verification time<br />
• Special advisories ignored (original advisory is<br />
verified instead)<br />
• Definitions:<br />
• <strong>Track</strong> error: great‐circle distance between the forecast<br />
location <strong>and</strong> the actual location of the storm center (n mi)<br />
• Intensity error: difference between the forecast <strong>and</strong> actual<br />
intensity (kt)<br />
• Forecast SKILL is computed by comparing forecast error to<br />
the error from a Climatology‐Persistence model (CLIPER,<br />
Decay‐SHIFOR)<br />
3
<strong>Track</strong> Error Definition<br />
120<br />
96<br />
72<br />
48<br />
36<br />
24<br />
12<br />
4
2010 Atlantic Verification<br />
VT NT TRACK INT<br />
(h) (n mi) (kt)<br />
============================<br />
000 404 11.2 2.4<br />
012 365 34.2 7.6<br />
024 327 54.2 12.0<br />
036 292 71.6 13.9<br />
048 259 89.1 15.5<br />
072 198 129.4 16.7<br />
096 149 166.0 18.4<br />
120 115 186.7 18.6<br />
Values in red exceed<br />
all-time records<br />
Only one record set for track, but 48-h track error below 90 n mi<br />
No change in intensity error, still grows quickly through 2-3 days <strong>and</strong> levels off<br />
Much larger sample than 2009, especially at days 4 <strong>and</strong> 5
Atlantic 5‐Year Mean <strong>Track</strong> <strong>Errors</strong><br />
<strong>Track</strong> errors increase about 40–50 n mi per day
Atlantic <strong>Track</strong> Error Trends (1990‐2010)<br />
<strong>Track</strong> errors have decreased by about 60% since 1990<br />
Current 5-day forecast is as accurate as the 3-day forecast was just 10 years ago<br />
Long-term trend distinctly downward through day 5
2010 Atlantic <strong>Track</strong> <strong>Errors</strong> by Storm<br />
Igor, Richard <strong>and</strong> Tomas were notable successes<br />
Danielle (sharper recurvature than forecast) <strong>and</strong><br />
Lisa (moved unexpectedly eastward for two days)<br />
presented challenges<br />
Forecasts for Earl were better than average<br />
through 72 h, but 96-h <strong>and</strong> 120-h errors were larger
Atlantic <strong>Track</strong> Error Distribution (48 h)<br />
Average error 90 n mi, but<br />
outliers still occur!
• Represents probable<br />
track of tropical cyclone<br />
center<br />
• Formed by connecting<br />
circles centered on each<br />
forecast point (at 12, 24,<br />
36 h, etc.)<br />
• Size of the circles<br />
determined so that, for<br />
example, the actual<br />
storm position at 48 h<br />
will be within the 48‐h<br />
circle 67% of the time<br />
NHC Forecast Cone
Forecast Error Distributions <strong>and</strong> Cone Radii<br />
2010<br />
36 0 0<br />
62 -3 -4.8%<br />
85 -6 -7.0%<br />
108 -10 -9.2%<br />
161 -17 -10.6%<br />
220 -20 -9.1%<br />
285 -46 -16.1%<br />
How often is the 120-h<br />
forecast error < 500 n mi?<br />
Substantial reduction in track cone size for 2011 due to 2005 season dropping out of the sample
<strong>Along</strong>‐ <strong>and</strong> <strong>Cross</strong>‐<strong>Track</strong> <strong>Errors</strong><br />
(Timing vs. Location)
<strong>Along</strong>‐ <strong>and</strong> <strong>Cross</strong>‐<strong>Track</strong> <strong>Errors</strong><br />
Forecast<br />
Actual <strong>Track</strong><br />
<strong>Cross</strong>‐<strong>Track</strong> Error<br />
(Forecast too far to the right)<br />
<strong>Along</strong>‐<strong>Track</strong> Error<br />
(Forecast too slow)
<strong>Along</strong>‐ <strong>and</strong> <strong>Cross</strong>‐<strong>Track</strong> <strong>Errors</strong><br />
Difference largely negligible through 36<br />
hours<br />
At longer ranges - more difficulty with<br />
timing than direction<br />
Wind speed <strong>and</strong> storm surge probability<br />
products use along- <strong>and</strong> cross-track errors
Atlantic 5‐Year Mean <strong>Errors</strong><br />
Intensity errors level off after 48 to 72 hours<br />
because intensity is much more bounded problem
Atlantic Intensity Error Trends (1990‐2010)<br />
No progress with intensity in<br />
last 15-20 years<br />
24-48 h intensity forecasts likely off by one SSHS category<br />
Off by two SSHS categories perhaps 5-10% of the time
Intensity Error Distribution (48 h)<br />
TOO LOW<br />
TOO HIGH<br />
If the errors are small,<br />
they are more likely to be<br />
overestimates<br />
On the other h<strong>and</strong>, really<br />
big errors are more likely<br />
to be underestimates!
Atlantic Genesis Forecasts<br />
Forecasts at the high end<br />
<strong>and</strong> low end were very<br />
well calibrated (reliable)<br />
with minimal bias<br />
However, this year’s<br />
forecasts could not<br />
distinguish gradations in<br />
likelihood between 30%<br />
<strong>and</strong> 70%
Atlantic Genesis Forecasts<br />
Results for the 2007-<br />
2010 sample show some<br />
ability in the mid-range,<br />
but it’s clearly an area<br />
that could be improved
Verification Web Page
Summary<br />
• Atlantic basin track errors increase by 40–50 n mi per<br />
day<br />
• Forecasts have been steadily getting better over the past two<br />
decades (<strong>and</strong> longer)<br />
• NHC uncertainty cone made up of circles that enclose<br />
actual storm position about two‐thirds of the time<br />
• Error cone will be substantially smaller in 2011, especially at<br />
days 4 <strong>and</strong> 5, due to 2005 season statistics dropping out of the<br />
sample<br />
• Actual track forecast errors aren’t quite circular about<br />
the forecast point<br />
• <strong>Along</strong>‐track (timing) errors tend to be larger than the cross‐track<br />
(directional) errors at 48 h <strong>and</strong> beyond
Summary<br />
• Intensity errors 24‐48 h in advance are regularly off by<br />
one Saffir‐Simpson category<br />
• Intensity errors begin to level off around 72 h<br />
• No appreciable change in intensity forecast error over<br />
the past two decades<br />
• 48‐h genesis forecasts show ability to distinguish<br />
between systems that clearly will or will not develop,<br />
but struggle with marginal systems in the 30‐70%<br />
probability ranges