High Wind Drag Coefficient and Sea Surface Roughness in Shallow ...
High Wind Drag Coefficient and Sea Surface Roughness in Shallow ...
High Wind Drag Coefficient and Sea Surface Roughness in Shallow ...

Create successful ePaper yourself
Turn your PDF publications into a flip-book with our unique Google optimized e-Paper software.
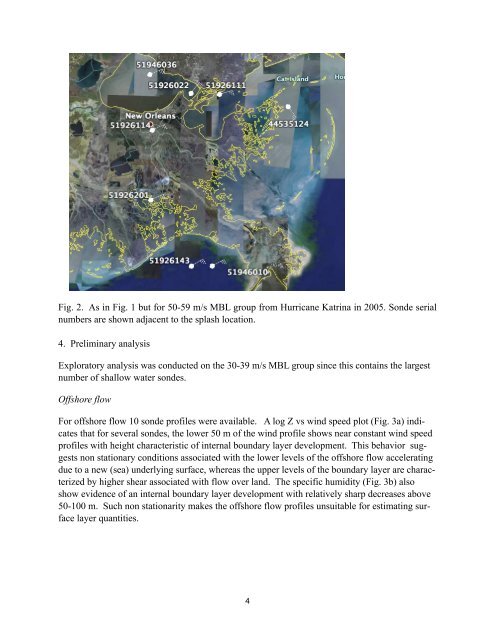
Fig. 2. As <strong>in</strong> Fig. 1 but for 50-59 m/s MBL group from Hurricane Katr<strong>in</strong>a <strong>in</strong> 2005. Sonde serial<br />
numbers are shown adjacent to the splash location.<br />
4. Prelim<strong>in</strong>ary analysis<br />
Exploratory analysis was conducted on the 30-39 m/s MBL group s<strong>in</strong>ce this conta<strong>in</strong>s the largest<br />
number of shallow water sondes.<br />
Offshore flow<br />
For offshore flow 10 sonde profiles were available. A log Z vs w<strong>in</strong>d speed plot (Fig. 3a) <strong>in</strong>dicates<br />
that for several sondes, the lower 50 m of the w<strong>in</strong>d profile shows near constant w<strong>in</strong>d speed<br />
profiles with height characteristic of <strong>in</strong>ternal boundary layer development. This behavior suggests<br />
non stationary conditions associated with the lower levels of the offshore flow accelerat<strong>in</strong>g<br />
due to a new (sea) underly<strong>in</strong>g surface, whereas the upper levels of the boundary layer are characterized<br />
by higher shear associated with flow over l<strong>and</strong>. The specific humidity (Fig. 3b) also<br />
show evidence of an <strong>in</strong>ternal boundary layer development with relatively sharp decreases above<br />
50-100 m. Such non stationarity makes the offshore flow profiles unsuitable for estimat<strong>in</strong>g surface<br />
layer quantities.<br />
4