Book 2 - Appraisal Institute of Canada
Book 2 - Appraisal Institute of Canada
Book 2 - Appraisal Institute of Canada

You also want an ePaper? Increase the reach of your titles
YUMPU automatically turns print PDFs into web optimized ePapers that Google loves.
constructing a new dwelling and reselling for<br />
pr<strong>of</strong>it, but for the purpose <strong>of</strong> constructing a new<br />
dwelling for their own use and occupation. Major<br />
housing builders tend to develop large tracts <strong>of</strong><br />
land for new communities or neighbourhoods<br />
and, thus, the tear-down issue is not a business<br />
plan consideration for these builders.<br />
The reason why this nuance <strong>of</strong> the residential<br />
construction and development business is important<br />
to appraisers and other marketplace observers<br />
is that an accurate picture <strong>of</strong> the single-family<br />
lots created vs. single-family building permits<br />
issued (‘lot absorption’) cannot be determined<br />
without specifically blending in or accounting for<br />
demolition permits issued, where the tear-down<br />
trend is common. Generally, local governments<br />
only report lots created and building permits<br />
issued without reporting the relationship <strong>of</strong><br />
demolition permits issued. If local governments<br />
do provide this information, it is generally not<br />
readily accessible.<br />
For example, let us assume that, within a<br />
particular local government, during a particular<br />
month <strong>of</strong> the year, this local government<br />
reported that there were 177 single-family building<br />
lots created by way <strong>of</strong> final approval being<br />
granted via subdivision registration, and, during<br />
this same monthly time period, this local government<br />
reported 138 building permits issued for<br />
single-family dwelling construction. On this<br />
basis, these published statistics would lead an<br />
observer to conclude that the lot absorption ratio<br />
for this particular month is at 77.97% (138/177).<br />
For the purpose <strong>of</strong> this example, let us also<br />
assume that 29 <strong>of</strong> the 58 demolition permits<br />
issued during this same month for single-family<br />
dwelling demolition specifically applied to<br />
tear-downs for the purpose <strong>of</strong> constructing new<br />
single-family dwellings on the existing lots, and<br />
that the remaining 29 demolition permits applied<br />
to demolitions occurring for highest and best use<br />
changes due to land-use or zoning changes, or<br />
they are dwellings being demolished on acreages<br />
as part <strong>of</strong> larger subdivision projects. Because no<br />
new lot is created on an existing lot that under-<br />
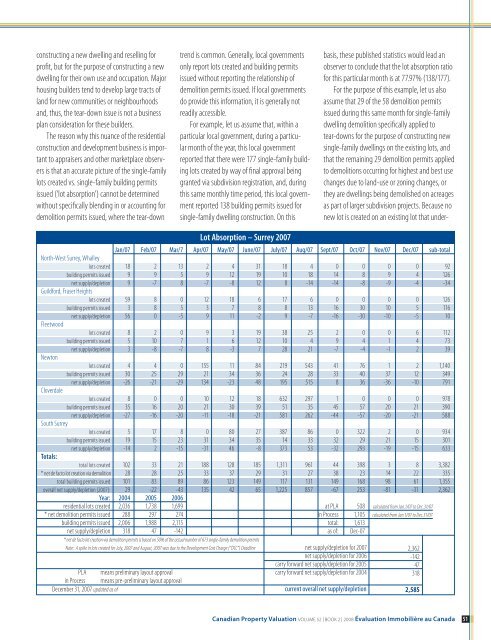
Lot Absorption – Surrey 2007<br />
Jan/07 Feb/07 Mar/7 Apr/07 May/07 June/07 July/07 Aug/07 Sept/07 Oct/07 Nov/07 Dec/07 sub-total<br />
North-West Surrey, Whalley<br />
lots created 18 2 13 2 4 31 18 4 0 0 0 0 92<br />
building permits issued 9 9 5 9 12 19 10 18 14 8 9 4 126<br />
net supply/depletion 9 -7 8 -7 -8 12 8 -14 -14 -8 -9 -4 -34<br />
Guildford, Fraser Heights<br />
lots created 59 8 0 12 18 6 17 6 0 0 0 0 126<br />
building permits issued 3 8 5 3 7 8 8 13 16 30 10 5 116<br />
net supply/depletion 56 0 -5 9 11 -2 9 -7 -16 -30 -10 -5 10<br />
Fleetwood<br />
lots created 8 2 0 9 3 19 38 25 2 0 0 6 112<br />
building permits issued 5 10 7 1 6 12 10 4 9 4 1 4 73<br />
net supply/depletion 3 -8 -7 8 -3 7 28 21 -7 -4 -1 2 39<br />
Newton<br />
lots created 4 4 0 155 11 84 219 543 41 76 1 2 1,140<br />
building permits issued 30 25 29 21 34 36 24 28 33 40 37 12 349<br />
net supply/depletion -26 -21 -29 134 -23 48 195 515 8 36 -36 -10 791<br />
Cloverdale<br />
lots created 8 0 0 10 12 18 632 297 1 0 0 0 978<br />
building permits issued 35 16 20 21 30 39 51 35 45 57 20 21 390<br />
net supply/depletion -27 -16 -20 -11 -18 -21 581 262 -44 -57 -20 -21 588<br />
South Surrey<br />
lots created 5 17 8 0 80 27 387 86 0 322 2 0 934<br />
building permits issued 19 15 23 31 34 35 14 33 32 29 21 15 301<br />
net supply/depletion -14 2 -15 -31 46 -8 373 53 -32 293 -19 -15 633<br />
Totals:<br />
total lots created 102 33 21 188 128 185 1,311 961 44 398 3 8 3,382<br />
* net de facto lot creation via demolition 28 28 25 33 37 29 31 27 38 23 14 22 335<br />
total building permits issued 101 83 89 86 123 149 117 131 149 168 98 61 1,355<br />
overall net supply/depletion (2007): 29 -22 -43 135 42 65 1,225 857 -67 253 -81 -31 2,362<br />
Year: 2004 2005 2006<br />
residential lots created 2,036 1,738 1,699 at PLA 508 calculated from Jan.1/07 to Dec.31/07<br />
* net demolition permits issued 288 297 274 in Process 1,105 calculated from Jan.1/07 to Dec.31/07<br />
building permits issued 2,006 1,988 2,115 total: 1,613<br />
net supply/depletion 318 47 -142 as <strong>of</strong>: Dec-07<br />
* net de facto lot creation via demolition permits is based on 50% <strong>of</strong> the actual number <strong>of</strong> 673 single-family demolition permits<br />
Note: A spike in lots created for July, 2007 and August, 2007 was due to the Development Cost Charge (“DCC”) Deadline net supply/depletion for 2007<br />
net supply/depletion for 2006<br />
carry forward net supply/depletion for 2005<br />
PLA means preliminary layout approval carry forward net supply/depletion for 2004<br />
in Process means pre-preliminary layout approval<br />
December 31, 2007 updated as <strong>of</strong><br />
current overall net supply/depletion<br />
2,362<br />
-142<br />
47<br />
318<br />
2,585<br />
Canadian Property Valuation Volume 52 | book 2 | 2008 Évaluation Immobilière au <strong>Canada</strong> 51