Presentation - Severstal
Presentation - Severstal
Presentation - Severstal

You also want an ePaper? Increase the reach of your titles
YUMPU automatically turns print PDFs into web optimized ePapers that Google loves.
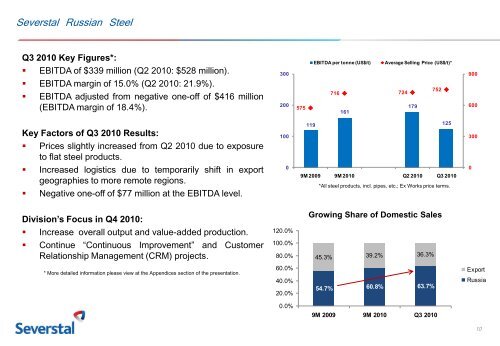
<strong>Severstal</strong> Russian Steel<br />
Q3 2010 Key Figures*:<br />
• EBITDA of $339 million (Q2 2010: $528 million).<br />
• EBITDA margin of 15.0% (Q2 2010: 21.9%).<br />
• EBITDA adjusted from negative one-off of $416 million<br />
(EBITDA margin of 18.4%).<br />
300<br />
200<br />
575<br />
EBITDA per tonne (US$/t) Average Selling Price (US$/t)*<br />
752<br />
716 724<br />
179<br />
161<br />
900<br />
600<br />
Key Factors of Q3 2010 Results:<br />
• Prices slightly increased from Q2 2010 due to exposure<br />
to flat steel products.<br />
100<br />
119<br />
125<br />
300<br />
• Increased logistics due to temporarily shift in export<br />
geographies to more remote regions.<br />
• Negative one-off of $77 million at the EBITDA level.<br />
0<br />
9M 2009 9M 2010 Q2 2010 Q3 2010<br />
*All steel products, incl. pipes, etc.; Ex Works price terms.<br />
0<br />
Division’s Focus in Q4 2010:<br />
Growing Share of Domestic Sales<br />
• Increase overall output and value-added production.<br />
120.0%<br />
• Continue “Continuous Improvement” and Customer<br />
Relationship Management (CRM) projects.<br />
100.0%<br />
80.0%<br />
45.3% 39.2% 36.3%<br />
* More detailed information please view at the Appendices section of the presentation.<br />
60.0%<br />
40.0%<br />
20.0%<br />
54.7% 60.8% 63.7%<br />
Export<br />
Russia<br />
0.0%<br />
9M 2009 9M 2010 Q3 2010<br />
10