Presentation - Severstal
Presentation - Severstal
Presentation - Severstal

You also want an ePaper? Increase the reach of your titles
YUMPU automatically turns print PDFs into web optimized ePapers that Google loves.
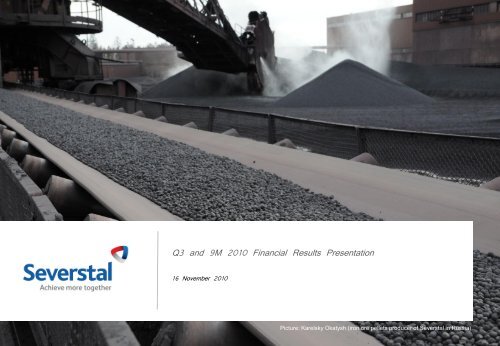
Q3 and 9M 2010 Financial Results <strong>Presentation</strong><br />
16 November 2010<br />
Picture: Karelsky Okatysh (iron ore pellets producer of <strong>Severstal</strong> in Russia).<br />
1
Table of Contents<br />
Q3 and 9M 2010 Company Overview ………….......... 5<br />
Divisional Performance and Market Outlook ………….......... 10<br />
Financial Position ………............. 15<br />
Company 9M 2010 Asset Expansion ………….......... 19<br />
Appendices ………….......... 26<br />
2
Disclaimer<br />
These materials are confidential and have been prepared by OAO <strong>Severstal</strong><br />
(<strong>Severstal</strong>) solely for your information and may not be reproduced, retransmitted or<br />
further distributed to any other person or published, in whole or in part, for any other<br />
purpose.<br />
These materials may contain projections and other forward-looking statements<br />
regarding future events or the future financial performance of <strong>Severstal</strong>. You can<br />
identify forward-looking statements by terms such as “expect,” “believe,” “estimate,”<br />
“intend,” “will,” “could,” “may” or “might”, or other similar expressions. <strong>Severstal</strong><br />
cautions you that these statements are only predictions and that actual events or<br />
results may differ materially. <strong>Severstal</strong> will not update these statements to reflect<br />
events and circumstances occurring after the date hereof. Factors that could cause<br />
the actual results to differ materially from those contained in projections or forwardlooking<br />
statements of <strong>Severstal</strong> may include, among others, general economic and<br />
competitive environment conditions in the markets in which <strong>Severstal</strong> operates,<br />
market change in the steel and mining industries, as well as many other risks<br />
affecting <strong>Severstal</strong> and its operations.<br />
These materials do not constitute or form part of any advertisement of securities, any<br />
offer or invitation to sell or issue or any solicitation of any offer to purchase or<br />
subscribe for, any securities of <strong>Severstal</strong> in any jurisdiction, nor shall they or any part<br />
of them nor the fact of their presentation, communication or distribution form the basis<br />
of, or be relied on in connection with, any contract or investment decision.<br />
No representation or warranty, express or implied, is given by <strong>Severstal</strong>, its affiliates<br />
or any of their respective advisers, officers, employees or agents, as to the accuracy<br />
of the information or opinions or for any loss howsoever arising, directly or indirectly,<br />
from any use of these materials or their contents.<br />
3
Q3 and 9M 2010 Company Overview<br />
4
Q3 2010 Summary<br />
Q3 2010 Highlights:<br />
EBITDA** (US$m) EBITDA Margin, %<br />
• Dividend payment restored.<br />
1,500<br />
30%<br />
• Profitable quarter: net profit* of $368 million.<br />
1,250<br />
22.5%<br />
1,000<br />
955<br />
19.1%<br />
20%<br />
• Benefits of integration strategy.<br />
750<br />
15.7%<br />
751<br />
• Further expansion of gold business.<br />
500<br />
492<br />
10%<br />
• Solid foundation laid for future growth in mining.<br />
250<br />
Market Outlook:<br />
• Steel and raw materials prices are expected to slightly weaken<br />
or remain stable for the balance of FY2010 and strengthening<br />
into 2011.<br />
0<br />
Q1 2010 Q2 2010 Q3 2010<br />
0%<br />
* Attributable to shareholders of OAO <strong>Severstal</strong>; ** EBITDA represents profit /(loss) from operations plus depreciation and amortization of productive assets<br />
adjusted for gain/(loss) on disposals of property, plant, equipment and intangible assets.<br />
5
REVENUE Dynamics and Breakdown<br />
Q3 2010 Revenue $3,935m (Q2 2009: $4,245m; -7.3%)<br />
Resources growth against steel seasonal sales decline<br />
9M 2010 Revenue $11,322m (9M 2009: $7,915m; +43.0%)<br />
Strong growth across all segments to last year<br />
Q2 2010 Q3 2010<br />
9M 2009 9M 2010<br />
(487)<br />
Intersegment, etc.<br />
(404)<br />
Intersegment, etc.<br />
(1,175)<br />
(525)<br />
<strong>Severstal</strong> Resources<br />
870<br />
914<br />
<strong>Severstal</strong> Resources<br />
1,250<br />
2,378<br />
<strong>Severstal</strong> North America<br />
1,447<br />
1,161<br />
<strong>Severstal</strong> North America<br />
2,965<br />
3,777<br />
<strong>Severstal</strong> Russian Steel<br />
2,415<br />
2,264<br />
<strong>Severstal</strong> Russian Steel<br />
4,225<br />
6,342<br />
-1,500 -500 500 1,500 2,500 3,500 4,500 5,500 6,500<br />
-1,500 -500 500 1,500 2,500 3,500 4,500 5,500 6,500<br />
6
EBITDA Dynamics and Breakdown<br />
Q3 2010 EBITDA $751m (Q2 2009: $955m; -21.4%)<br />
Seasonal weakness in Russian Steel,<br />
Continued momentum in <strong>Severstal</strong> Resources<br />
9M 2010 EBITDA $2,198m (9M 2009: $426m)<br />
Strong growth in steel and mining,<br />
Reduced loss at <strong>Severstal</strong> North America<br />
Q2 2010 Q3 2010<br />
9M 2009 9M 2010<br />
Intersegment, etc.<br />
(52)<br />
29<br />
Intersegment, etc.<br />
(4)<br />
(31)<br />
<strong>Severstal</strong> Resources<br />
420<br />
442<br />
<strong>Severstal</strong> Resources<br />
222<br />
1,041<br />
<strong>Severstal</strong> International (USA)<br />
(59)<br />
59<br />
(557)<br />
<strong>Severstal</strong> International (USA)<br />
(83)<br />
<strong>Severstal</strong> Russian Steel<br />
339<br />
528<br />
<strong>Severstal</strong> Russian Steel<br />
765<br />
1,271<br />
(1,000) (500) - 500 1,000<br />
(1,400) (900) (400) 100 600 1,100 1,600<br />
7
Benefits from Vertical Integration<br />
<strong>Severstal</strong> captures margin in its integrated operations even when raw materials prices are surging<br />
USD/t<br />
$350<br />
Steel Prices vs. Raw Materials, $<br />
USD/t<br />
$700<br />
$300<br />
$600<br />
$250<br />
$500<br />
$200<br />
$400<br />
$150<br />
$300<br />
$100<br />
$200<br />
$50<br />
$100<br />
$0<br />
Q1 2010 Q2 2010 Q3 2010<br />
$0<br />
HRC, USD/t, FOB Baltic Sea, rhs<br />
Iron ore concentrate, CPT, CherMK<br />
Scrap, CPT, CherMK<br />
Coking coal, CPT, CherMK<br />
Iron ore pellets, CPT, CherMK<br />
Source: SBB HRC (FOB Black Sea terms), company data (Raw (CPT terms).<br />
8
Divisional Performance and Market Outlook<br />
9
<strong>Severstal</strong> Russian Steel<br />
Q3 2010 Key Figures*:<br />
• EBITDA of $339 million (Q2 2010: $528 million).<br />
• EBITDA margin of 15.0% (Q2 2010: 21.9%).<br />
• EBITDA adjusted from negative one-off of $416 million<br />
(EBITDA margin of 18.4%).<br />
300<br />
200<br />
575<br />
EBITDA per tonne (US$/t) Average Selling Price (US$/t)*<br />
752<br />
716 724<br />
179<br />
161<br />
900<br />
600<br />
Key Factors of Q3 2010 Results:<br />
• Prices slightly increased from Q2 2010 due to exposure<br />
to flat steel products.<br />
100<br />
119<br />
125<br />
300<br />
• Increased logistics due to temporarily shift in export<br />
geographies to more remote regions.<br />
• Negative one-off of $77 million at the EBITDA level.<br />
0<br />
9M 2009 9M 2010 Q2 2010 Q3 2010<br />
*All steel products, incl. pipes, etc.; Ex Works price terms.<br />
0<br />
Division’s Focus in Q4 2010:<br />
Growing Share of Domestic Sales<br />
• Increase overall output and value-added production.<br />
120.0%<br />
• Continue “Continuous Improvement” and Customer<br />
Relationship Management (CRM) projects.<br />
100.0%<br />
80.0%<br />
45.3% 39.2% 36.3%<br />
* More detailed information please view at the Appendices section of the presentation.<br />
60.0%<br />
40.0%<br />
20.0%<br />
54.7% 60.8% 63.7%<br />
Export<br />
Russia<br />
0.0%<br />
9M 2009 9M 2010 Q3 2010<br />
10
<strong>Severstal</strong> International (North America)<br />
Q3 2010 Key Figures*:<br />
• EBITDA negative of $59 million (Q2 2010: EBITDA positive at $59 million).<br />
• EBITDA margin of negative 5.1% (Q2 2010: EBITDA margin positive at 4.1%).<br />
Key Factors of Q3 2010 Results:<br />
• Pricing well below peak levels of Q2 2010.<br />
• Low demand environment driven by construction segment.<br />
• Full capacity utilization at Columbus, Dearborn and Warren.<br />
• Impact of blast furnace idling at Sparrows Point.<br />
• Sparrows and Wheeling operate finishing facilities only.<br />
Division’s Focus in Q4 2010:<br />
• Continue to work on asset portfolio optimization.<br />
• Further cost-cutting efforts.<br />
* More detailed information please view at the Appendices section of the presentation.<br />
200<br />
100<br />
EBITDA per tonne (US$/t)<br />
798<br />
715<br />
Average Selling Price (US$/t)*<br />
826 802<br />
34<br />
1,000<br />
-<br />
(100)<br />
9M 2009 9M 2010 Q2 2010 Q3 2010<br />
(18)<br />
(41)<br />
500<br />
(200)<br />
(140)<br />
0<br />
*All steel products; mixed price terms, mostly Ex Works.<br />
11
Vorkutaugol (RU)<br />
Karelsky Okatysh (RU)<br />
PBS Coals (USA)<br />
<strong>Severstal</strong> Resources<br />
Q3 2010 Key Figures*:<br />
• EBITDA of $442 million (Q2 2010: $420 million).<br />
• EBITDA margin of 48.4% (Q2 2010: 48.3%).<br />
Key Factors of Q3 2010 Results:<br />
• Further development of the gold business:<br />
• In September 2010, the Group acquired an additional<br />
43.2% stake in Crew Gold Corporation increasing its<br />
ownership interest up to 93.4%.<br />
• Production growth and a positive one-off of $42 million<br />
minimized the impact of costs increase.<br />
• Better margins vs. almost flat prices due to volume**<br />
increase in Q3 2010 vs. Q2 2010:<br />
• Iron ore sales (in tonnes) +7%.<br />
• Gold sales (in oz tr.) +8%.<br />
• Coking coal concentrate (in tonnes) +1%.<br />
150<br />
125<br />
100<br />
75<br />
50<br />
25<br />
0<br />
(25)<br />
150<br />
125<br />
100<br />
75<br />
50<br />
25<br />
0<br />
EBITDA per tonne (US$/t) Average Selling Price (US$/t)*<br />
139<br />
154 148<br />
160<br />
78<br />
72<br />
89<br />
73<br />
110<br />
60<br />
10<br />
(1 )<br />
9M 2009 9M 2010 Q2 2010 Q3 2010 (40 )<br />
*Coking coal concentrate; Free Carrier price terms.<br />
EBITDA per tonne (US$/t) Average Selling Price (US$/t)*<br />
150<br />
111 105<br />
94<br />
100<br />
63 57<br />
47<br />
44<br />
50<br />
8<br />
0<br />
9M 2009 9M 2010 Q2 2010 Q3 2010<br />
*Iron ore pellets; Free Carrier price terms.<br />
EBITDA per tonne (US$/t) Average Selling Price (US$/t)*<br />
120<br />
200<br />
Division’s Focus in Q4 2010:<br />
• Production and sales volumes increase.<br />
• Further diversification into new materials/minerals.<br />
95<br />
70<br />
45<br />
20<br />
(5)<br />
155<br />
138 137 59<br />
52 52<br />
103<br />
34<br />
9M 2009 9M 2010 Q2 2010 Q3 2010<br />
150<br />
100<br />
50<br />
0<br />
* More detailed information please view at the Appendices section of the presentation.<br />
** Figures from the Company operational results reports for the nine months and 3 rd quarter of<br />
2010 released on October 28, 2010 and available at the Company website and RNS.<br />
*Coking coal; Free Carrier price terms.<br />
12
Gold Business of <strong>Severstal</strong> Resources<br />
Q3 2010 Key Figures*:<br />
• EBITDA of $95 million (Q2 2010: $89 million).<br />
• EBITDA margin of 51.6% (Q2 2010: 53.6%).<br />
Key Factors of Q3 2010 Results:<br />
• Gold sales prices improvement.<br />
• In September 2010, the Group acquired an additional 43.2% stake in<br />
Crew Gold Corporation increasing its ownership interest up to 93.4%.<br />
Division’s Focus in Q4 2010:<br />
• Production and sales volumes increase.<br />
• Further de-bottlenecking initiatives at the assets to increase productivity.<br />
• Updated production forecast for FY 2010 is around 600k oz.<br />
• We are still considering IPO as one of the options.<br />
EBITDA per oz (US$/oz)<br />
Average Selling Price (US$/t)*<br />
1,500<br />
1,000<br />
500<br />
0<br />
1,500<br />
1,188 1,209<br />
1,240<br />
1,200<br />
953<br />
615 648 640 900<br />
424<br />
600<br />
300<br />
0<br />
9M 2009 9M 2010 Q2 2010 Q3 2010<br />
Reserves and Resources:<br />
• 22.1 million oz (JORC) , out of which<br />
proven and probable 9 million oz.<br />
* More detailed information please view at the Appendices section of the presentation.<br />
13
Financial Position<br />
14
Good Cash Position and Financing Structure in Place<br />
6,061<br />
Debt and Liquidity Position, $ mln*<br />
566<br />
6,458<br />
394<br />
• Solid liquidity at hand lowering refinancing<br />
risks in medium term:<br />
• Cash and short-term deposits of $2,127<br />
million;<br />
• Borrowing availability of $394 million of<br />
committed unused credit lines.<br />
2,475 2,127<br />
End 2009 As of 30 Sep 2010<br />
Gross debt Cash&deposits Borrowing availability<br />
*Data excluding Lucchini.<br />
Debt Maturity Schedule, $ mln*<br />
706<br />
• Long-term repayment profile reinforced by the<br />
recent liability management transaction (pls see<br />
next page).<br />
• Resumption of dividend.<br />
Rapid Improvement of Leverage Metrics<br />
Net Debt* to 12-month EBITDA down to 1.5x.<br />
110<br />
1 000<br />
1,878<br />
1,257<br />
38<br />
842<br />
668 702<br />
277<br />
2010 2011 2012 2013 2014 Beyond<br />
Maturity Bonds placed on 25.10.10 Repaid after reporting date<br />
4.0X<br />
3.5X<br />
3.0X<br />
2.5X<br />
2.0X<br />
1.5X<br />
1.0X<br />
0.5X<br />
0.0X<br />
3.4X<br />
1.5X<br />
Target level<br />
12 months 2009 9 months 2010<br />
*Data excluding Lucchini.<br />
* Excluding accrued interest and unamortised balance of transactional costs.<br />
15
Successful Liability Management and New Issue Placement<br />
Proven Access to Debt Capital Markets:<br />
• On October 25, 2010, <strong>Severstal</strong> issued $1 billion<br />
Eurobonds due in October 2017, achieving historically<br />
low coupon of 6.7%.<br />
• The transaction was priced below the initial price<br />
guidance of 6.75 – 7.00%.<br />
• The amount of new issue was increased to $1 billion<br />
due to significant market demand. The order book was<br />
5.4x oversubscribed.<br />
S&P<br />
<strong>Severstal</strong> BB- (Stab) 13.10.2010<br />
Russian Federation BBB (Stab)<br />
Proactive Liability Management:<br />
• Large share of the proceeds from the new issue were used for a partial buyback of the $1.25 billion 9.75% notes due<br />
in 2013.<br />
• The tender was increased from originally contemplated $450 million to $706 million effectively reducing the total 2013<br />
maturities from $2.6 billion to $1.9 billion.<br />
• <strong>Severstal</strong> has also prepaid a number of existing credit lines in the amount of $38 million and $110 million maturing in<br />
2010 and 2011, correspondingly, using the proceeds from the Eurobonds placement.<br />
• The combination of the above transactions allowed the Company to extend its maturity profile, while saving<br />
approximately $20 million in interest expense annually.<br />
16
Cash Flow and Net Working Capital<br />
Cash Flow for 9M 2010, $ mln<br />
Highlights:<br />
5000<br />
4000<br />
2,949<br />
827 (1,182)<br />
• Strong cash position of $2,127 million in<br />
cash and short-term deposits.<br />
3000<br />
( 210) (257) 2,127<br />
2000<br />
1000<br />
0<br />
December<br />
2009 Cash<br />
& ST<br />
Deposits<br />
Operating<br />
CF<br />
Investing CF<br />
Financing<br />
CF<br />
Cash of<br />
discontinued<br />
operation<br />
September<br />
2010 Cash<br />
& ST<br />
Deposits<br />
* Net cash from operating, investing and financing activities includes negative $191 million of net cash-flow from<br />
discontinued operations due to Lucchini reclass; December 2009 cash includes $96 million of short-term deposits;<br />
September 2010 cash includes $72 million of short-term deposits; December 2009 cash includes Lucchini<br />
Net Working Capital for 9M 2010, $ mln<br />
Net working capital, $ mln<br />
Dec 31, 2009* Sep 30, 2010 Change, %<br />
2,329 2,757 18,4%<br />
• Strong operating cash flow: Q3 2010<br />
accounted for $695 million of the $827<br />
million operating cash flow for 9M 2010.<br />
• Investing cash flow increase is attributed<br />
mostly to the gold business consolidation:<br />
In September 2010, the Group acquired<br />
an additional 43.2% stake in Crew Gold<br />
Corporation increasing its ownership<br />
interest up to 93.4%.<br />
• Net working capital increased by 18.4%<br />
to the end of 2009.<br />
Net working capital as % of sales<br />
Dec 31, 2009* Sep 30, 2010<br />
20.6% 18.7%<br />
* Figures exclude Lucchini.<br />
17
Company 9M 2010 Asset Expansion<br />
18
9M 2010 Asset Expansion: Strong Mining Platform for Future Growth<br />
Segment Asset* Description Region Involvement Invested** Rationale<br />
Steel<br />
Gestamp-Kaluga<br />
TPZ Sheksna<br />
HVA steel<br />
production<br />
Value-added<br />
diversification<br />
Russia<br />
Joint-venture<br />
Subsidiary<br />
€89 million ***<br />
$14.0 million (follow<br />
up expenditures<br />
after launch)<br />
Value-added steel<br />
Mining<br />
Tyva coal deposit Coking coal mining Russia License $19.5 million<br />
Putu Range iron ore<br />
deposit<br />
Iron ore mining Africa License<br />
$15.0 million (follow<br />
up expenditures on<br />
exploration)<br />
Core Mining Iron ore mining Africa Equity investments $15.0 million<br />
Mining expansion<br />
Gold<br />
Iron Mineral<br />
Benefication<br />
Services<br />
High River Gold<br />
consolidation<br />
Crew Gold<br />
consolidation<br />
Sacre-Coeur<br />
Minerals<br />
Owner of the<br />
Finesmelt iron ore<br />
processing<br />
technology<br />
Gold mining<br />
Africa Associate $7.5 million<br />
Africa, Russia,<br />
Kazakhstan<br />
Subsidiary<br />
$132.4 million<br />
Gold mining Africa Subsidiary $460.5 million<br />
Gold mining Latin America Equity investments $6.2 million<br />
New Products Intex Resources Nickel Philippines Associate $13.0 million<br />
Reaching new<br />
markets<br />
Segment expansion<br />
Mining<br />
diversification<br />
* Only completed (launched into operation) or new acquired assets within 9M 2010.<br />
Other on-going development CAPEX projects are not mentioned.<br />
** Only investments in the recent nine months of 2010.<br />
*** Management assessment of initial investments.<br />
19
Strong Mining Platform for Future Growth: Tyva Coal Project<br />
Project highlights:<br />
License:<br />
90km 2 , metallurgical coal deposit.<br />
Resource:<br />
Location:<br />
A+B+C 1 reserve estimate of 639 million<br />
tonnes of high quality grade “Zh” coking<br />
coal.<br />
The Republic of Tyva (Russia) on the<br />
border with Mongolia.<br />
Elegestskoe<br />
deposit<br />
Total CAPEX:<br />
Preliminary estimate $1.6-1.8 billion,<br />
plus railroad CAPEX up to ~ $1 billion.<br />
Centralniy deposit<br />
Potential production:<br />
Start of production: 2017 – 2018.<br />
Up to 10 million tonnes of coal concentrate<br />
per annum.<br />
Mezhegeyskoe<br />
deposit<br />
Current status and next steps:<br />
• Obtained exploration and mining license at the tender for $19.5 million.<br />
• Signed MoU to set up a consortium of OPK, Evraz and <strong>Severstal</strong> to develop the<br />
railroad infrastructure by 2014.<br />
• Drilling and feasibility study to be completed by approximately the end of 2013.<br />
20
Strong Mining Platform for Future Growth: Putu Range Project<br />
Project highlights:<br />
Joint-venture with an<br />
experienced Liberian<br />
explorer: <strong>Severstal</strong> (61.5%), African Aura (38.5%).<br />
Resource:<br />
Location:<br />
Total CAPEX:<br />
Potential production:<br />
NI 43-101 inferred resource 1.07 billion tonnes of<br />
iron mineralization at an average grade of 37.6%<br />
Fe. Resource target is >2 billion tonnes.<br />
Liberia (West Africa); 13 km long ridge, located<br />
only 130 km inland from the deepwater shoreline.<br />
Preliminary estimate ~$2.5 billion.<br />
More than 20 million tonnes / year of magnetite<br />
concentrate.<br />
Liberia<br />
Putu Range<br />
Start of production: End of 2017.<br />
Current status and next steps:<br />
• Long-term concession agreement (MDA) signed, approved by the President of Liberia and ratified by<br />
the Liberian Legislature.<br />
• Resource delineation drilling commenced May 2010 – excellent progress thus far.<br />
• Pre-Feasibility Study of the project to be completed by approximately the end of September 2012.<br />
• Feasibility Study to be completed by approximately the end of March 2014.<br />
21
Market Outlook<br />
Market outlook:<br />
• In Q4 2010, steel prices are likely to slightly weaken or remain stable and then increasing from Q1 2011.<br />
• Potential production increase is possible due to low steel trader stock levels.<br />
• Raw materials prices are expected to remain high.<br />
• Favorable outlook for gold.<br />
CIS including Russia:<br />
• Steel demand is expected to grow by above 8% year-on-year in 2011.<br />
• Still expensive raw materials would benefit vertically integrated steelmakers.<br />
• Potential upside from Government spending on infrastructure.<br />
USA:<br />
• Continuing pricing pressures in Q3 2010 with expected steel prices recovery in Q1 2011 .<br />
• Inventory levels at service centers at record lows.<br />
• Automotive continues to be the best steel consuming segment.<br />
Source: WSD, GFMS, MBR, VTB, <strong>Severstal</strong> analysis.<br />
22
Q3 and 9M 2010 Conclusions<br />
• Dividend payment restored.<br />
• Q3 2010 results reflect seasonal steel market decline hedged by the company’s mining<br />
business.<br />
• On-going mining expansion.<br />
• Vertically integrated model in Russia.<br />
• Potential operational improvement upside from international assets restructuring.<br />
• Expected market environment improvement.<br />
23
Thank you. Q&A<br />
Investor Relations<br />
T: +7 (495) 926 77 66 (Moscow)<br />
vladimir.zaluzhsky@severstal.com<br />
24
Appendices<br />
25
Q3 and 9M 2010 REVENUE Breakdown by Region<br />
Q3 2010/Q2 2010, $ mln<br />
Q2 2010 Q3 2010<br />
9M 2010/9M 2009, $ mln<br />
9M 2009 9M 2010<br />
Africa<br />
13<br />
25<br />
Africa<br />
74<br />
65<br />
South-East Asia<br />
78<br />
202<br />
South-East Asia<br />
223<br />
287<br />
China and Central Asia<br />
86<br />
119<br />
China and Central Asia<br />
614<br />
289<br />
Middle East<br />
121<br />
80<br />
Middle East<br />
221<br />
270<br />
Central and South America<br />
187<br />
108<br />
Central and South America<br />
69<br />
376<br />
Europe<br />
668<br />
523<br />
Europe<br />
992<br />
1,645<br />
North America<br />
1,538<br />
1,208<br />
North America<br />
3,051<br />
3,956<br />
Russian Federation<br />
1,554<br />
1,670<br />
Russian Federation<br />
2,671<br />
4,434<br />
0 500 1,000 1,500 2,000<br />
0 2,000 4,000 6,000<br />
Q3 2010 Highlights:<br />
• Sales to Russia increased by 7.5% on Q2 2010 figures and accounted for 42.4% of the total Company sales.<br />
• On a seasonally weaker European market, the Company shifted part of its exports to Central & South-East<br />
Asia and Africa which together contributed $346 million and accounted for 8.8% of the total Company sales.<br />
• Sales to North America declined by 21.5% on a challenging market and accounted for 30.7% of the total<br />
Company sales.<br />
26
Q3 and 9M 2010 Division Results<br />
<strong>Severstal</strong> Russia Steel<br />
Q3 2010 Q2 2010 Change, % 9M 2010 9M 2009 Change, %<br />
Revenue ($m) 2,264 2,415 (6.3%) 6,342 4,225 50.1%<br />
Cost of sales ($m) (1,590) (1,573) 1.1% (4,220) (2,918) 44.6%<br />
G&A ($m) (108) (92) 17.4% (297) (221) 34.4%<br />
G&A as % of Revenue 4.8% 3.8% 4.7% 5.2%<br />
EBITDA ($m) 339 528 (35.8%) 1,271 765 66.1%<br />
Operating Profit( $m) 264 449 (41.2%) 1,043 563 85.3%<br />
EBITDA Margin, % 15.0% 21.9% 20.0% 18.1%<br />
EBITDA per tonne ($/t) 125 179 (30.2%) 161 119 35.3%<br />
Average Selling Price (US$/t) 752 724 3.9% 716 575 24.5%<br />
<strong>Severstal</strong> International (North America)<br />
Q3 2010 Q2 2010 Change, % 9M 2010 9M 2009 Change, %<br />
Revenue ($m) 1,161 1,447 (19,8%) 3,777 2,965 27.4%<br />
Cost of sales ($m) (1,245) (1,397) (10.9%) (3,907) (3,575) 9.3%<br />
G&A ($m) (40) (46) (13.0%) (135) (127) 6.3%<br />
G&A as % of Revenue 3.4% 3.2% 3.6% 4.3%<br />
EBITDA ($m) (59) 59 n/a (83) (557) (85.1%)<br />
EBITDA Margin, % (5.1%) 4.1% (2.2%) (18.8%)<br />
EBITDA per tonne ($/t) (41) 34 n/a (18) (140) (87.1%)<br />
Operating Loss ($m) (119) (1) n/a (258) (741) (65.2%)<br />
Average Selling Price (US$/t) 802 826 (2.9%) 798 715 11.6%<br />
27
Q3 and 9M 2010 Division Results (Continued)<br />
<strong>Severstal</strong> Resources<br />
Q3 2010 Q2 2010 Change, % 9M 2010 9M 2009 Change, %<br />
Revenue ($m) 914 870 5.1% 2,378 1,250 90.2%<br />
Cost of sales ($m) (456) (419) 8.8% (1,270) (976) 30.1%<br />
G&A ($m) (43) (31) 38.7% (97) (82) 18.3%<br />
G&A as % of Revenue 4.7% 3.6% 4.1% 6.6%<br />
EBITDA ($m) 442 420 5.2% 1,041 222 368.9%<br />
Operating Profit ($m) 371 331 12.1% 817 7 n/a<br />
EBITDA Margin, % 48.4% 48.3% 43.8% 17.8%<br />
Gold Business (a part of <strong>Severstal</strong> Resources)<br />
Q3 2010 Q2 2010 Change, % 9M 2010 9M 2009 Change, %<br />
Sales (Troy ounces) 148 412 137 356 8.0% 408 406 360 640 13.2%<br />
Revenue ($m) 184 166 10.8% 485 344 41.0%<br />
EBITDA ($m) 95 89 6.7% 251 153 64.1%<br />
EBITDA Margin, % 51.6% 53.6% 51.8% 44.5%<br />
28
Lucchini<br />
EBITDA per tonne (US$/t)<br />
Average Selling Price (US$/t)*<br />
Key Factors of Q3 2010 Results:<br />
200<br />
100<br />
-<br />
72<br />
898<br />
8<br />
816<br />
795<br />
781<br />
9M 2009 9M 2010 Q2 2010 Q3 2010<br />
1,000<br />
• Q3 2010 is partially comparable to Q2<br />
2010 due to seasonal decline (summer<br />
holidays, planned maintenance idling,<br />
including increasing maintenance<br />
costs).<br />
(100)<br />
(200)<br />
(161)<br />
(66)<br />
500<br />
• Slight increase in raw materials prices<br />
and improvement in average sales<br />
prices due to better product mix.<br />
*All steel products; Ex Works price terms.<br />
Q3 2010 Q2 2010 Change, % 9M 2010 9M 2009 Change, %<br />
Revenue ($m) 545 661 (17.5%) 1,785 1,224 45.8%<br />
Cost of sales ($m) (573) (597) (4.0%) (1,747) (1,408) 24.1%<br />
G&A ($m) (21) (22) (4.5%) (67) (97) (30.9%)<br />
G&A as % of Revenue 3.9% 3.3% 3.8% 7.9%<br />
EBITDA ($m) (36) 53 n/a 16 (212) n/a<br />
Operating (Loss)/Profit ($m) (71) 21 n/a (88) (327) (73.1%)<br />
EBITDA Margin, % (6.6%) 8.0% 0.9% (17.3%)<br />
EBITDA per tonne ($/t) (66) 72 n/a 8 (161) n/a<br />
Average Selling Price (US$/t) 898 795 13.0% 781 816 (4.3%)<br />
29
Summary of Income Statement<br />
$ million, unless otherwise stated Q3 2010 Q2 2010 Change, % 9M 2010 9M 2009* Change, %<br />
Revenue 3,935 4,245 (7.3%) 11,322 7,915 43.0%<br />
EBITDA** 751 955 (21.4%) 2,198 426 416.0%<br />
EBITDA margin, % 19.1% 22.5% 19.4% 5.4%<br />
Profit /(loss) from operations 545 728 (25.1%) 1,571 (173) n/a<br />
Operating margin, % 13.9% 17.1% 13.9% (2.2%)<br />
Net profit/(loss)*** 368 192 91.7% (225) (875) (74.3%)<br />
EPS, $ 0.37 0.19 n/a (0.22) (0.87) n/a<br />
Dividend per share, $**** 0.14 n/a 0.14 n/a<br />
*2009 figures do not include Lucchini; ** EBITDA represents profit /(loss) from operations plus depreciation and amortization of productive assets adjusted for gain/(loss) on disposals of property, plant,<br />
equipment and intangible assets; *** Attributable to shareholders of OAO <strong>Severstal</strong>. *** *Dividends announced on the basis of respective period results, translated at the exchange rate as of the date of<br />
recommendation by Board of Directors<br />
30
Financial Position<br />
$ million As at 30 September 2010* As at 31 December 2009<br />
Cash and Cash Equivalents 2,055 2,853<br />
Total Assets: 19,713 19,644<br />
Current Assets 8,851 8,185<br />
Non-current Assets 10,862 11,459<br />
Total Liabilities: 11,953 11,268<br />
Current Liabilities 5,387 3,828<br />
Non-current Liabilities 6,566 7,440<br />
Total Equity 7,760 8,376<br />
Total Equity and Liabilities 19,713 19,644<br />
* Please view the note on Lucchini in the presentation.<br />
31
Summary of Cash Flow Statement<br />
$ million Q3 2010 Q2 2010 9M 2010 9M 2009<br />
Profit/ (Loss) before Financing and Taxation 538 722 1,484 (259)<br />
Cash Generated from Operations 924 587 1,506 1,193<br />
Interest Paid (184) (83) (415) (401)<br />
Income Tax Paid (26) (100) (193) (7)<br />
Net cash from operating activities - continuing operations 714 404 898 786<br />
Net cash (used in)/from operating activities - discontinued<br />
operations<br />
(19) 13 (71) 57<br />
Net Cash from Operating Activities 695 417 827 843<br />
Cash (used in)/from investing activities - continuing<br />
operations<br />
(338) (362) (1,072) 28<br />
Cash used in investing activities - discontinued operations (30) (35) (87) (104)<br />
Cash used in Investing Activities (368) (397) (1,158) (76)<br />
Additions to PP&E and IA (368) (297) (872) (604)<br />
Cash used in financing activities - continuing operations (226) (327) (125) (384)<br />
Cash used in financing activities - discontinued operations 16 (31) (33) (120)<br />
Cash used in Financing Activities (210) (358) (158) (504)<br />
Effect of Exchange Rates on Cash and Cash Equivalents 92 (145) (52) 20<br />
Net (decrease)/increase in Cash and Cash Equivalents 209 (483) (541) 283<br />
Net decrease/(increase) in Cash and Cash Equivalents of<br />
discontinued operations<br />
6 90 (257) 0<br />
Cash and Cash Equivalents at Beginning of the Period 1,840 2,233 2,853 2,654<br />
Cash and Cash Equivalents at End of the Period 2,055 1,840 2,055 2,937<br />
32