Presentation - Severstal
Presentation - Severstal
Presentation - Severstal

Create successful ePaper yourself
Turn your PDF publications into a flip-book with our unique Google optimized e-Paper software.
Vorkutaugol (RU)<br />
Karelsky Okatysh (RU)<br />
PBS Coals (USA)<br />
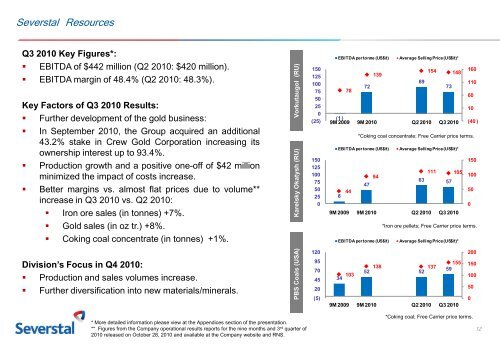
<strong>Severstal</strong> Resources<br />
Q3 2010 Key Figures*:<br />
• EBITDA of $442 million (Q2 2010: $420 million).<br />
• EBITDA margin of 48.4% (Q2 2010: 48.3%).<br />
Key Factors of Q3 2010 Results:<br />
• Further development of the gold business:<br />
• In September 2010, the Group acquired an additional<br />
43.2% stake in Crew Gold Corporation increasing its<br />
ownership interest up to 93.4%.<br />
• Production growth and a positive one-off of $42 million<br />
minimized the impact of costs increase.<br />
• Better margins vs. almost flat prices due to volume**<br />
increase in Q3 2010 vs. Q2 2010:<br />
• Iron ore sales (in tonnes) +7%.<br />
• Gold sales (in oz tr.) +8%.<br />
• Coking coal concentrate (in tonnes) +1%.<br />
150<br />
125<br />
100<br />
75<br />
50<br />
25<br />
0<br />
(25)<br />
150<br />
125<br />
100<br />
75<br />
50<br />
25<br />
0<br />
EBITDA per tonne (US$/t) Average Selling Price (US$/t)*<br />
139<br />
154 148<br />
160<br />
78<br />
72<br />
89<br />
73<br />
110<br />
60<br />
10<br />
(1 )<br />
9M 2009 9M 2010 Q2 2010 Q3 2010 (40 )<br />
*Coking coal concentrate; Free Carrier price terms.<br />
EBITDA per tonne (US$/t) Average Selling Price (US$/t)*<br />
150<br />
111 105<br />
94<br />
100<br />
63 57<br />
47<br />
44<br />
50<br />
8<br />
0<br />
9M 2009 9M 2010 Q2 2010 Q3 2010<br />
*Iron ore pellets; Free Carrier price terms.<br />
EBITDA per tonne (US$/t) Average Selling Price (US$/t)*<br />
120<br />
200<br />
Division’s Focus in Q4 2010:<br />
• Production and sales volumes increase.<br />
• Further diversification into new materials/minerals.<br />
95<br />
70<br />
45<br />
20<br />
(5)<br />
155<br />
138 137 59<br />
52 52<br />
103<br />
34<br />
9M 2009 9M 2010 Q2 2010 Q3 2010<br />
150<br />
100<br />
50<br />
0<br />
* More detailed information please view at the Appendices section of the presentation.<br />
** Figures from the Company operational results reports for the nine months and 3 rd quarter of<br />
2010 released on October 28, 2010 and available at the Company website and RNS.<br />
*Coking coal; Free Carrier price terms.<br />
12