Presentation - Severstal
Presentation - Severstal
Presentation - Severstal

You also want an ePaper? Increase the reach of your titles
YUMPU automatically turns print PDFs into web optimized ePapers that Google loves.
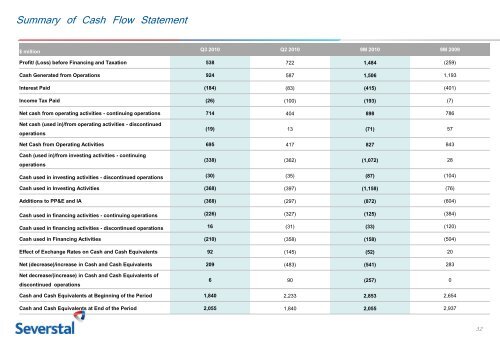
Summary of Cash Flow Statement<br />
$ million Q3 2010 Q2 2010 9M 2010 9M 2009<br />
Profit/ (Loss) before Financing and Taxation 538 722 1,484 (259)<br />
Cash Generated from Operations 924 587 1,506 1,193<br />
Interest Paid (184) (83) (415) (401)<br />
Income Tax Paid (26) (100) (193) (7)<br />
Net cash from operating activities - continuing operations 714 404 898 786<br />
Net cash (used in)/from operating activities - discontinued<br />
operations<br />
(19) 13 (71) 57<br />
Net Cash from Operating Activities 695 417 827 843<br />
Cash (used in)/from investing activities - continuing<br />
operations<br />
(338) (362) (1,072) 28<br />
Cash used in investing activities - discontinued operations (30) (35) (87) (104)<br />
Cash used in Investing Activities (368) (397) (1,158) (76)<br />
Additions to PP&E and IA (368) (297) (872) (604)<br />
Cash used in financing activities - continuing operations (226) (327) (125) (384)<br />
Cash used in financing activities - discontinued operations 16 (31) (33) (120)<br />
Cash used in Financing Activities (210) (358) (158) (504)<br />
Effect of Exchange Rates on Cash and Cash Equivalents 92 (145) (52) 20<br />
Net (decrease)/increase in Cash and Cash Equivalents 209 (483) (541) 283<br />
Net decrease/(increase) in Cash and Cash Equivalents of<br />
discontinued operations<br />
6 90 (257) 0<br />
Cash and Cash Equivalents at Beginning of the Period 1,840 2,233 2,853 2,654<br />
Cash and Cash Equivalents at End of the Period 2,055 1,840 2,055 2,937<br />
32