Presentation - Severstal
Presentation - Severstal
Presentation - Severstal

You also want an ePaper? Increase the reach of your titles
YUMPU automatically turns print PDFs into web optimized ePapers that Google loves.
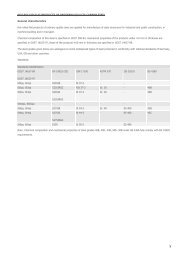
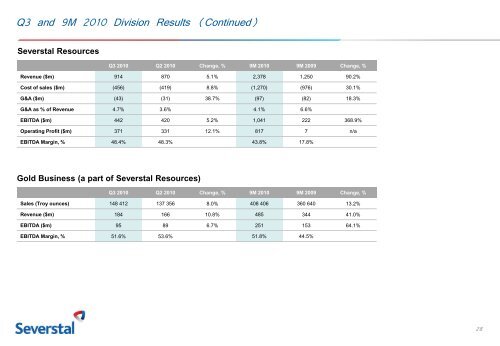
Q3 and 9M 2010 Division Results (Continued)<br />
<strong>Severstal</strong> Resources<br />
Q3 2010 Q2 2010 Change, % 9M 2010 9M 2009 Change, %<br />
Revenue ($m) 914 870 5.1% 2,378 1,250 90.2%<br />
Cost of sales ($m) (456) (419) 8.8% (1,270) (976) 30.1%<br />
G&A ($m) (43) (31) 38.7% (97) (82) 18.3%<br />
G&A as % of Revenue 4.7% 3.6% 4.1% 6.6%<br />
EBITDA ($m) 442 420 5.2% 1,041 222 368.9%<br />
Operating Profit ($m) 371 331 12.1% 817 7 n/a<br />
EBITDA Margin, % 48.4% 48.3% 43.8% 17.8%<br />
Gold Business (a part of <strong>Severstal</strong> Resources)<br />
Q3 2010 Q2 2010 Change, % 9M 2010 9M 2009 Change, %<br />
Sales (Troy ounces) 148 412 137 356 8.0% 408 406 360 640 13.2%<br />
Revenue ($m) 184 166 10.8% 485 344 41.0%<br />
EBITDA ($m) 95 89 6.7% 251 153 64.1%<br />
EBITDA Margin, % 51.6% 53.6% 51.8% 44.5%<br />
28