The Role of Intellectual Capital in Creating Value in the Banking ...
The Role of Intellectual Capital in Creating Value in the Banking ...
The Role of Intellectual Capital in Creating Value in the Banking ...

You also want an ePaper? Increase the reach of your titles
YUMPU automatically turns print PDFs into web optimized ePapers that Google loves.
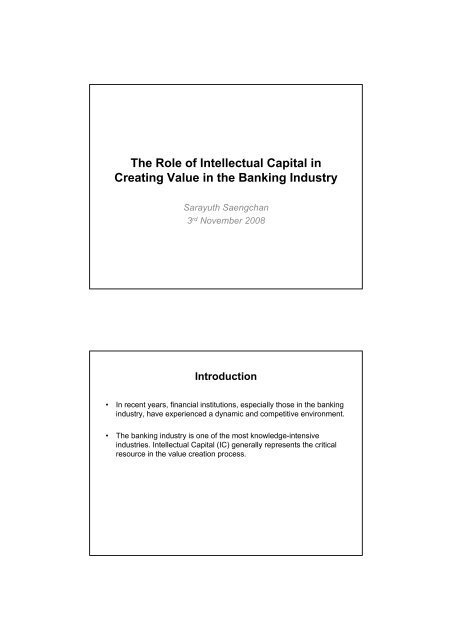
<strong>The</strong> <strong>Role</strong> <strong>of</strong> <strong>Intellectual</strong> <strong>Capital</strong> <strong>in</strong><br />
Creat<strong>in</strong>g <strong>Value</strong> <strong>in</strong> <strong>the</strong> Bank<strong>in</strong>g Industry<br />
Sarayuth Saengchan<br />
3 rd November 2008<br />
Introduction<br />
• In recent years, f<strong>in</strong>ancial <strong>in</strong>stitutions, especially those <strong>in</strong> <strong>the</strong> bank<strong>in</strong>g<br />
<strong>in</strong>dustry, have experienced a dynamic and competitive environment.<br />
• <strong>The</strong> bank<strong>in</strong>g <strong>in</strong>dustry is one <strong>of</strong> <strong>the</strong> most knowledge-<strong>in</strong>tensive<br />
<strong>in</strong>dustries. <strong>Intellectual</strong> <strong>Capital</strong> (IC) generally represents <strong>the</strong> critical<br />
resource <strong>in</strong> <strong>the</strong> value creation process.
Literature Review<br />
• <strong>Intellectual</strong> capital can be viewed as knowledge, <strong>in</strong> formation,<br />
<strong>in</strong>tellectual property and experience that can be put to use to create<br />
wealth (Stewart, 1997).<br />
• <strong>Intellectual</strong> capital <strong>in</strong>cludes all employees, organizational knowledge<br />
and <strong>the</strong>ir abilities to create value added and led to susta<strong>in</strong>able<br />
competitive advantage.<br />
• <strong>Intellectual</strong> capital has been identified as a set <strong>of</strong> <strong>in</strong>tangibles<br />
(resources, capabilities and compe-tences) that drives <strong>the</strong><br />
organizational performance and value creation. (Bontis,1998)<br />
Literature Review<br />
• This suggests causal relationships between <strong>in</strong>tellectual capital and<br />
organizational value creation. At least three elements are common<br />
<strong>in</strong> almost all def<strong>in</strong>itions: (i) <strong>in</strong>tangibility: (ii) knowledge that creates<br />
value and; (iii) effect <strong>of</strong> collective practice (Maria do Rosario Cabrita<br />
and Jorge Landeiro Vaz, 2005)<br />
• It is assumed that competitive advantage depends on how efficient<br />
<strong>the</strong> firm is <strong>in</strong> build<strong>in</strong>g shar<strong>in</strong>g, leverag<strong>in</strong>g and us<strong>in</strong>g its knowledge.
Literature Review<br />
• <strong>Value</strong> Added <strong>Intellectual</strong> Coefficient (VAIC TM )<br />
• Pulic (1998) proposed <strong>the</strong> <strong>Value</strong> Added <strong>Intellectual</strong> Coefficient<br />
(VAIC TM ) to provide <strong>in</strong>formation about <strong>the</strong> value creation efficiency <strong>of</strong><br />
tangible and <strong>in</strong>tangible assets with<strong>in</strong> a company.<br />
• VAIC TM is an analytical procedure designed to enable management,<br />
shareholders and o<strong>the</strong>r relevant stakeholders to effectively monitor<br />
and evaluate <strong>the</strong> efficiency <strong>of</strong> <strong>Value</strong> Added (VA) by a firm's total<br />
resources and each major resource component.<br />
Literature Review<br />
• <strong>Value</strong> added (VA) is <strong>the</strong> difference between sales (OUT) and <strong>in</strong>puts<br />
(IN): OUT - IN = VA.<br />
• Output (OUT) represents <strong>the</strong> overall <strong>in</strong>come, all <strong>the</strong> products and<br />
services sold on <strong>the</strong> market.<br />
• Inputs (IN) conta<strong>in</strong> all <strong>the</strong> expenses, everyth<strong>in</strong>g that came <strong>in</strong>to <strong>the</strong><br />
company. Labour expenses were not calculated <strong>in</strong>to <strong>in</strong>put due to <strong>the</strong><br />
active role <strong>in</strong> <strong>the</strong> value creat<strong>in</strong>g process, <strong>in</strong>tellectual potential,<br />
represented by labour expenses)
Literature Review<br />
• <strong>Value</strong> added grows out <strong>of</strong> physical capital and <strong>in</strong>tellectual potential.<br />
• Instead <strong>of</strong> valu<strong>in</strong>g <strong>the</strong> <strong>in</strong>tellectual capital <strong>of</strong> a firm, <strong>the</strong> VAIC method<br />
ma<strong>in</strong>ly measures <strong>the</strong> efficiency <strong>of</strong> firms' three types <strong>of</strong> <strong>in</strong>puts:<br />
physical and f<strong>in</strong>ancial capital, human capital, and structural capital,<br />
namely<br />
– <strong>the</strong> <strong>Capital</strong> Employed Efficiency (CEE) — <strong>in</strong>dicator <strong>of</strong> VA<br />
efficiency <strong>of</strong> capital employed,<br />
– <strong>the</strong> Human <strong>Capital</strong> Efficiency (HCE) — <strong>in</strong>dicator <strong>of</strong> VA<br />
efficiency <strong>of</strong> human capital, and<br />
– <strong>the</strong> Structural <strong>Capital</strong> Efficiency (SCE)— <strong>in</strong>dicator <strong>of</strong> VA<br />
efficiency <strong>of</strong> structural capital.<br />
• <strong>The</strong> sum <strong>of</strong> <strong>the</strong> three measures is <strong>the</strong> value <strong>of</strong> VAIC. <strong>The</strong> higher<br />
VAIC value results <strong>in</strong> better companies ' value creation potential.<br />
Literature Review<br />
• Pulic (1997, 2002) used VAIC TM model, which he developed,<br />
measured <strong>in</strong>tellectual capital performance <strong>of</strong> Austrian banks <strong>in</strong><br />
1993-1995 and Croatian banks <strong>in</strong> 1996-2000. <strong>The</strong>y revealed<br />
significant differences <strong>in</strong> bank rank<strong>in</strong>g based on efficiency and<br />
performance.<br />
• Dimitrios G. Mavridis (2004) applied <strong>the</strong> VAIC TM method <strong>in</strong> order to<br />
analyze <strong>the</strong> data <strong>of</strong> Japanese banks for <strong>the</strong> f<strong>in</strong>ancial period 1 April<br />
2000-31 March 2001, analyze <strong>the</strong> <strong>in</strong>tellectual or human (HC) and<br />
physical capital (CA) <strong>of</strong> <strong>the</strong> Japanese bank<strong>in</strong>g sector and discussed<br />
<strong>the</strong>ir impact on <strong>the</strong> banks’ value-based performance. <strong>The</strong> study<br />
confirmed <strong>the</strong> existence <strong>of</strong> significant performance differences<br />
among <strong>the</strong> various groups <strong>of</strong> Japanese banks but also <strong>the</strong><br />
differences between <strong>the</strong> Japanese and some European banks.
Literature Review<br />
• Pek Chen Goh (2005) measured <strong>the</strong> <strong>in</strong>tellectual capital performance<br />
<strong>of</strong> commercial banks <strong>in</strong> Malaysia for <strong>the</strong> period 2001 to 2003, us<strong>in</strong>g<br />
efficiency coefficient called VAIC" developed by Ante Pulic. As a<br />
whole, all banks have relatively higher human capital efficiency than<br />
structural and capital efficiencies. Domestic banks were generally<br />
less efficient compared to foreign banks.<br />
• G. Barathi Kamath (2007) estimate and analyze <strong>the</strong> <strong>Value</strong> Added<br />
<strong>Intellectual</strong> Coefficient (VAIC TM ) for measur<strong>in</strong>g <strong>the</strong> value-based<br />
performance <strong>of</strong> <strong>the</strong> Indian bank<strong>in</strong>g sector for a period <strong>of</strong> five years<br />
from 2000 to 2004. <strong>The</strong> study confirms <strong>the</strong> existence <strong>of</strong> vast<br />
differences <strong>in</strong> <strong>the</strong> performance <strong>of</strong> Indian banks <strong>in</strong> different<br />
segments, and <strong>the</strong>re is also an improvement <strong>in</strong> <strong>the</strong> overall<br />
performance over <strong>the</strong> study period.<br />
Statement <strong>of</strong> Problem<br />
• <strong>The</strong> difference <strong>in</strong> f<strong>in</strong>ancial performance between between <strong>the</strong> group<br />
<strong>of</strong> Thai banks and <strong>the</strong> group <strong>of</strong> foreign-owned banks results <strong>in</strong> <strong>the</strong><br />
study on how <strong>the</strong> <strong>in</strong>tellectual capital plays <strong>the</strong> role on <strong>the</strong> different<br />
f<strong>in</strong>ancial performances.
Research Objective<br />
• This study aims to evaluate <strong>the</strong> relationship between <strong>in</strong>tellectual<br />
capital capability and f<strong>in</strong>ancial performance <strong>of</strong> commercial banks <strong>in</strong><br />
Thailand.<br />
• It is to exam<strong>in</strong>e <strong>in</strong>terrelation-ships among <strong>in</strong>tellectual capital<br />
components and organizational performance, with <strong>the</strong> level <strong>of</strong><br />
human capital efficiency (HCE), capital employed efficiency (CEE)<br />
and structural capital efficiency (SCE).<br />
Model Estimation<br />
• Model 1 and model 2 exam<strong>in</strong>e <strong>the</strong> relationships between Return on total<br />
assets and Cost to Assets and <strong>the</strong> aggregate measure <strong>of</strong> <strong>in</strong>tellectual<br />
capital VAIC, and its three major components, Human capital efficiency<br />
(HCE) <strong>Capital</strong> employed efficiency (CEE) Structural capital efficiency<br />
(SCE) <strong>The</strong> regression models are as follows:<br />
• Model 1.1: ROA it = β 0 + β 1 VAIC it + GROUP it + ε it<br />
• Model 1.2: ROA it = β 0 + β 1 HCE it + β 2 CEE it + β 3 SCE it + GROUP it + ε it<br />
• Model 2.1: CTA it = β 0 + β 1 VAIC it + GROUP it + ε it<br />
• Model 2.2: CTA it = β 0 + β 1 HCE it + β 2 CEE it + β 3 SCE it + GROUP it + ε it
Model Estimation<br />
• Variable def<strong>in</strong>itions<br />
• Dependent variables:<br />
• Return on total assets (ROA) refers to Total <strong>in</strong>come, <strong>in</strong>clud<strong>in</strong>g net<br />
<strong>in</strong>terest <strong>in</strong>come and non <strong>in</strong>terest <strong>in</strong>come, over total assets.<br />
• Cost to Assets (CTA) refers to operat<strong>in</strong>g costs over total assets<br />
Model Estimation<br />
• Independent variables:<br />
• VAIC TM i = CEE i + HCE i + SCE i where<br />
• VAIC TM = VA <strong>in</strong>tellectual coefficient for firm i;<br />
– CEE i = VA i /CE i VA capital employed coefficient for firm i;<br />
– HCE i = VA i /HC i ; human capital coefficient for firm i;<br />
– SCE i = SC i /VA i ; structural capital VA for firm i;<br />
– VA i = Output – Input (Total Income – Operat<strong>in</strong>g Expenses exclud<strong>in</strong>g<br />
Salaries and employee benefits)<br />
– CE i = book value <strong>of</strong> <strong>the</strong> net assets for firm i<br />
– HC i = Salaries and employee benefits for firm i;<br />
– SC i = VA i -HC i structural capital for firm i.
Model Estimation<br />
• Human capital efficiency (HCE) refers to <strong>in</strong>dicator <strong>of</strong> VA efficiency <strong>of</strong><br />
human capital.<br />
• <strong>Capital</strong> employed efficiency (CEE) refers to <strong>in</strong>dicator <strong>of</strong> VA efficiency<br />
<strong>of</strong> capital employed.<br />
• Structural capital efficiency (SCE) refers to <strong>in</strong>dicator <strong>of</strong> VA efficiency<br />
<strong>of</strong> structural capital.<br />
• GROUP refers to types <strong>of</strong> commercial banks i.e. 0 = foreign banks’<br />
branches and 1 = commercial banks registered <strong>in</strong> Thailand (Thai<br />
banks).<br />
•<br />
Data<br />
• Period<br />
– from 2000 until 2007<br />
• Half-year bank-level data<br />
– Published statistics by <strong>the</strong> Bank <strong>of</strong> Thailand, which classifies <strong>the</strong><br />
data <strong>in</strong>to 2 groups, commercial banks registered <strong>in</strong> Thailand<br />
(Thai banks) and foreign banks’ branches. <strong>The</strong> variables are<br />
selected from <strong>the</strong> banks’ balance sheet and <strong>in</strong>come statements.
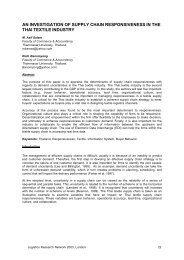
ROA: Gross Income / Assets<br />
0.03<br />
0.025<br />
0.02<br />
0.015<br />
0.01<br />
0.005<br />
0<br />
H1-00 H2-00 H1-01 H2-01 H1-02 H2-02 H1-03 H2-03 H1-04 H2-04 H1-05 H2-05 H1-06 H2-06 H1-07 H2-07<br />
Foreign Banks<br />
Thai Banks<br />
Cost to Assets<br />
0.02<br />
0.018<br />
0.016<br />
0.014<br />
0.012<br />
0.01<br />
0.008<br />
0.006<br />
0.004<br />
0.002<br />
0<br />
H1-00 H2-00 H1-01 H2-01 H1-02 H2-02 H1-03 H2-03 H1-04 H2-04 H1-05 H2-05 H1-06 H2-06 H1-07 H2-07<br />
Foreign Banks<br />
Thai Banks
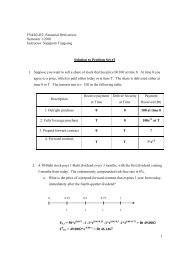
VAIC<br />
7<br />
6<br />
5<br />
4<br />
3<br />
2<br />
1<br />
0<br />
H1-00 H2-00 H1-01 H2-01 H1-02 H2-02 H1-03 H2-03 H1-04 H2-04 H1-05 H2-05 H1-06 H2-06 H1-07 H2-07<br />
Foreign Banks<br />
Thai Banks<br />
HCE: VA / HC<br />
6<br />
5<br />
4<br />
3<br />
2<br />
1<br />
0<br />
H1-00 H2-00 H1-01 H2-01 H1-02 H2-02 H1-03 H2-03 H1-04 H2-04 H1-05 H2-05 H1-06 H2-06 H1-07 H2-07<br />
Foreign Banks<br />
Thai Banks
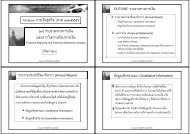
CEE: VA /CE<br />
0.02<br />
0.018<br />
0.016<br />
0.014<br />
0.012<br />
0.01<br />
0.008<br />
0.006<br />
0.004<br />
0.002<br />
0<br />
H1-00 H2-00 H1-01 H2-01 H1-02 H2-02 H1-03 H2-03 H1-04 H2-04 H1-05 H2-05 H1-06 H2-06 H1-07 H2-07<br />
Foreign Banks<br />
Thai Banks<br />
SCE: SC / VA<br />
0.9<br />
0.8<br />
0.7<br />
0.6<br />
0.5<br />
0.4<br />
0.3<br />
0.2<br />
0.1<br />
0<br />
-0.1<br />
-0.2<br />
H1-00 H2-00 H1-01 H2-01 H1-02 H2-02 H1-03 H2-03 H1-04 H2-04 H1-05 H2-05 H1-06 H2-06 H1-07 H2-07<br />
Foreign Banks<br />
Thai Banks
Empirical Results<br />
• Model 1.1:<br />
• ROA it = β 0 + β 1 VAIC it + GROUP it + ε it<br />
• ROA = 0.013323 + 0.001913 VAIC-0.002445 GROUP<br />
Std. Error (0.002344) (0.000482) (0.001186)<br />
t-Statistic (5.684467) (3.971231) (-2.060496)<br />
Empirical Results<br />
• Model 1.2:<br />
• ROA it<br />
= β 0<br />
+ β 1<br />
HCE it<br />
+ β 2<br />
CEE it<br />
+ β 3<br />
SCE it<br />
+ GROUP it<br />
+ ε it<br />
• ROA =0.0141 -0.0035HCE + 1.5257CEE + 0.0037SCE - 0.0044GROUP<br />
Std. Error (0.001340) (0.000839) (0.199637) (0.003179) (0.000723)<br />
t-Statistic (10.52359) (-4.145782) (7.642312) (1.156430) (-6.040568)
Empirical Results<br />
• Model 3.1:<br />
• CTA it = β 0 + β 1 VAIC it + GROUP it + ε it<br />
• CTA = 0.0172 -0.0009VAIC -0.0032GROUP<br />
Std. Error (0.001722) (0.000354) (0.000872 )<br />
t-Statistic (9.969718) (-2.554420) (-3.673549)<br />
Empirical Results<br />
• Model 3.2:<br />
• CTA it<br />
= β 0<br />
+ β 1<br />
HCE it<br />
+ β 2<br />
CEE it<br />
+ β 3<br />
SCE it<br />
+ GROUP it<br />
+ ε it<br />
• CTA = 0.0175 -0.0043HCE + 0.7921CEE + 0.0035SCE - -0.0044GROUP<br />
Std. Error (0.001357) (0.000849) (0.202187) (0.003220) (0.000732)<br />
t-Statistic (12.90759) (-5.119105) (3.917524) (1.092244) (-5.962420)
Conclusions<br />
• Empirical f<strong>in</strong>d<strong>in</strong>gs have some strong association between <strong>the</strong><br />
efficiency <strong>of</strong> <strong>in</strong>tellectual capital and banks’ f<strong>in</strong>ancial performance.<br />
• With regards to pr<strong>of</strong>itability, <strong>the</strong> efficiency <strong>of</strong> <strong>Intellectual</strong> <strong>Capital</strong> is to<br />
be significantly associated. When it is classified <strong>in</strong>to major<br />
components, <strong>the</strong> efficiency <strong>of</strong> total assets (CEE) plays a major role<br />
<strong>in</strong> enhanc<strong>in</strong>g <strong>the</strong> returns. <strong>The</strong> total assets, both f<strong>in</strong>ancial and<br />
physical assets, have been utilized importantly <strong>in</strong> generat<strong>in</strong>g highly<br />
valued returns.<br />
Conclusions<br />
• In terms <strong>of</strong> cost efficiency, <strong>the</strong> efficiency <strong>of</strong> <strong>in</strong>tellectual capital also<br />
strongly related with <strong>the</strong> cost-to-assets ratio, <strong>in</strong>dicat<strong>in</strong>g that <strong>the</strong><br />
higher <strong>in</strong>tellectual capability <strong>the</strong> bank has, <strong>the</strong> efficient cost can be<br />
managed.<br />
• Fur<strong>the</strong>rmore, <strong>the</strong> human resources management is a major factor <strong>in</strong><br />
determ<strong>in</strong><strong>in</strong>g <strong>the</strong> cost efficiency, result<strong>in</strong>g from <strong>the</strong> highly negative<br />
correlation between cost-to-assets and human capital efficiency<br />
(HCE).
Q & A