pore pressure prediction in the niger delta â lessons ... - Ikon Science
pore pressure prediction in the niger delta â lessons ... - Ikon Science
pore pressure prediction in the niger delta â lessons ... - Ikon Science

Create successful ePaper yourself
Turn your PDF publications into a flip-book with our unique Google optimized e-Paper software.
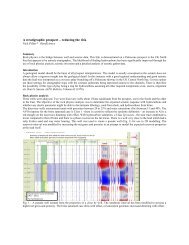
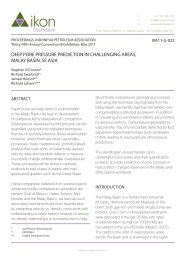
Pore Pressure Prediction <strong>in</strong> <strong>the</strong> Niger Delta<br />
- <strong>lessons</strong> learnt from regional analysis<br />
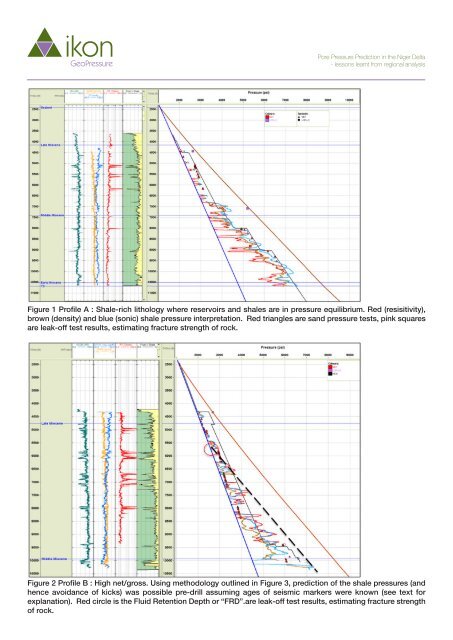
Figure 1 Profile A : Shale-rich lithology where reservoirs and shales are <strong>in</strong> <strong>pressure</strong> equilibrium. Red (resisitivity),<br />
brown (density) and blue (sonic) shale <strong>pressure</strong> <strong>in</strong>terpretation. Red triangles are sand <strong>pressure</strong> tests, p<strong>in</strong>k squares<br />
are leak-off test results, estimat<strong>in</strong>g fracture strength of rock.<br />
Figure 2 Profile B : High net/gross. Us<strong>in</strong>g methodology outl<strong>in</strong>ed <strong>in</strong> Figure 3, <strong>prediction</strong> of <strong>the</strong> shale <strong>pressure</strong>s (and<br />
hence avoidance of kicks) was possible pre-drill assum<strong>in</strong>g ages of seismic markers were known (see text for<br />
explanation). Red circle is <strong>the</strong> Fluid Retention Depth or “FRD”.are leak-off test results, estimat<strong>in</strong>g fracture strength<br />
of rock.