pore pressure prediction in the niger delta â lessons ... - Ikon Science
pore pressure prediction in the niger delta â lessons ... - Ikon Science
pore pressure prediction in the niger delta â lessons ... - Ikon Science

Create successful ePaper yourself
Turn your PDF publications into a flip-book with our unique Google optimized e-Paper software.
T: +44 191 334 2191<br />
E: <strong>in</strong>fo@ikonscience.com<br />
W: www.ikonscience.com<br />
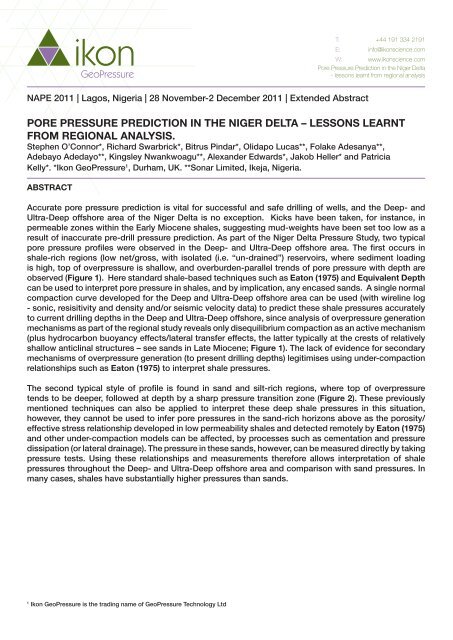
Pore Pressure Prediction <strong>in</strong> <strong>the</strong> Niger Delta<br />
- <strong>lessons</strong> learnt from regional analysis<br />
NAPE 2011 | Lagos, Nigeria | 28 November-2 December 2011 | Extended Abstract<br />
PORE PRESSURE PREDICTION IN THE NIGER DELTA – LESSONS LEARNT<br />
FROM REGIONAL ANALYSIS.<br />
Stephen O’Connor*, Richard Swarbrick*, Bitrus P<strong>in</strong>dar*, Olidapo Lucas**, Folake Adesanya**,<br />
Adebayo Adedayo**, K<strong>in</strong>gsley Nwankwoagu**, Alexander Edwards*, Jakob Heller* and Patricia<br />
Kelly*. *<strong>Ikon</strong> GeoPressure 1 , Durham, UK. **Sonar Limited, Ikeja, Nigeria.<br />
ABSTRACT<br />
Accurate <strong>pore</strong> <strong>pressure</strong> <strong>prediction</strong> is vital for successful and safe drill<strong>in</strong>g of wells, and <strong>the</strong> Deep- and<br />
Ultra-Deep offshore area of <strong>the</strong> Niger Delta is no exception. Kicks have been taken, for <strong>in</strong>stance, <strong>in</strong><br />
permeable zones with<strong>in</strong> <strong>the</strong> Early Miocene shales, suggest<strong>in</strong>g mud-weights have been set too low as a<br />
result of <strong>in</strong>accurate pre-drill <strong>pressure</strong> <strong>prediction</strong>. As part of <strong>the</strong> Niger Delta Pressure Study, two typical<br />
<strong>pore</strong> <strong>pressure</strong> profiles were observed <strong>in</strong> <strong>the</strong> Deep- and Ultra-Deep offshore area. The first occurs <strong>in</strong><br />
shale-rich regions (low net/gross, with isolated (i.e. “un-dra<strong>in</strong>ed”) reservoirs, where sediment load<strong>in</strong>g<br />
is high, top of over<strong>pressure</strong> is shallow, and overburden-parallel trends of <strong>pore</strong> <strong>pressure</strong> with depth are<br />
observed (Figure 1). Here standard shale-based techniques such as Eaton (1975) and Equivalent Depth<br />
can be used to <strong>in</strong>terpret <strong>pore</strong> <strong>pressure</strong> <strong>in</strong> shales, and by implication, any encased sands. A s<strong>in</strong>gle normal<br />
compaction curve developed for <strong>the</strong> Deep and Ultra-Deep offshore area can be used (with wirel<strong>in</strong>e log<br />
- sonic, resisitivity and density and/or seismic velocity data) to predict <strong>the</strong>se shale <strong>pressure</strong>s accurately<br />
to current drill<strong>in</strong>g depths <strong>in</strong> <strong>the</strong> Deep and Ultra-Deep offshore, s<strong>in</strong>ce analysis of over<strong>pressure</strong> generation<br />
mechanisms as part of <strong>the</strong> regional study reveals only disequilibrium compaction as an active mechanism<br />
(plus hydrocarbon buoyancy effects/lateral transfer effects, <strong>the</strong> latter typically at <strong>the</strong> crests of relatively<br />
shallow anticl<strong>in</strong>al structures – see sands <strong>in</strong> Late Miocene; Figure 1). The lack of evidence for secondary<br />
mechanisms of over<strong>pressure</strong> generation (to present drill<strong>in</strong>g depths) legitimises us<strong>in</strong>g under-compaction<br />
relationships such as Eaton (1975) to <strong>in</strong>terpret shale <strong>pressure</strong>s.<br />
The second typical style of profile is found <strong>in</strong> sand and silt-rich regions, where top of over<strong>pressure</strong><br />
tends to be deeper, followed at depth by a sharp <strong>pressure</strong> transition zone (Figure 2). These previously<br />
mentioned techniques can also be applied to <strong>in</strong>terpret <strong>the</strong>se deep shale <strong>pressure</strong>s <strong>in</strong> this situation,<br />
however, <strong>the</strong>y cannot be used to <strong>in</strong>fer <strong>pore</strong> <strong>pressure</strong>s <strong>in</strong> <strong>the</strong> sand-rich horizons above as <strong>the</strong> porosity/<br />
effective stress relationship developed <strong>in</strong> low permeability shales and detected remotely by Eaton (1975)<br />
and o<strong>the</strong>r under-compaction models can be affected, by processes such as cementation and <strong>pressure</strong><br />
dissipation (or lateral dra<strong>in</strong>age). The <strong>pressure</strong> <strong>in</strong> <strong>the</strong>se sands, however, can be measured directly by tak<strong>in</strong>g<br />
<strong>pressure</strong> tests. Us<strong>in</strong>g <strong>the</strong>se relationships and measurements <strong>the</strong>refore allows <strong>in</strong>terpretation of shale<br />
<strong>pressure</strong>s throughout <strong>the</strong> Deep- and Ultra-Deep offshore area and comparison with sand <strong>pressure</strong>s. In<br />
many cases, shales have substantially higher <strong>pressure</strong>s than sands.<br />
1<br />
<strong>Ikon</strong> GeoPressure is <strong>the</strong> trad<strong>in</strong>g name of GeoPressure Technology Ltd
Pore Pressure Prediction <strong>in</strong> <strong>the</strong> Niger Delta<br />
- <strong>lessons</strong> learnt from regional analysis<br />
Figure 1 Profile A : Shale-rich lithology where reservoirs and shales are <strong>in</strong> <strong>pressure</strong> equilibrium. Red (resisitivity),<br />
brown (density) and blue (sonic) shale <strong>pressure</strong> <strong>in</strong>terpretation. Red triangles are sand <strong>pressure</strong> tests, p<strong>in</strong>k squares<br />
are leak-off test results, estimat<strong>in</strong>g fracture strength of rock.<br />
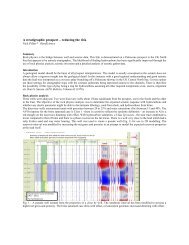
Figure 2 Profile B : High net/gross. Us<strong>in</strong>g methodology outl<strong>in</strong>ed <strong>in</strong> Figure 3, <strong>prediction</strong> of <strong>the</strong> shale <strong>pressure</strong>s (and<br />
hence avoidance of kicks) was possible pre-drill assum<strong>in</strong>g ages of seismic markers were known (see text for<br />
explanation). Red circle is <strong>the</strong> Fluid Retention Depth or “FRD”.are leak-off test results, estimat<strong>in</strong>g fracture strength<br />
of rock.
Pore Pressure Prediction <strong>in</strong> <strong>the</strong> Niger Delta<br />
- <strong>lessons</strong> learnt from regional analysis<br />
In this paper, we describe ano<strong>the</strong>r method to calculate <strong>the</strong>se shale <strong>pressure</strong>s, one based on sedimentation<br />
rates and load<strong>in</strong>g. The top of over<strong>pressure</strong> is <strong>the</strong> po<strong>in</strong>t at which <strong>the</strong> <strong>pore</strong> <strong>pressure</strong> starts to deviate from<br />
<strong>the</strong> hydrostatic l<strong>in</strong>e. In terms of process, as fluids are <strong>in</strong>hibited from escap<strong>in</strong>g as sedimentation <strong>in</strong>creases,<br />
porosity loss is slowed, and over<strong>pressure</strong> builds – <strong>the</strong>re is a departure from <strong>the</strong> normal compaction<br />
curve. The depth of top of over<strong>pressure</strong> is controlled by <strong>the</strong> permeability, rock compressibility and<br />
sedimentation rate. The Fluid Retention Depth (or FRD) is <strong>the</strong> po<strong>in</strong>t at which rocks completely cease<br />
to dewater due to low sediment permeability (Swarbrick et al., 2002; Gluyas and Swarbrick, 2004).<br />
The FRD is determ<strong>in</strong>ed by an extrapolation from <strong>in</strong>ferred shale <strong>pressure</strong>s, to <strong>in</strong>tersect <strong>the</strong> hydrostatic<br />
gradient – <strong>the</strong> trend should be approximately overburden parallel. Swarbrick et al. (2002) showed that<br />
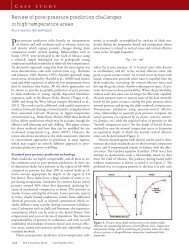
<strong>the</strong>re is a correlation between sedimentation rate and FRD us<strong>in</strong>g data from shale dom<strong>in</strong>ated regions<br />
(Figures 3 and 4). Data <strong>in</strong> Swarbrick et al. (2002) is presented from <strong>the</strong> Gulf of Mexico, Tr<strong>in</strong>idad, Nile<br />
Delta and o<strong>the</strong>r world-wide bas<strong>in</strong>s. Us<strong>in</strong>g this trend for <strong>pore</strong> <strong>pressure</strong> allows an assessment of shale<br />
<strong>pressure</strong>s to be made. This technique is highlighted below.<br />
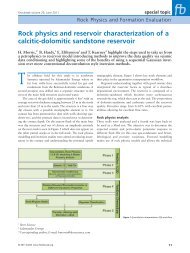
Figure 3 Methodology for <strong>prediction</strong> of shale <strong>pressure</strong> us<strong>in</strong>g Swarbrick et al. (2002) applied to data from Nile Delta.<br />
Us<strong>in</strong>g data from Mann and Mackenzie (1990) from <strong>the</strong> Nile Delta, where sedimentation or depositional<br />
rate is calculated to be 810m/Ma, us<strong>in</strong>g <strong>the</strong> relationship <strong>in</strong> Swarbrick et al. (2002) suggests an FRD<br />
of 2,620 feet TVDbml (where bml is below mud-l<strong>in</strong>e or seabed). Therefore, with foreknowledge of<br />
sedimentation rate, one can estimate <strong>the</strong> FRD depth us<strong>in</strong>g data compiled by Swarbrick et al. (2002).<br />
With this <strong>in</strong> m<strong>in</strong>d <strong>the</strong> <strong>pressure</strong> at any depth can be estimated on a Pressure-Depth plot by plott<strong>in</strong>g a<br />
gradient parallel to <strong>the</strong> overburden gradient, start<strong>in</strong>g at <strong>the</strong> FRD. This method assumes that over<strong>pressure</strong><br />
is generated entirely by disequilibrium compaction which for <strong>the</strong> Niger Delta seems reasonable s<strong>in</strong>ce<br />
<strong>the</strong> sediments are young, shale/sand dom<strong>in</strong>ated and <strong>the</strong> velocity-density cross-plots reveal little or no<br />
secondary mechanisms to be present.<br />
In Figure 2, we present <strong>the</strong> results of test<strong>in</strong>g this approach on a well taken from <strong>the</strong> East of <strong>the</strong> study<br />
area where water depth is 2433 feet. In this well, <strong>the</strong> Late Miocene, although relatively shale-rich, has<br />
numerous sand units present. Pressure tests <strong>in</strong> <strong>the</strong>se sand record m<strong>in</strong>or over<strong>pressure</strong>s, with <strong>pressure</strong>s
Pore Pressure Prediction <strong>in</strong> <strong>the</strong> Niger Delta<br />
- <strong>lessons</strong> learnt from regional analysis<br />
affected by hydrocarbon buoyancy effects. Hydrocarbons are suggested both by fluids gradients from<br />
<strong>the</strong> <strong>pressure</strong> tests and by resistivity log response. Shales <strong>in</strong>-between <strong>the</strong> sand units are <strong>in</strong>terpreted<br />
us<strong>in</strong>g <strong>the</strong> under-compaction techniques mentioned previously, to have <strong>pressure</strong>s above those <strong>in</strong> <strong>the</strong><br />
reservoirs, a common feature of <strong>the</strong> Deep- and Ultra-Deep offshore. These sands are laterally-dra<strong>in</strong>ed<br />
and allow horizontal <strong>pressure</strong> escape to shallower levels <strong>in</strong> <strong>the</strong> Delta and/or seabed. Supportive evidence<br />
for this lateral dra<strong>in</strong>age is seen where compar<strong>in</strong>g <strong>pressure</strong>s <strong>in</strong> <strong>the</strong> two deepest sands <strong>in</strong> <strong>the</strong> well i.e. <strong>the</strong><br />
deepest sand has <strong>pressure</strong> test data that records lower over<strong>pressure</strong>s than <strong>the</strong> sand above, at shallower<br />
stratigraphic <strong>in</strong>tervals, imply<strong>in</strong>g differential dra<strong>in</strong>age of <strong>pressure</strong>s. Towards <strong>the</strong> base of <strong>the</strong> Late Miocene,<br />
sand units are rare, and, as shale-lithology dom<strong>in</strong>ate, <strong>pressure</strong>s <strong>in</strong>crease, recorded by <strong>in</strong>creases <strong>in</strong> mudweight.<br />
Several kicks are reported <strong>in</strong> this well at this level, taken <strong>in</strong> th<strong>in</strong> sand units, <strong>the</strong>refore suggest<strong>in</strong>g<br />
this <strong>in</strong>creas<strong>in</strong>g shale <strong>pressure</strong> were not predicted pre-drill. Us<strong>in</strong>g <strong>the</strong> <strong>pressure</strong> tests at a depth of 9850<br />
feet TVDss (or 7417 feet TVDbml) and an age of this sand unit as approximately <strong>the</strong> Top Middle Miocene<br />
of 11.6 Ma, and <strong>the</strong> relationship displayed <strong>in</strong> Figure 4, predicts <strong>the</strong> FRD for this sedimentation rate of 638<br />
feet (or 194m) per Ma <strong>in</strong> this well to be 0.9 km or 2950 feet TVDbml (or 5400 TVDss). The shale <strong>pressure</strong>s<br />
at depth, us<strong>in</strong>g <strong>the</strong> implied <strong>pore</strong> <strong>pressure</strong> trend for shales, gives a close matches to <strong>the</strong> kick data close<br />
to <strong>the</strong> base of <strong>the</strong> Late Miocene <strong>in</strong>terval i.e. us<strong>in</strong>g this method alone would have successfully predicted<br />
<strong>the</strong> shale <strong>pressure</strong>s and prevented drill<strong>in</strong>g problems.<br />
Figure 4 Sedimentation Rate vs. FRD (Swarbrick et al, 2002). Green arrow represents Nile Delta data (see Figure 3).<br />
Blue arrow is data from a Niger Delta well <strong>in</strong> <strong>the</strong> study.<br />
As part of <strong>the</strong> Study, we analysed “FRD’s” from 15 selected wells all with well-def<strong>in</strong>ed stratigraphy, gamma<br />
ray, sonic, resistivity and density logs and <strong>pressure</strong> data – to complete this analysis, all of <strong>the</strong>se criteria<br />
need to be fulfilled. The majority of <strong>the</strong>se wells give a close match between extrapolat<strong>in</strong>g our shalebased<br />
<strong>in</strong>terpretation to <strong>in</strong>tersect <strong>the</strong> hydrostatic l<strong>in</strong>e, and a calculation of FRD based on sedimentation
Pore Pressure Prediction <strong>in</strong> <strong>the</strong> Niger Delta<br />
- <strong>lessons</strong> learnt from regional analysis<br />
rates, <strong>the</strong> method outl<strong>in</strong>ed above. In <strong>the</strong>se wells, FRD’s varied between 2750 feet TVDbml and 3850 feet<br />
TVDbml. The average calculated FRD for <strong>the</strong> selected 15 wells from both <strong>the</strong> West and east regions of<br />
<strong>the</strong> Delta is 3270 feet TVDbml.<br />
Us<strong>in</strong>g this approach def<strong>in</strong>ed <strong>in</strong> Swarbrick et al. (2002) provides a second, <strong>in</strong>dependent method to calibrate<br />
<strong>the</strong> log and/or seismic velocity based techniques of Eaton (1975) and o<strong>the</strong>r algorithms to <strong>in</strong>terpret shale<br />
<strong>pressure</strong>s <strong>in</strong> <strong>the</strong> deep- and Ultra-deep offshore of <strong>the</strong> Niger Delta. This method to estimate <strong>the</strong> shale<br />
<strong>pressure</strong>s, and hence magnitude of over<strong>pressure</strong>, based on sedimentation rate is l<strong>in</strong>ked to process<br />
(disequilibrium compaction) although is empirical. In a pre-drill situation, seismic chrono-stratigraphic<br />
markers can be used to establish <strong>the</strong> rate of sedimentation, with seismic facies used to provide a guide<br />
to net/gross. Comparison of this method with analysis of shale-based <strong>pressure</strong> profiles us<strong>in</strong>g <strong>the</strong> full<br />
suite of available wirel<strong>in</strong>e log responses provides added confidence <strong>in</strong> <strong>the</strong> regional <strong>pressure</strong> <strong>prediction</strong>.<br />
Fur<strong>the</strong>rmore <strong>the</strong> comparison improves our ability to def<strong>in</strong>e <strong>the</strong> regional flow characteristics of <strong>the</strong> ma<strong>in</strong><br />
reservoirs which govern migration and trapp<strong>in</strong>g of hydrocarbons.<br />
Acknowledgements<br />
The authors would like to thank <strong>the</strong> Nigerian Department of Petroleum Resources (DPR), <strong>in</strong> particular<br />
Lufadeju Olugbenga, National Data Repository (NDR) and NAPIMS for <strong>the</strong>ir active support of <strong>the</strong> study<br />
and <strong>the</strong>ir assistance <strong>in</strong> provid<strong>in</strong>g data. The authors are also very appreciative of <strong>the</strong> assistance provided<br />
by representatives from <strong>the</strong> sponsor companies (SNEPCO, Addax Petroleum, Chevron Nigeria, Petrobras<br />
Nigeria, TOTAL Nigeria and ENI/AGIP). The management of Sonar Limited is also acknowledged. The<br />
statements made <strong>in</strong> this extended abstract represents <strong>the</strong> views expressed by <strong>the</strong> authors and not<br />
necessarily <strong>the</strong> views held by those organisations listed above.<br />
OPTIMISE SUCCESS THROUGH SCIENCE<br />
Registered <strong>in</strong> England No.03359723