You also want an ePaper? Increase the reach of your titles
YUMPU automatically turns print PDFs into web optimized ePapers that Google loves.
<strong>Euler</strong> <strong>Hermes</strong><br />
Economic Outlook no. 6 | 2011 - Global Sectors Review<br />
Global risk<br />
B <br />
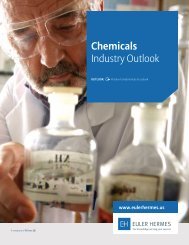
Chemicals<br />
In tune with the health of world trade<br />
Overview: back to a bull cycle<br />
Estimated at €2.1 trillion excluding pharmaceuticals,<br />
worldwide chemical sales recovered remarkably in 2010. This<br />
came on the heels of two dangerous years, in 2008 and ev<strong>en</strong><br />
more in 2009, during which period they fell to €1.87 trillion.<br />
World chemical production rose 9.3% by volume betwe<strong>en</strong> 2009<br />
and 2010, boosted in particular by output in Asia (+13%) and in<br />
the European Union (+10%). It b<strong>en</strong>efited from massive<br />
restocking and from a dramatic revival in demand from<br />
operators in the chemical industry’s biggest markets, led for<br />
their part by the electronics and automotive sectors. Asia,<br />
North America and the EU together account for 85% of global<br />
chemical turnover, with China on its own accounting for 22%<br />
and now tailing Europe, at 24%.<br />
Curr<strong>en</strong>t situation: a successful year<br />
The effects of the cyclical upturn in the sector at the <strong>en</strong>d of<br />
2010, translated into excell<strong>en</strong>t financial performances by the<br />
major world chemical operators, such as BASF, which doubled<br />
its profitability. The measures operators took in response to the<br />
crisis to boost productivity and refocus on activities in which<br />
they occupy key positions have helped in this. But some<br />
geographical markets, like some segm<strong>en</strong>ts of the chemicals<br />
sector, are not doing so well as others. European petrochemical<br />
companies, for example, are forced to restructure in the face of<br />
price competition from their Middle Eastern counterparts. On<br />
the other side of the Atlantic, the industry is suffering from the<br />
poor state of its second biggest market, resid<strong>en</strong>tial<br />
construction, which failed to revive last year. In the <strong>en</strong>d, it is<br />
Asia and the EU that are b<strong>en</strong>efiting more from the growth in the<br />
chemicals market: Asia – including, of course, China – through<br />
their necessary investm<strong>en</strong>ts in infrastructure and in<br />
developing their industries, and the EU due to its strong<br />
positioning in exports, posting a 2010 sectoral trade surplus of<br />
€47 billion. The slight slowing of activity in the sector in Q4 2010<br />
proved only short-lived. The first quarter of 2011 brought a<br />
revival in chemical production, with the European industry, for<br />
example, posting a quarterly increase of 3.2% (after +1.5% in<br />
Q3).<br />
Outlook: 2011 looks good<br />
Ev<strong>en</strong> so, European chemical production has not caught up to<br />
its pre-crisis level. At its curr<strong>en</strong>t rate, it will achieve this during<br />
2012. The European Chemical Industry Council (CEFIC) has<br />
revised its 2011 growth forecast for the European chemical<br />
sector upwards to 4.5% by volume, against an initial forecast of<br />
below 3%, boosting our forecast for world market growth to 7%.<br />
The impact of a pot<strong>en</strong>tial upward drift in material input costs –<br />
in the first place, oil – would seem to weigh less than before on<br />
the margins of the major players in the sector. Acting on the<br />
lessons of the past crisis, they have become key players in<br />
certain fields, gaining positions where they can resist calls<br />
from their customers to cut prices. _ML<br />
Major world chemicals groups<br />
Rank Company Nationality Turnover 2010 Change<br />
USD billions 2010/2009<br />
1 BASF Germany 85 20%<br />
2 Dow Chemical USA 54 20%<br />
3 Lyondellbasell (*) USA / Luxembourg 41 34%<br />
4 Sabic Saudi Arabia 41 47%<br />
6 Dupont de Nemours USA 32 21%<br />
7 Ineos (**) UK 31 22%<br />
8 Bayer Germany 24 15%<br />
9 Mitsubishi Chemical Japan 21 -11%<br />
10 Akzo Nobel Netherlands 19 7%<br />
(*)<br />
Basis not comparable (**) Estimates<br />
Source: Companies<br />
World chemical production, by region<br />
Zone 2010 2000<br />
European Union 24% 32%<br />
North America 21% 28%<br />
Asia (excl. Japan and China) 16% 13%<br />
Japan 6% 12%<br />
China 22% 6%<br />
Latin America 5% 4%<br />
Rest of world 6% 5%<br />
Source: Cefic Chemdata<br />
14