Opus Group Annual 2011 Report ENG
Opus Group Annual 2011 Report ENG
Opus Group Annual 2011 Report ENG

Create successful ePaper yourself
Turn your PDF publications into a flip-book with our unique Google optimized e-Paper software.
24<br />
OPUS <strong>2011</strong><br />
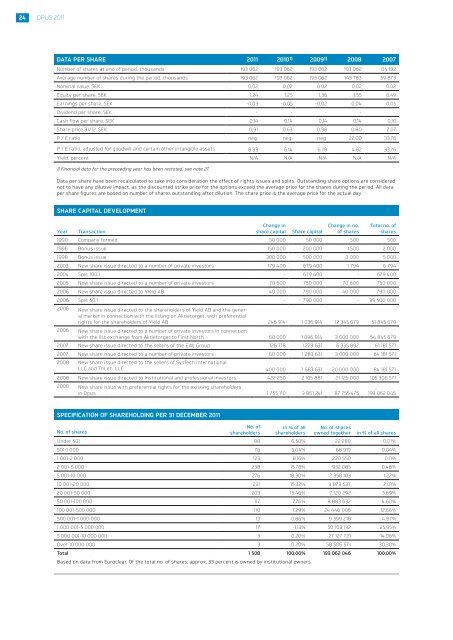
DATA PER SHARE <strong>2011</strong> 2010 1) 2009 1) 2008 2007<br />
Number of shares at end of period, thousands 193 062 193 062 193 062 193 062 64 182<br />
Average number of shares during the period, thousands 193 062 193 062 193 062 143 783 59 873<br />
Nominal value, SEK 0,02 0,02 0,02 0,02 0,02<br />
Equity per share, SEK 1,24 1,25 1,36 1,55 0,49<br />
Earnings per share, SEK -0,03 -0,05 -0,02 0,04 0,05<br />
Dividend per share, SEK - - - - -<br />
Cash flow per share, SEK 0,14 0,14 0,14 0,14 0,10<br />
Share price 31/12, SEK 0,91 0,63 0,98 0,80 2,07<br />
P / E ratio neg. neg. neg. 22,00 33,76<br />
P / E ratio, adjusted for goodwill and certain other intangible assets 8,33 6,14 6,78 4,82 33,76<br />
Yield, percent N/A N/A N/A N/A N/A<br />
1) Financial data for the preceeding year has been restated, see note 27.<br />
Data per share have been recalculated to take into consideration the effect of rights issues and splits. Outstanding share options are considered<br />
not to have any dilutive impact, as the discounted strike price for the options exceed the average price for the shares during the period. All data<br />
per share figures are based on number of shares outstanding after dilution. The share price is the average price for the actual day<br />
SHARE CAPITAL DEVELOPMENT<br />
Year Transaction<br />
Change in<br />
share capital Share capital<br />
Change in no.<br />
of shares<br />
Total no. of<br />
shares<br />
1990 Company formed 50 000 50 000 500 500<br />
1996 Bonus issue 150 000 200 000 1 500 2 000<br />
1998 Bonus issue 300 000 500 000 3 000 5 000<br />
2003 New share issue directed to a number of private investors 179 400 679 400 1 794 6 794<br />
2004 Split 100:1 - 679 400 - 679 400<br />
2005 New share issue directed to a number of private investors 70 600 750 000 70 600 750 000<br />
2006 New share issue directed to Yield AB 40 000 790 000 40 000 790 000<br />
2006 Split 50:1 - 790 000 - 39 500 000<br />
2006 New share issue directed to the shareholders of Yield AB and the general<br />
market in connection with the listing on Aktietorget, with preferential<br />
rights for the shareholders of Yield AB 246 914 1 036 914 12 345 679 51 845 679<br />
2006 New share issue directed to a number of private investors in connection<br />
with the list exchange from Aktietorget to First North 60 000 1 096 914 3 000 000 54 845 679<br />
2007 New share issue directed to the sellers of the EWJ <strong>Group</strong> 126 718 1 223 631 6 335 892 61 181 571<br />
2007 New share issue directed to a number of private investors 60 000 1 283 631 3 000 000 64 181 571<br />
2008 New share issue directed to the sellers of SysTech International,<br />
LLC and TriLen, LLC 400 000 1 683 631 20 000 000 84 181 571<br />
2008 New share issue directed to institutional and professional investors 422 250 2 105 881 21 125 000 105 306 571<br />
2008 New share issue with preferential rights for the existing shareholders<br />
in <strong>Opus</strong> 1 755 110 3 861 241 87 755 475 193 062 046<br />
SPECIFICATION OF SHAREHOLDING PER 31 DECEMBER <strong>2011</strong><br />
No. of<br />
shareholders<br />
in % of all<br />
shareholders<br />
No. of shares<br />
owned together<br />
No. of shares<br />
in % of all shares<br />
Under 501 98 6,50% 22 280 0,01%<br />
501-1 000 76 5,04% 68 919 0,04%<br />
1 001-2 000 123 8,16% 220 550 0,11%<br />
2 001-5 000 238 15,78% 932 085 0,48%<br />
5 001-10 000 276 18,30% 2 358 103 1,22%<br />
10 001-20 000 231 15,32% 3 873 537 2,01%<br />
20 001-50 000 203 13,46% 7 120 292 3,69%<br />
50 001-100 000 117 7,76% 8 883 632 4,60%<br />
100 001-500 000 110 7,29% 24 446 006 12,66%<br />
500 001-1 000 000 13 0,86% 9 399 218 4,87%<br />
1 000 001-5 000 000 17 1,13% 50 103 132 25,95%<br />
5 000 001-10 000 000 3 0,20% 27 127 721 14,06%<br />
Över 10 000 000 3 0,20% 58 506 571 30,30%<br />
Total 1 508 100,00% 193 062 046 100,00%<br />
Based on data from Euroclear. Of the total no. of shares, approx. 33 percent is owned by institutional owners.