Opus Group Annual 2011 Report ENG
Opus Group Annual 2011 Report ENG
Opus Group Annual 2011 Report ENG

Create successful ePaper yourself
Turn your PDF publications into a flip-book with our unique Google optimized e-Paper software.
44<br />
OPUS <strong>2011</strong><br />
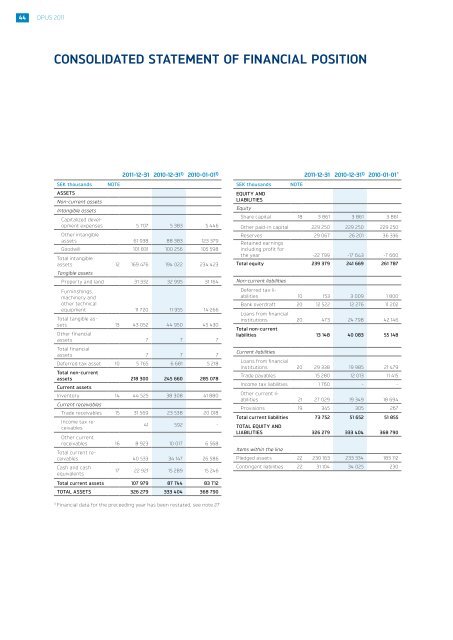
CONSOLIDATED STATEMENT OF FINANCIAL POSITION<br />
SEK thousands<br />
ASSETS<br />
NOTE<br />
<strong>2011</strong>-12-31 2010-12-31 1) 2010-01-01 1)<br />
Non-current assets<br />
Intangible assets<br />
Capitalized development<br />
expenses 5 707 5 383 5 446<br />
Other intangible<br />
assets 61 938 88 383 123 379<br />
Goodwill 101 831 100 256 105 598<br />
Total intangible<br />
assets 12 169 476 194 022 234 423<br />
Tangible assets<br />
Property and land 31 332 32 995 31 164<br />
Furninshings,<br />
machinery and<br />
other technical<br />
equipment 11 720 11 955 14 266<br />
Total tangible assets<br />
13 43 052 44 950 45 430<br />
Other financial<br />
assets 7 7 7<br />
Total financial<br />
assets 7 7 7<br />
Deferred tax asset 10 5 765 6 681 5 218<br />
Total non-current<br />
assets 218 300 245 660 285 078<br />
Current assets<br />
Inventory 14 44 525 38 308 41 880<br />
Current receivables<br />
Trade receivables 15 31 569 23 538 20 018<br />
Income tax receivables<br />
41 592 -<br />
Other current<br />
receivables 16 8 923 10 017 6 568<br />
Total current receivables<br />
40 533 34 147 26 586<br />
Cash and cash<br />
equivalents<br />
17 22 921 15 289 15 246<br />
Total current assets 107 979 87 744 83 712<br />
TOTAL ASSETS 326 279 333 404 368 790<br />
SEK thousands<br />
<strong>2011</strong>-12-31 2010-12-31 1) 2010-01-01 1)<br />
NOTE<br />
EQUITY AND<br />
LIABILITIES<br />
Equity<br />
Share capital 18 3 861 3 861 3 861<br />
Other paid-in capital 229 250 229 250 229 250<br />
Reserves 29 067 26 201 36 336<br />
Retained earnings<br />
including profit for<br />
the year -22 799 -17 643 -7 660<br />
Total equity 239 379 241 669 261 787<br />
Non-current liabilities<br />
Deferred tax liabilities<br />
10 153 3 009 1 800<br />
Bank overdraft 20 12 522 12 276 11 202<br />
Loans from financial<br />
institutions 20 473 24 798 42 146<br />
Total non-current<br />
liabilities 13 148 40 083 55 148<br />
Current liabilities<br />
Loans from financial<br />
institutions 20 29 338 19 985 21 479<br />
Trade payables 15 280 12 013 11 415<br />
Income tax liabilities 1 760 - -<br />
Other current liabilities<br />
21 27 029 19 349 18 694<br />
Provisions 19 345 305 267<br />
Total current liabilities 73 752 51 652 51 855<br />
TOTAL EQUITY AND<br />
LIABILITIES 326 279 333 404 368 790<br />
Items within the line<br />
Pledged assets 22 230 163 233 334 183 112<br />
Contingent liabilities 22 31 104 34 025 230<br />
1)<br />
Financial data for the preceeding year has been restated, see note 27