Opus Group Annual 2011 Report ENG
Opus Group Annual 2011 Report ENG
Opus Group Annual 2011 Report ENG

Create successful ePaper yourself
Turn your PDF publications into a flip-book with our unique Google optimized e-Paper software.
28<br />
OPUS <strong>2011</strong><br />
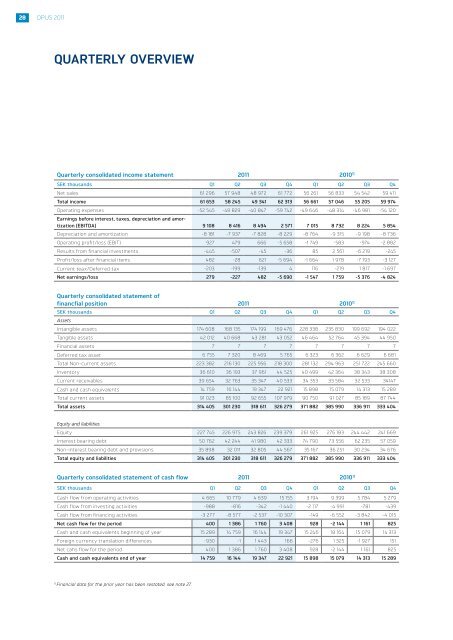
QUARTERLY OVERVIEW<br />
Quarterly consolidated income statement <strong>2011</strong> 2010 1)<br />
SEK thousands Q1 Q2 Q3 Q4 Q1 Q2 Q3 Q4<br />
Net sales 61 296 57 948 48 972 61 772 56 261 56 833 54 542 59 411<br />
Total income 61 653 58 245 49 341 62 313 56 661 57 046 55 205 59 974<br />
Operating expenses -52 545 -49 829 -40 847 -59 742 -49 646 -48 314 -46 981 -54 120<br />
Earnings before interest, taxes, depreciation and amortization<br />
(EBITDA) 9 108 8 416 8 494 2 571 7 015 8 732 8 224 5 854<br />
Depreciation and amortization -8 181 -7 937 -7 828 -8 229 -8 764 -9 315 -9 198 -8 736<br />
Operating profit/loss (EBIT) 927 479 666 -5 658 -1 749 -583 -974 -2 882<br />
Results from financial investments -445 -507 -45 -36 85 2 561 -6 219 -245<br />
Profit/loss after financial items 482 -28 621 -5 694 -1 664 1 978 -7 193 -3 127<br />
Current teax/Deferred tax -203 -199 -139 4 116 -219 1 817 -1 697<br />
Net earnings/loss 279 -227 482 -5 690 -1 547 1 759 -5 376 -4 824<br />
Quarterly consolidated statement of<br />
financfial position <strong>2011</strong> 2010 1)<br />
SEK thousands Q1 Q2 Q3 Q4 Q1 Q2 Q3 Q4<br />
Assets<br />
Intangible assets 174 608 168 135 174 199 169 476 228 338 235 830 199 692 194 022<br />
Tangible assets 42 012 40 668 43 281 43 052 46 464 52 764 45 394 44 950<br />
Financial assets 7 7 7 7 7 7 7 7<br />
Deferred tax asset 6 755 7 320 8 469 5 765 6 323 6 362 6 629 6 681<br />
Total Non-current assets 223 382 216 130 225 956 218 300 281 132 294 963 251 722 245 660<br />
Inventory 36 610 36 193 37 961 44 525 40 499 42 364 38 343 38 308<br />
Current receivables 39 654 32 763 35 347 40 533 34 353 33 584 32 533 34147<br />
Cash and cash equivalents 14 759 16 144 19 347 22 921 15 898 15 079 14 313 15 289<br />
Total current assets 91 023 85 100 92 655 107 979 90 750 91 027 85 189 87 744<br />
Total assets 314 405 301 230 318 611 326 279 371 882 385 990 336 911 333 404<br />
Equity and liabilities<br />
Equity 227 745 226 975 243 826 239 379 261 925 276 183 244 442 241 669<br />
Interest bearing debt 50 762 42 244 41 980 42 333 74 790 73 556 62 235 57 059<br />
Non-interest bearing debt and provisions 35 898 32 011 32 805 44 567 35 167 36 251 30 234 34 676<br />
Total equity and liabilities 314 405 301 230 318 611 326 279 371 882 385 990 336 911 333 404<br />
Quarterly consolidated statement of cash flow <strong>2011</strong> 2010 1)<br />
SEK thousands Q1 Q2 Q3 Q4 Q1 Q2 Q3 Q4<br />
Cash flow from operating activities 4 665 10 779 4 639 15 155 3 194 9 399 5 784 5 279<br />
Cash flow from investing activities -988 -816 -342 -1 440 -2 117 -4 991 -781 -439<br />
Cash flow from financing activities -3 277 -8 577 -2 537 -10 307 -149 -6 552 -3 842 -4 015<br />
Net cash flow for the period 400 1 386 1 760 3 408 928 -2 144 1 161 825<br />
Cash and cash equivalents beginning of year 15 289 14 759 16 144 19 347 15 246 18 164 15 079 14 313<br />
Foreign currency translation differences -930 -1 1 443 166 -276 1 325 -1 927 151<br />
Net cahs flow for the period 400 1 386 1 760 3 408 928 -2 144 1 161 825<br />
Cash and cash equivalents end of year 14 759 16 144 19 347 22 921 15 898 15 079 14 313 15 289<br />
1)<br />
Financial data for the prior year has been restated, see note 27.