Image Enhancement for Impaired Vision: The challenge of evaluation
Image Enhancement for Impaired Vision: The challenge of evaluation
Image Enhancement for Impaired Vision: The challenge of evaluation

You also want an ePaper? Increase the reach of your titles
YUMPU automatically turns print PDFs into web optimized ePapers that Google loves.
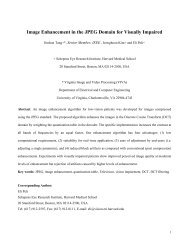
<strong>Image</strong> <strong>Enhancement</strong> <strong>for</strong> <strong>Impaired</strong> <strong>Vision</strong>: <strong>The</strong> Challenge <strong>of</strong> Evaluation<br />
Eli Peli<br />
<strong>The</strong> Schepens Eye Research Institute, Department <strong>of</strong> Ophthalmology, Harvard Medical School,<br />
Boston, MA, USA<br />
eli.peli@schepens.harvard.edu<br />
With the aging <strong>of</strong> the population, the prevalence <strong>of</strong> eye diseases and thus <strong>of</strong> vision impairment is increasing. <strong>The</strong> TV watching<br />
habits <strong>of</strong> people with vision impairments are comparable to normally sighted people [1], however their vision loss prevents<br />
them from fully benefiting from this medium. For over 20 years we have been developing video image-enhancement<br />
techniques designed to assist people with visual impairments, particularly those due to central retinal vision loss. A major<br />
difficulty in this endeavor is the lack <strong>of</strong> <strong>evaluation</strong> techniques to assess and compare the effectiveness <strong>of</strong> various enhancement<br />
methods. This paper reviews our approaches to image enhancement and the results we have obtained, with special emphasis on<br />
the difficulties encountered in the <strong>evaluation</strong> <strong>of</strong> the benefits <strong>of</strong> enhancement and the solutions we have developed to date.<br />
<strong>The</strong> pre-emphasis model<br />
In our linear pre-emphasis model [2, 3], the loss <strong>of</strong> contrast sensitivity due to vision loss (which usually affect higher spatial<br />
frequencies more that lower frequencies [4]) is modeled as low pass filtering <strong>of</strong> the displayed image (Fig. 1). To counteract<br />
this effect, the displayed image is pre-emphasized by enhancing the higher frequencies be<strong>for</strong>e displaying the image [2].<br />
However, due to constrains imposed by the display’s dynamic range, only a moderate level <strong>of</strong> enhancement is possible.<br />
Further enhancement results in grey scale saturation [5, 6] and distortions. In addition, enhancement <strong>of</strong> high spatial frequencies<br />
beyond vision limits will not have any effect, and enhancement <strong>of</strong> low spatial frequencies that viewers can readily see does not<br />
bring any perception benefit. <strong>The</strong>re<strong>for</strong>e, enhancement <strong>of</strong> a limited band <strong>of</strong> frequencies that viewers otherwise would not be able<br />
to see is preferable. A number <strong>of</strong> enhancement techniques we have developed are summarized here, followed by reports <strong>of</strong> our<br />
<strong>evaluation</strong> studies. <strong>The</strong> <strong>challenge</strong> <strong>of</strong> evaluating image enhancement is the central theme <strong>of</strong> this paper.<br />
Fig 1. <strong>The</strong> pre-emphasis model. <strong>The</strong> pre-emphasis filter designed to<br />
neutralize the effect <strong>of</strong> the low vision filter is applied to the displayed<br />
image prior to presentation. Dynamic range limits <strong>of</strong> the display<br />
restrict the direct application <strong>of</strong> the model.<br />
TV<br />
<strong>Image</strong><br />
1.<br />
c/deg<br />
High Freq.<br />
Enhanced<br />
Pre-emphasized<br />
Displayed<br />
Viewed<br />
1.<br />
c/deg<br />
Low-<strong>Vision</strong><br />
Low-pass<br />
Perception
<strong>Enhancement</strong> Methods<br />
1. Adaptive enhancement<br />
<strong>The</strong> adaptive enhancement algorithm [7] that can enhance a tuned range <strong>of</strong> frequencies and can reduce saturation by reducing<br />
low frequencies was implemented, and tested first in s<strong>of</strong>tware <strong>for</strong> static monochrome images [2, 4] and then in hardware <strong>for</strong><br />
motion color video [8, 9]. Results <strong>of</strong> enhancement are illustrated in Fig. 2 <strong>for</strong> a frame taken from a video processed in real time<br />
using the Digi<strong>Vision</strong> CE-3000 device and in Fig. 3b as computed <strong>for</strong> static monochrome images.<br />
Fig. 2. (a) <strong>The</strong> original, unenhanced video frame<br />
and (b) A video frame enhanced using the<br />
Digi<strong>Vision</strong> CE-3000 device. Note the moderate<br />
level <strong>of</strong> enhancement and changes in local<br />
luminance (particularly on the trouser leg) that<br />
permit greater enhancement <strong>of</strong> high frequency<br />
details (such as the folds in the material) a b<br />
2. Adaptive thresholding<br />
Adaptive or local thresholding that results in binary images is not commonly considered as an enhancement technique, but may<br />
serve as such especially <strong>for</strong> the visually impaired. <strong>The</strong> binary image has inherent high contrast and if it maintains the relevant<br />
image's in<strong>for</strong>mation in a satisfactory way, it may be useful as an enhancement technique.<br />
Adaptive thresholding changes the threshold applied across the image as a function <strong>of</strong> local image properties [10, 11]. <strong>The</strong> size<br />
<strong>of</strong> the local neighborhood used in processing the local properties determines the range <strong>of</strong> spatial frequencies that are enhanced<br />
by the adaptive thresholding. An example <strong>of</strong> a face image enhanced with adaptive thresholding is shown in Fig. 3c. While the<br />
face is clearly recognizable, the severe distortion caused by the enhancement is apparent and is noted by the patients.<br />
Fig. 3. (a) A celebrity face image unenhanced.<br />
(b) <strong>The</strong> adaptive enhancement <strong>of</strong> the image in<br />
a. (c) <strong>The</strong> adaptive thresholding enhancement<br />
<strong>of</strong> the same image.<br />
a b c<br />
An early head mounted displays (HMDs) system, the Private Eye, was a binary display device that used scanning red LEDs to<br />
<strong>for</strong>m the image [12]. We adapted it as a portable low vision image enhancement aid. To reduce the cost, weight, and power<br />
consumption, a one dimensional (1-D) analog video processing alternative was designed and implemented [13]. However, this<br />
approach was never <strong>for</strong>mally tested to demonstrate its effectiveness since there was no clear way to assess the value <strong>of</strong> such<br />
system <strong>for</strong> mobility.
3. Tuning the enhancement individually<br />
In both adaptive enhancement and adaptive thresholding, the band <strong>of</strong> spatial frequencies being enhanced can be selected and<br />
there<strong>for</strong>e may be adjusted <strong>for</strong> an individual user. <strong>The</strong> gain <strong>of</strong> the adaptive enhancement may be tuned as well. <strong>The</strong> preemphasis<br />
model suggests that better results might be achieved with individual tuning <strong>of</strong> the band. <strong>The</strong> significant and<br />
substantial increased face recognition <strong>for</strong> about half the patients we achieved with uni<strong>for</strong>mly applied enhancement [4] suggests<br />
that tuning <strong>of</strong> the enhancement may result in even better results. <strong>The</strong> value <strong>of</strong> tuning is even more difficult to determine than<br />
the benefit <strong>of</strong> the enhancement. As a result <strong>of</strong> these difficulties and various other considerations relating to the effect <strong>of</strong><br />
bandwidth <strong>of</strong> stimuli on visual function (especially in the peripheral visual field), we have developed and evaluated the use <strong>of</strong><br />
wideband enhancement [14].<br />
4. Wideband <strong>Enhancement</strong><br />
<strong>The</strong> wideband image enhancement consists <strong>of</strong> locating visually relevant features in the image (edges and bars) and enhancing<br />
the contrast <strong>of</strong> the pixels <strong>of</strong> such features [14]. <strong>The</strong> edge detection algorithm used <strong>for</strong> the wideband enhancement is a dual<br />
polarity edge detector based on a vision model [15] (Fig. 4). This algorithm marks “edge” features with dual polarity pairs <strong>of</strong><br />
bright and dark lines with the bright line on the bright side <strong>of</strong> the edge and the dark line on the dark side <strong>of</strong> the edge. Thin<br />
“bar” features are represented with a single, appropriate polarity line at the location <strong>of</strong> the bar. <strong>The</strong> feature’s outlines detected<br />
by the algorithm may be used to enhance the visibility <strong>of</strong> the features they underlie. Bright and dark lines can replace<br />
(substitute) the original pixels values at their corresponding locations or they can be added (subtracted <strong>for</strong> dark lines) to the<br />
original pixels’ values. In both cases the outline magnitudes can be fixed or variable. Following a set <strong>of</strong> pilot experiments we<br />
selected a process whereby outlines detected in the image were added to the original image at their locations but were scaled in<br />
magnitude according to the strength <strong>of</strong> the feature at the location.<br />
We have also proposed the use <strong>of</strong> the wideband enhancement in a see-through HMD as a way to provide augmented vision –<br />
by enhancing the view <strong>of</strong> the real world. In this application only unipolar (white) edges can be used as it is not possible to<br />
implement a black edge on the optical see-through display. It is critical in this application to achieve accurate registration<br />
between the natural view seen through the display and the edge images presented on the display. We, there<strong>for</strong>e, have developed<br />
and evaluated (in conjunction with MicroOptical Inc) a system in which the same optical path is used <strong>for</strong> the camera acquiring<br />
the images and <strong>for</strong> the display presenting the edges derived from it. While we were able to achieve the required registration<br />
[16], the brightness <strong>of</strong> the edges that could be achieved with the existing LCD display technology was insufficient to provide a<br />
beneficial enhancement effect. Other emerging technologies may provide better alternatives.
a<br />
b<br />
Fig. 4. Wideband enhancement. (a) Bipolar features (edges and bars) detected from the original image are scaled<br />
according to the strength <strong>of</strong> the feature. (b) <strong>The</strong> bipolar features added to the original image. Note the white line on the<br />
woman’s left arm. <strong>The</strong> features brightness can be adjusted to increase or decrease the level <strong>of</strong> enhancement.<br />
5. <strong>Enhancement</strong> <strong>of</strong> Compressed Video<br />
<strong>The</strong> approaches described above were based on the filtering <strong>of</strong> analog (uncompressed) video. However, the use <strong>of</strong> digital video<br />
products applying MPEG compression, such as digital televisions, DVD players, and digital camcorders, is rapidly expanding.<br />
Techniques <strong>for</strong> video enhancement to aid visually impaired people must there<strong>for</strong>e evolve to be compatible with the new digital<br />
media <strong>for</strong>mats. Enhancing MPEG compressed images <strong>of</strong>ten results in significant block artifacts which become visible <strong>for</strong> both<br />
normally sighted and visually impaired audiences; and pre-compression enhancement is impractical and defeats the<br />
compression ef<strong>for</strong>ts. We consequently developed an MPEG-based video enhancement that operates during the decompression<br />
stage [17-19]. This approach reduces the appearance <strong>of</strong> block artifacts and efficiently uses the decompression infrastructure.<br />
Our MPEG-based enhancement is based on the discrete cosine trans<strong>for</strong>m (DCT) and the quantization matrix <strong>of</strong> the JPEG aspect<br />
<strong>of</strong> the MPEG standard. <strong>The</strong> properties <strong>of</strong> the DCT provide a very natural way <strong>for</strong> defining spatial frequency filters in the<br />
frequency domain. Within the 8×8 block commonly used in MPEG and JPEG coding; the top-left function represents the "DC"<br />
or zero spatial frequency, along the top row the basis functions increase in horizontal spatial frequency, down the left column<br />
the functions increase in vertical spatial frequency, and along the diagonals there is an increase in both horizontal and vertical<br />
frequencies.<br />
As set by the pre-emphasis model, effective image enhancement requires increasing the contrast in a specific range <strong>of</strong><br />
frequencies. Applying filtering in the DCT domain can be achieved within the MPEG decompression stage by manipulating<br />
the Q matrices available in the sequence header (there are two different Q matrices — Intra and Inter matrices — with different<br />
values <strong>for</strong> quantization <strong>of</strong> still and moving macroblocks). In our enhancement approach, both the Intra and Inter Q matrices are<br />
multiplied, point-by-point, with pre-designed Intra and Inter enhancement filter arrays to obtain the modified Q matrices. This<br />
technique only requires access to the Inter and Intra quantization matrices being decoded from the header, and the ability to<br />
multiply them with the enhancement filter arrays.
We implemented this approach first with static images using custom programming <strong>of</strong> the JPEG decompression stage [18]. In<br />
that first study we applied a uni<strong>for</strong>m enhancement factor at all frequencies (wideband enhancement). We later used the same<br />
approach <strong>for</strong> band-limited filtering applied to MPEG video test sequences with the MPEG s<strong>of</strong>tware decoder [20]. <strong>The</strong> test<br />
sequences were processed <strong>of</strong>f line and numerous versions with varying parameter settings were pre-prepared and stored on disk<br />
<strong>for</strong> testing [19]. Most recently the post transmission enhancement was integrated into an “open source” MPEG player that<br />
could process the video and adjust the parameter <strong>for</strong> live video fed from any MPEG source [21]. <strong>The</strong> flexibility <strong>of</strong> this system<br />
enabled improvement <strong>of</strong> the enhancement algorithm and development <strong>of</strong> reduction <strong>of</strong> interlacing artifacts (Fig 5).<br />
a<br />
b<br />
c<br />
d<br />
e<br />
Fig. 5. Illustration <strong>of</strong> ringing artifacts and their reduction in the MPEG enhancement [21]. (a) Unenhanced section <strong>of</strong> a<br />
movie frame with text. (b) Text is particularly prone to ringing artifacts caused by enhancement that is limited to a band <strong>of</strong><br />
frequencies in the DCT block. (c) Our recent filtering techniques have substantially reduced these ringing artifacts without<br />
reducing the contrast enhancement effect. (d) Curved edges appear ‘jagged’ when ringing artifacts are caused by the DCT<br />
filtering. (e) <strong>The</strong> more recent filtering applied has reduced these artifacts.<br />
Evaluation Methods and Results<br />
1. Evaluation using simulations <strong>of</strong> vision loss<br />
<strong>The</strong> potential benefit <strong>of</strong> the adaptive enhancement <strong>for</strong> visually impaired was evaluated first using photographic simulation <strong>of</strong><br />
the effect <strong>of</strong> cataracts [2]. <strong>The</strong> original images and the enhanced images were photographed with a camera that was rendered<br />
cataractous by dubbing Vaseline on the camera lens with the finger. This treatment had been shown to be a good simulation <strong>of</strong><br />
the optical effect <strong>of</strong> cataract in the eye [22]. This simulation <strong>of</strong> cataracts actually imposed a linear optical filter and thus it is<br />
not surprising that the pre-emphasis approach was effective and the simulations were judged promising [2].<br />
Later we evaluated the Adaptive <strong>Enhancement</strong> and the Adaptive Thresholding using computational simulations <strong>of</strong> the loss <strong>of</strong><br />
vision [4]. Two types <strong>of</strong> simulations were applied; a linear filtering (cataract), and a non linear processing approach that<br />
directly implements the threshold non-linearity <strong>of</strong> the human contrast detection system [23]. <strong>The</strong> latter was aimed at simulating<br />
the loss <strong>of</strong> contrast sensitivity in the retinal periphery which might represent the visual function <strong>of</strong> patients with central field<br />
loss (CFL) due to age-related macular degeneration (AMD) and other diseases that damage the fovea. <strong>The</strong> validity <strong>of</strong> these
simulations <strong>for</strong> both central foveal vision [24, 25] and peripheral vision [4] was confirmed experimentally. <strong>The</strong> simulations<br />
were again promising as judged in a side-by-side comparison <strong>of</strong> the results <strong>of</strong> simulating the degraded vision with and without<br />
the enhancement <strong>of</strong> the image. While such side-by-side visual comparison is a frequently practiced approach to assess the<br />
value <strong>of</strong> image processing techniques and image enhancement in particular, its value is clearly limited (see ref [26] <strong>for</strong> review).<br />
Simulation, nevertheless, could be a valuable tool in the process <strong>of</strong> developing enhancement algorithms and could be <strong>of</strong> benefit<br />
in initial testing and parameter settings. However, a direct testing <strong>of</strong> the effect <strong>of</strong> enhancement in people with impaired vision<br />
is essential in order to prove the benefit <strong>of</strong> the approach and <strong>of</strong> any specific technique.<br />
2. Evaluation <strong>of</strong> per<strong>for</strong>mance<br />
Intuitively it appears that if image enhancement is effective it should improve the ability <strong>of</strong> the person with visual impairment<br />
to per<strong>for</strong>m certain visual tasks. <strong>The</strong> same approach is or should be true <strong>for</strong> some applications <strong>of</strong> image enhancement, e.g.<br />
medical images. Specifying relevant task per<strong>for</strong>mance to be tested is relatively straight<strong>for</strong>ward <strong>for</strong> medical imaging. Usually it<br />
is a detection per<strong>for</strong>mance on some diagnostic imaging test. With a ground truth that may be established using biopsies or<br />
follow up, the ability to diagnose (i.e., correctly detect or identify lesion) using the original radiology image or the enhanced<br />
image can be compared. When the state <strong>of</strong> such <strong>evaluation</strong>s was reviewed [26], there was little indication in the literature that<br />
image enhancement had improved diagnostic per<strong>for</strong>mance. This was perhaps due to the excellent ability <strong>of</strong> the normal visual<br />
system to use high quality displays to retrieve all necessary in<strong>for</strong>mation from the original image. However, when a visually<br />
impaired system is used there is clearly a loss <strong>of</strong> in<strong>for</strong>mation, which potentially may be recovered, at least in part, with the help<br />
<strong>of</strong> image enhancement.<br />
<strong>The</strong> main difficulty in applying the same approach to assess the benefits <strong>of</strong> image enhancement to television viewing by people<br />
with vision impairment is the lack <strong>of</strong> clearly defined tasks to be evaluated. <strong>The</strong> difficult question is: how to define and<br />
qualify/quantify the task per<strong>for</strong>med while viewing TV <strong>for</strong> pleasure and how would we measure the person’s per<strong>for</strong>mance?<br />
a. Evaluation <strong>of</strong> per<strong>for</strong>mance with static images: Face recognition<br />
One <strong>of</strong> the most frequent complaints <strong>of</strong> visually impaired patients is the reduced ability to recognize faces both on TV and in<br />
real life. In daily life such failures may lead to embarrassing social interactions, and in TV viewing failing to recognize a<br />
person in a scene may affect the patient’s ability to follow the story line. We there<strong>for</strong>e first used face recognition tasks in<br />
investigating the effects <strong>of</strong> image enhancement [4, 6]. Sergent [27] reported that although low frequencies convey most <strong>of</strong> the<br />
relevant in<strong>for</strong>mation <strong>for</strong> face processing, high frequency in<strong>for</strong>mation is not redundant. High frequencies seem to benefit the<br />
per<strong>for</strong>mance <strong>of</strong> tasks that require accessing the identity <strong>of</strong> a face as compared with discriminating among a small sample <strong>of</strong><br />
face images. We chose celebrities’ face recognition, a task that has been shown to be more robust than the recognition <strong>of</strong>
unfamiliar faces [28]. But as we found, it is not trivial to determine who is a celebrity and that ground truth needs to be<br />
established <strong>for</strong> the population under test or <strong>for</strong> each subject. For one population we tested (Americans with normal vision older<br />
than age 60 in the late 1980s), Mick Jagger was not recognized by anyone while Johnny Carson was recognized by all.<br />
Forty patients with CFL in one eye (VA worse than 20/70) due to macular disease participated in the celebrities’ face<br />
recognition study [4]. All had VA better than 20/40 in the good eye that was used to verify the familiarity with the celebrities.<br />
Twenty-one <strong>of</strong> these patients were tested with the adaptive enhancement technique and nineteen with the adaptive thresholding.<br />
Photographs <strong>of</strong> 50 celebrities and 40 unfamiliar people were presented. Monochrome grayscale images digitized at a resolution<br />
<strong>of</strong> 256x256 and at 256 gray levels spanned 4x4deg at the viewing distance. <strong>The</strong> images were enhanced with the Adaptive<br />
<strong>Enhancement</strong> algorithm and the Adaptive Thresholding technique using the same parameters applied <strong>for</strong> the simulations<br />
<strong>evaluation</strong>. Only one <strong>of</strong> the enhancement techniques was used <strong>for</strong> each subject. Original (unenhanced) and enhanced images<br />
(180 in total) were presented in random order. Subjects indicated their level <strong>of</strong> confidence, on a scale <strong>of</strong> 1 to 6, in recognizing<br />
the face as that <strong>of</strong> a celebrity. A rating <strong>of</strong> 1 meant that the subject was positive that the face belonged to a celebrity; 6 meant<br />
that the face was clear but not recognized. Celebrities that were not recognized in both enhanced and unenhanced modes were<br />
presented to the patient's better eye. If the patient could not recognize a particular celebrity with his good eye that celebrity was<br />
reclassified as an unfamiliar person <strong>for</strong> the patient.<br />
Celebrity detector ROC<br />
Receiver operating curves (ROCs) plotting the probability <strong>of</strong> true celebrity vs. the probability <strong>of</strong> false celebrity were<br />
constructed from the responses, treating the patients as celebrity detectors. Separate curves were calculated <strong>for</strong> original and<br />
enhanced images. Because the same faces were presented in both <strong>for</strong>ms, a correlated ROC analysis [29] was conducted. <strong>The</strong><br />
area under the ROC (Az) was taken as a measure <strong>of</strong> recognition [30]. Note that this is a standard application <strong>of</strong> the ROC<br />
technique which requires the establishment <strong>of</strong> the ground-truth (true celebrity in this case). <strong>The</strong> ROC curves <strong>for</strong> one patient are<br />
shown in Fig 6.<br />
Most <strong>of</strong> the patients (33 out <strong>of</strong> 40) demonstrated improved face recognition with the enhanced images as compared with the<br />
original, unenhanced images. <strong>The</strong> difference between the two areas under the ROC curves indicated a statistically significant<br />
(p
improvement measure as the ratio <strong>of</strong> areas under the curves (Az(enhanced)/Az(original)). Results <strong>of</strong> the 21 patients in Adaptive<br />
<strong>Enhancement</strong> group as well as the maximal possible improvement shown in Fig 7.<br />
Fig. 6. ROC curves <strong>for</strong> a patient who per<strong>for</strong>ms much better as a<br />
celebrity detector with the Adaptive <strong>Enhancement</strong>. <strong>The</strong> data points<br />
were derived directly from the patient’s response. First data point on<br />
the left was calculated from responses <strong>of</strong> confidence level 1, and the<br />
other data points were cumulative probabilities. <strong>The</strong> lines represent<br />
the ROC fittings to these data points. In this case the difference<br />
between the two curves was statistically significant.<br />
Fig. 7. Improvement in face recognition <strong>of</strong> patients with CFL with<br />
the Adaptive <strong>Enhancement</strong> as a function <strong>of</strong> per<strong>for</strong>mance without<br />
enhancement. Open triangles represent subjects with CFL that<br />
improved their per<strong>for</strong>mance significantly with the enhancement.<br />
Filled triangles represent subjects that had a change in per<strong>for</strong>mance<br />
with the enhancement but the change was not statistically significant.<br />
Only 2 subjects had a decreased per<strong>for</strong>mance with enhancement<br />
(triangles below the midline). Open squares represent the maximum<br />
possible improvement available <strong>for</strong> each level <strong>of</strong> per<strong>for</strong>mance with no<br />
enhancement. For some subjects the improvement approached the<br />
maximal possible improvement.<br />
A normalized measure <strong>of</strong> improved per<strong>for</strong>mance, gain, was calculated as the ratio <strong>of</strong> increase in area under the ROC and<br />
maximal possible increase:<br />
gain = A z(enhanced) - A z (original)<br />
1 - A z(original) (1)<br />
<strong>The</strong> mean gain was 62% <strong>of</strong> the maximal possible improvement <strong>for</strong> the patients that demonstrated a significant improvement<br />
with the Adaptive Enhanced images and 42% <strong>for</strong> the patients that showed significant improvement with the Adaptive<br />
Thresholding. <strong>The</strong>se results were encouraging and demonstrated a meaningful benefit <strong>for</strong> most <strong>of</strong> the patients.
. Evaluation <strong>of</strong> per<strong>for</strong>mance with motion videos<br />
We know <strong>of</strong> no accepted or even suggested method to measure per<strong>for</strong>mance with video sequences. <strong>The</strong> difficulty is inherent to<br />
constantly changing content and image quality in a video sequence. This continuous change makes it difficult to capture a<br />
fleeting task per<strong>for</strong>mance. While in some situations a specific task could be defined (e.g., the detection <strong>of</strong> suspicious object in<br />
passengers’ luggage in airport security scanning system), defining a per<strong>for</strong>mance measure relevant to TV viewing <strong>for</strong> pleasure<br />
or <strong>for</strong> in<strong>for</strong>mation is much more difficult.<br />
Peli et al [31] developed a per<strong>for</strong>mance measure to assess the effectiveness <strong>of</strong> Audio Description (AD) <strong>for</strong> the blind and<br />
visually impaired. AD provides verbal descriptions <strong>of</strong> the visual contents <strong>of</strong> TV programs through the third audio channel<br />
without interfering with the programs’ standard audio portion [32]. Descriptions <strong>of</strong> visual details concerning aspects such as<br />
clothing and colors are inserted during pauses in the dialogue. AD is available on some DVDs and videocassette tapes, on<br />
some public broadcast programs in the USA, and in the United Kingdom. Peli et al [31] constructed questionnaires probing<br />
details described in the AD <strong>of</strong> three public broadcast programs. <strong>The</strong> effect <strong>of</strong> AD was evaluated by addressing these<br />
questionnaires to visually impaired subjects who watched the programs with or without the AD.<br />
We applied the same questionnaires to testing recognition from the video program. We counted the number <strong>of</strong> visual details<br />
that could be correctly identified by subjects with impaired vision in response to the questions after observing either the<br />
original or the enhanced video segments (both played without AD) [9]. Multiple-choice questions were posed after each short<br />
segment. Questions addressed visual details, e.g. "<strong>The</strong> woman has… a) gray hair; b) black hair", that were described by the<br />
original AD prepared <strong>for</strong> this TV program <strong>for</strong> broadcasting on Public Television. <strong>The</strong> video program "Poirot: <strong>The</strong> <strong>The</strong>ft <strong>of</strong> the<br />
Royal Ruby", an episode <strong>of</strong> the Public Broadcast Service show “Mystery!”, was used.<br />
<strong>The</strong> questionnaire consisted <strong>of</strong> 59 questions covering a 10 minute segment <strong>of</strong> the episode. <strong>The</strong> video was paused 17 times, at<br />
proper break points, to administer the AD-based questions. <strong>The</strong> initial condition (either enhanced or unenhanced) was<br />
counterbalanced across subjects. After the 30 th question, the condition was switched. Thus, half the subjects viewed the first<br />
part <strong>of</strong> the segment in the enhanced mode and half the subjects viewed it in the unenhanced mode (Fig. 2). <strong>The</strong> parameters <strong>for</strong><br />
the enhanced condition were the individually-selected enhancement settings (see below).<br />
<strong>The</strong> subjects (n=25) answered 66% <strong>of</strong> the questions correctly when the video was enhanced and 71% when it was presented<br />
with no enhancement. This difference was not statistically significant (paired sample t-test, t 24 =2.04, p=0.053). Note that in<br />
agreement with our previous results [31], the subjects could answer over 70% <strong>of</strong> the questions correctly without enhancement<br />
and without hearing the DVS description, leaving very little room <strong>for</strong> potential improvement and also indicating that the AD<br />
was not appropriate <strong>for</strong> visually impaired people as they could determine 70% <strong>of</strong> its content without it. It is possible that a<br />
more adequate questionnaire (not based on the AD) could be developed to measure TV-watching per<strong>for</strong>mance but it is not
straight<strong>for</strong>ward how to construct such questionnaire. Even if a questionnaire was constructed that could test recognition <strong>of</strong><br />
visual details in the TV program that are missed or not visible to patients with impaired vision, it is not clear that such details<br />
are important or even relevant to the enjoyment or benefit <strong>of</strong> the viewer.<br />
3. Individual Tuning as an Evaluation<br />
If individual patients could tune the enhancement level consistently (in terms <strong>of</strong> spatial frequency, gain, threshold level or any<br />
other parameter) they would be demonstrating a perceived value <strong>of</strong> the enhancement (a dose effect). A number <strong>of</strong> studies were<br />
aimed at examining the effect <strong>of</strong> tuning on the enhancement <strong>for</strong> an individual patient’s visual loss, but a clear benefit from<br />
individual tuning has not been found.<br />
A pilot study using the Digivision CE2000 device found increased recognition <strong>of</strong> details in the videos and almost all (95% <strong>of</strong><br />
the subjects) preferred their individually-selected enhancement [4]. A different study, using a face recognition task, found that<br />
individually-selected enhancement parameters did not improve recognition more than uni<strong>for</strong>m enhancement [6].<br />
A study <strong>of</strong> live video enhanced with the Digi<strong>Vision</strong> device, using fixed enhancement parameters and individually-selected<br />
viewing distance [33], found a statistically significant but relatively small improvement in per<strong>for</strong>mance, and only 20% <strong>of</strong> the<br />
subjects in the study indicated a preference <strong>for</strong> the enhanced images. In another study we explicitly applied a set <strong>of</strong> filters in the<br />
frequency domain to face images (Fig. 8) and thus directly controlled the frequencies that were enhanced as well as the<br />
bandwidth <strong>of</strong> the range <strong>of</strong> frequencies being enhanced [6]. <strong>The</strong> wider bandwidth was achieved by combining two narrow<br />
filters. We showed that the effect <strong>of</strong> a 2-octave wide filter with a gain <strong>of</strong> 5× was very similar to the effect <strong>of</strong> the adaptive<br />
enhancement algorithm applied in the previous study [4]. <strong>The</strong> low pass filtering was applied to determine the critical<br />
frequencies needed <strong>for</strong> face recognition (4-8 cycles/face). Patients selected their preferred enhancements from two pallets <strong>of</strong><br />
4×4 pre-computed images selected by moving a mouse over a graphic tablet (total <strong>of</strong> 32 possible selections). <strong>The</strong> selected<br />
enhancement and a uni<strong>for</strong>mly applied enhancement were then applied to the face images used in the celebrity detection task.<br />
We found that patients preferred enhancement at frequencies higher than the critical frequencies. <strong>The</strong>y also preferred the<br />
wideband enhancement over the narrowband enhancement. Individually selected enhancement, however, did not improve face<br />
recognition in comparison to uni<strong>for</strong>mly applied enhancement [6]. <strong>The</strong> same approach <strong>of</strong> asking the patient to select from a precomputed<br />
set <strong>of</strong> images the preferred one using a mouse to select the various options was applied also in tuning the gain <strong>of</strong> the<br />
wideband enhancement [14]. Only 5 out <strong>of</strong> 35 patients selected the original unenhanced image and none selected the degraded<br />
images that were included in the selection, indicating that the enhancement was preferred. Most patients selected a moderate<br />
level <strong>of</strong> enhancement and only few selected high level <strong>of</strong> enhancement. Similar tuning <strong>of</strong> the level <strong>of</strong> enhancement was also<br />
used to select the individual’s level <strong>of</strong> enhancement in the study <strong>of</strong> the enhancement in the JPEG domain [18].
Fig. 8. <strong>The</strong> set <strong>of</strong> lowpass (thin lines) and band-enhanced filters<br />
(color thicker lines) used to evaluate the effect <strong>of</strong> tuning on the<br />
10<br />
1<br />
8 c/face x5<br />
16 c/face x5<br />
8 c/face x2<br />
16 c/face x2<br />
enhancement preference and per<strong>for</strong>mance [6]. Note that that while<br />
gain<br />
the lowpass filters are conventional, the enhancement filters are<br />
.1<br />
not simply band-pass but specifically band-enhanced filters with<br />
gain>1. <strong>The</strong> notation x5 refers to a gain <strong>of</strong> 5.0 <strong>for</strong> that filter<br />
.01<br />
1<br />
10<br />
frequency (cycles/face)<br />
100<br />
In a more recent study we evaluated the effect <strong>of</strong> the adaptive enhancement applied to motion video using the Digi<strong>Vision</strong><br />
CE3000 device, again assessing the effect <strong>of</strong> individual tuning <strong>of</strong> the enhancement [9]. In pilot experiments we had found that<br />
patients (and also investigators wearing a cataract simulating glasses) had great difficulties setting the enhancement parameters<br />
<strong>for</strong> motion videos. Because <strong>of</strong> the changing nature <strong>of</strong> the video content there was no way to determine a single setting that was<br />
optimal or satisfactory <strong>for</strong> the whole video. <strong>The</strong> observers felt that the setting had to be flexible. We there<strong>for</strong>e implemented the<br />
parameter selection step again using static frames captured from the videos (Fig. 9a). <strong>The</strong> subjects used mouse to control the<br />
‘Detail’ parameter, representing spatial frequency, along the up/down dimension and a combination <strong>of</strong> the ‘Contrast<br />
(Background)’ parameters in the right/left dimension.<br />
100<br />
100<br />
90<br />
90<br />
80<br />
Degraded<br />
Enhanced<br />
80<br />
70<br />
60<br />
R 2 = 0.4241<br />
70<br />
60<br />
Degraded<br />
Enhanced<br />
Detail<br />
50<br />
Detail<br />
50<br />
40<br />
40<br />
30<br />
30<br />
20<br />
10<br />
0<br />
Groups A and B<br />
0 20 40 60 80 100<br />
Contrast (Background)<br />
a<br />
b<br />
Fig. 9. <strong>Enhancement</strong> parameters chosen by each subject. <strong>The</strong> position <strong>of</strong> each cross corresponds to mean mouse position on<br />
the graphics tablet and the error bars represent SEM. <strong>The</strong> vertical line at contrast = 27 (arbitrary units) represents no<br />
enhancement (original image). Area to the left <strong>of</strong> that line represents image degradation by low-pass filtering. Area to the<br />
right represents enhancement. All subjects selected values corresponding to enhancement. (a) Mean settings and standard<br />
deviations <strong>for</strong> each <strong>of</strong> the 49 patients who viewed static images, (b) Mean settings <strong>of</strong> 20 subjects who completed the<br />
continuous <strong>evaluation</strong> <strong>of</strong> motion videos. <strong>The</strong> filled symbols to the right <strong>of</strong> the vertical line represent enhancement settings<br />
used in the second part <strong>of</strong> the experiment <strong>for</strong> one subject. Diamond: individually selected enhancement settings; Triangles:<br />
settings used if in the B× group; Squares: settings used if in the B+ group; Open circles: settings that resulted in two degraded<br />
images; Filled circle: setting <strong>for</strong> the unenhanced original image that is produced from any detail setting that had contrast =27.<br />
For static images, visually impaired subjects could clearly select a preferred level <strong>of</strong> enhancement repeatedly, as indicated by<br />
20<br />
10<br />
0<br />
Groups B+ and B×<br />
Subjects<br />
0 20 40 60 80 100<br />
Contrast (Background)<br />
the small error bars. As a group, they showed a clear pattern <strong>of</strong> selecting a higher contrast gain setting if they selected a lower<br />
spatial frequency band <strong>for</strong> enhancement (Fig. 9a). However, when we continuously tracked the perceived quality <strong>of</strong> motion
video, using both the individually-selected and modified enhancement parameters (Fig. 9b), we found that subjects<br />
significantly preferred all <strong>of</strong> the enhancement parameter choices. <strong>The</strong> subjects’ individually selected enhancement parameters<br />
resulted in the largest effect, although this was not significantly better than the other enhancement options [9]. Thus, the value<br />
<strong>of</strong> enhancement tuning still remains elusive.<br />
a. Individual Tuning <strong>of</strong> Movie Sequences<br />
While selecting a single setting <strong>for</strong> the whole segment <strong>of</strong> video is difficult, continuous adjustment <strong>of</strong> setting is possible. It is<br />
easier to per<strong>for</strong>m this task when only one parameter is varied. We have recently used this approach in evaluating the benefit <strong>of</strong><br />
the MPEG enhancement per<strong>for</strong>med in real time. Subjects were presented with short (4 minutes) video segments <strong>of</strong> 4 different<br />
styles and were asked to continuously adjust the enhancement parameter using the up and down buttons on a TV remote<br />
control. Every 2 minutes the enhancement parameter was set to an extreme value: either a high level <strong>of</strong> enhancement that<br />
resulted in clearly noticeable distortions or a very high level <strong>of</strong> compression resulting in very blurred images. Following each<br />
such change the subjects were asked to use the up and down buttons to search <strong>for</strong> the best (clearest) view. <strong>The</strong> size <strong>of</strong> the<br />
change with each button press was changed from 4 just noticeable difference (JND) steps at first to 1 JND after the second<br />
reversal in staircase direction. If the subject had not adjusted the display <strong>for</strong> 15 sec, a voice prompt requested readjustment <strong>of</strong><br />
the setting. Most patients appreciated the enhancement and were able to set the level consistently to a preferred level (Fig.<br />
10a). A few patients with severe vision loss could not appreciate any effect <strong>of</strong> this enhancement (Fig. 10b). <strong>The</strong> data<br />
collection <strong>for</strong> this study (24 subjects) has just been completed and a complete analysis is not ready yet. <strong>The</strong> results however are<br />
very encouraging as they appear from examining the raw data.<br />
a<br />
b<br />
Fig. 10. MPEG enhancement settings while watching 4 minutes <strong>of</strong> a low motion well lit video (a panel discussion). <strong>The</strong><br />
zero level (black horizontal line) represents the original image and negative values represent degradation. <strong>The</strong> other<br />
horizontal lines represent linear (green) and geometric (blue) means <strong>of</strong> the settings. (a) <strong>The</strong> remote control setting <strong>of</strong> a<br />
patient with acuity <strong>of</strong> 20/250 who clearly appreciated the effect <strong>of</strong> enhancement. <strong>The</strong> segment starts with over enhancement<br />
and is reset at the middle to very low setting. In both cases the patient is resetting the enhancement to a level <strong>of</strong> about 1.6 to<br />
1.8. (b) <strong>The</strong> setting selected <strong>for</strong> the same video segment by another patient with more sever loss (20/600) who did not<br />
appreciate the effect <strong>of</strong> the enhancement (or degradation) at all. Settings are arbitrarily moving between the extreme values.<br />
Time axes in samples (30/sec) x10 5 .
4. Evaluation <strong>of</strong> impression <strong>of</strong> quality<br />
<strong>The</strong> simplest approach to determining the impact on image quality is to ask the viewer <strong>for</strong> their impression <strong>of</strong> the quality. <strong>The</strong><br />
subject may be asked to rate the quality on a verbal scale such as “poor, average, good, and excellent” or to assign a numerical<br />
value to it. This approach can be implemented to single frame images when evaluating enhancement <strong>of</strong> static images or to the<br />
<strong>evaluation</strong> <strong>of</strong> a video sequence following the presentation <strong>of</strong> a processed sequence.<br />
a. Evaluation <strong>of</strong> impression with a video sequence<br />
We have applied the latter approach in one <strong>of</strong> our studies [9], where each subject was asked to mark his response to 7<br />
questions, comparing video segments just seen to normal TV viewing. <strong>The</strong> responses were indicated by moving a marker<br />
across a continuously numbered scale, which was labeled by the words “poor” and “excellent” at the ends <strong>of</strong> the scale in large<br />
print. <strong>The</strong> experimenter recorded the subject's responses from the scale (range <strong>of</strong> 0 to 50). Comparisons were made <strong>of</strong> the<br />
seven measures: color, visibility <strong>of</strong> details, ability to recognize faces, ability to discern facial expressions, ability to follow the<br />
story, sound quality, and overall impression. Following the presentations <strong>of</strong> the second <strong>of</strong> two conditions in the per<strong>for</strong>mance<br />
study, the comparison questions were repeated. In this case, <strong>for</strong> each question the experimenter positioned the marker to the<br />
previous setting selected by the subject <strong>for</strong> this question and the subject was asked to indicate their response in comparison to<br />
the previous selection <strong>for</strong> the first condition. <strong>The</strong> overall mean <strong>of</strong> these scores was 0.15 ± 0.08 (SEM), which indicated a slight<br />
preference <strong>for</strong> the enhanced images but it only approached statistical significance (one-sample t-test, t 111 =1.89, p=0.062).<br />
Subjects remarked that it was difficult to make the required comparison to “normal TV” and to the other segment as the two<br />
segments differed in content even though they were continuations <strong>of</strong> the same program.<br />
b. Evaluation <strong>of</strong> impression with static images<br />
A more elaborate <strong>evaluation</strong> <strong>of</strong> the impression <strong>of</strong> image quality using static images was applied in analyzing the effects <strong>of</strong> two<br />
types <strong>of</strong> enhancement: the JPEG enhancement [18] and the wideband enhancement [14]. Both studies used the same 50 static<br />
TV images sampled from a TV cable broadcast. In each study another set <strong>of</strong> images from the same source was used to select<br />
the individual preferred level <strong>of</strong> enhancement. Once the individual level was selected <strong>for</strong> a subject, a set <strong>of</strong> 200 images was<br />
created consisting <strong>of</strong> 4 versions <strong>of</strong> each image to be used in the quality <strong>evaluation</strong> study. <strong>The</strong> four versions included: (1)<br />
original image; (2) individually chosen enhancement; (3) a degraded image; and (4) an image enhanced by a second arbitrarily<br />
selected enhancement level. <strong>The</strong> images were presented to each subject in a random sequence. <strong>The</strong> patients were asked to rate<br />
the image as “better”, “slightly better”, “typical”, “slightly worse” or “worse” than the original image by moving the mouse on<br />
the graphics tablet. <strong>The</strong>se words were printed in a large font on the graphics tablet. Be<strong>for</strong>e the computer accepted their rating,<br />
the patients were <strong>for</strong>ced to view the original image at least once <strong>for</strong> comparison.
<strong>Image</strong> quality detector ROC<br />
<strong>The</strong> data from these two studies using static images and a third study that employed the continuous <strong>evaluation</strong> <strong>of</strong> impression <strong>of</strong><br />
image quality were analyzed using a somewhat different ROC approach. Paired comparisons were made between responses to<br />
the original images and processed images. As there were three sets <strong>of</strong> processed images <strong>for</strong> each patient, three ROC curves<br />
were determined (Fig. 11). <strong>The</strong>se represented the difference in perceived image quality between the original and processed<br />
images.<br />
In standard ROC analysis (as described above <strong>for</strong> the adaptive enhancement study), a detector’s (e.g. patient’s) responses to<br />
“noise” (non celebrity) presentations and to “noise-plus-signal” (celebrity) presentations are compared. In such standard<br />
application <strong>of</strong> ROC there is a ground truth to which the responses are compared. In our impression <strong>of</strong> image quality studies,<br />
the original images were treated as the noise presentations, and the processed images were treated as the noise-plus-signal<br />
presentations. Patients were asked to report perceived image quality, so they could be considered image-quality detectors,<br />
comparing the quality <strong>of</strong> images presented with one set <strong>of</strong> parameters to the quality <strong>of</strong> the original unenhanced images. <strong>The</strong><br />
raw data consisted <strong>of</strong> multiple frequency distributions along the perceived image quality dimension. When the perceived<br />
image quality <strong>of</strong> the processed images was better than the original images, A z was greater than 0.5. For the degraded image set,<br />
subjects’ perceived image quality distributions were always worse than that <strong>of</strong> the original images, resulting in A z
are discussed in ref. [14]. Here I would like to highlight that the <strong>evaluation</strong> methodology we used could determine and<br />
quantify even the very modest effect <strong>of</strong> the wideband enhancement as applied in our study.<br />
Fig. 11. ROC data and fitted curves <strong>for</strong> a patient in the wideband<br />
enhancement study. True positive is the proportion <strong>of</strong> the processed<br />
images with higher perceived quality and False positive is the proportion<br />
<strong>of</strong> the original images with higher perceived quality. <strong>The</strong> thick solid line is<br />
the fit to the filled triangles (individually-selected enhancement level) and<br />
the thin line is the fit to the open squares (second arbitrary level). <strong>The</strong><br />
dashed line hugging the lower right corner is the fit to the filled diamonds<br />
(the degraded images). This 43-year-old patient (VA 20/250) clearly<br />
rejected the degraded image and significantly favored the enhanced<br />
images.<br />
c. Continuous <strong>evaluation</strong> <strong>of</strong> impression <strong>of</strong> quality<br />
<strong>The</strong> difficulty observers have with evaluating the image quality <strong>of</strong> a video is affected both by difficulties in comparing image<br />
quality across different images in time and on the need to integrate an impression that may be varied substantially due to the<br />
image quality <strong>of</strong> the unenhanced video which may change from scene to scene. In order to address both difficulties we have<br />
developed a method <strong>of</strong> continuous <strong>evaluation</strong> <strong>of</strong> quality derived from the method that Hamberg and de Ridder [34] used to<br />
evaluate perception <strong>of</strong> dynamic changes applied to static imagery.<br />
In this method, subjects indicated impression <strong>of</strong> image quality while viewing a movie: (excellent, good, sufficient, poor, and<br />
bad), by moving the mouse on a scale printed in large print. An auditory cue (beep) every 10 seconds indicated to the subject a<br />
change in parameters <strong>of</strong> the Digi<strong>Vision</strong> adaptive enhancement. Mouse position selected in response to the new parameters was<br />
recorded (once per second). Data from the last 7 seconds in each 10-second interval were collected and averaged.<br />
Two groups with 10 subjects each (Groups B+ and B×) participated in the study. For both groups each subject was presented<br />
with: her/his individually selected enhancement, the original unenhanced segments, and two different levels <strong>of</strong> degraded<br />
images. Each subject was also presented with sets processed with 4 additional arbitrary enhancement levels, two <strong>of</strong> which were<br />
over-enhanced. For one <strong>of</strong> these groups the plus (+) configuration <strong>of</strong> the arbitrary enhancement parameters was used, and <strong>for</strong><br />
the other group the crossed (×) configuration was used (Fig. 9). Each condition was repeated 10 times and the scores <strong>for</strong> each<br />
<strong>of</strong> these repetitions were converted to the probabilities used <strong>for</strong> the ROC analysis. This was the same image quality ROC<br />
analysis as described above.<br />
<strong>The</strong> results <strong>for</strong> the individually-selected enhancement and the degraded images were averaged <strong>for</strong> the two groups, while the<br />
arbitrary conditions were averaged separately <strong>for</strong> each group. <strong>The</strong> results (Fig. 12) demonstrate that subjects preferred the
enhanced videos to the unenhanced videos (t 107 = 6.92, p < 0.0005) and preferred the unenhanced videos to the low-pass filtered<br />
videos (t 41 = -4.06, p < 0.0005). <strong>The</strong> average rating <strong>for</strong> the original is equivalent to the “Sufficient” setting and the average<br />
rating <strong>for</strong> the individually selected enhancement is equivalent to the “Good” setting. Additionally, individually selected<br />
enhancement resulted in statistically significant improvement in perceived quality (A z =0.64, ±0.17) over the unenhanced<br />
images (0.5) (one sample t-test, DF=21, p=0.001). No differences in perceived quality were found between the individually<br />
selected set <strong>of</strong> parameters and the corresponding arbitrary enhancement values in either group.<br />
Fig. 12. Average A z <strong>of</strong> 20 subjects. <strong>The</strong> three filled points show the two<br />
degraded conditions and the individually-selected enhancement condition,<br />
which were common across all 20 subjects. <strong>The</strong> degraded conditions have<br />
average A z less than 0.5 whereas the enhanced condition has an average A z<br />
greater than 0.5. <strong>The</strong> other points show all the other enhanced conditions<br />
<strong>for</strong> the (B + ) and the (BB×) groups <strong>of</strong> 10 patients each. For all except two <strong>of</strong><br />
these enhancement conditions, the A z is significantly greater than 0.5 as<br />
indicated by lower bound <strong>of</strong> the error bars (SEM).<br />
5. Evaluation <strong>of</strong> preference<br />
Perhaps the most direct way to measure the value <strong>of</strong> video enhancement is to ask the observer (normally sighted or visually<br />
impaired) to indicate a preference in a direct side by side comparison <strong>of</strong> the enhanced and unenhanced images. If numerous<br />
comparisons <strong>of</strong> this type are repeated over multiple video sequences employing a proper study design that counterbalances the<br />
side <strong>of</strong> the presentation and with multiple observers, it should be possible to quantify preference. We also argue that <strong>for</strong> the<br />
purpose <strong>of</strong> enhancing TV <strong>for</strong> personal enjoyment and improved viewing experience such preference measurement may be more<br />
relevant to the value <strong>of</strong> enhancement than any other task per<strong>for</strong>mance improvement. We have conducted two studies <strong>of</strong> video<br />
enhancement using this <strong>evaluation</strong> approach; one <strong>for</strong> the MPEG method [19] and one <strong>for</strong> the adaptive enhancement [35].<br />
a. Side by side <strong>evaluation</strong> <strong>of</strong> MPEG enhancement<br />
In the study evaluating the MPEG enhancement using <strong>of</strong>f-line processing <strong>of</strong> test sequences [19], we enhanced and cut each<br />
video sequence to half the original width, but maintained the center <strong>of</strong> the picture. We then merged the original and enhanced
sequences using mirror-reversed replacement <strong>of</strong> the half-video to enable the side-by-side comparison <strong>of</strong> similar image areas.<br />
Both left-enhanced and right-enhanced sequences were created to allow balancing <strong>of</strong> the side on which enhancement was<br />
presented. A total <strong>of</strong> 32 video sets (4 sequences x 4 gains x 2 sides), each 5-seconds in length, were generated this way.<br />
Subjects sat at approximately 36” from a 19” PC monitor (1600 x 1200) and were asked to evaluate each side <strong>of</strong> the video<br />
sequence <strong>for</strong> “how clear the video is, how much detail and in<strong>for</strong>mation could be obtained from it, and how is the general<br />
quality <strong>of</strong> the picture?” Using these guidelines, they were asked to choose which side <strong>of</strong> the video (left or right) they preferred.<br />
Subjects were <strong>for</strong>ced to choose a side and the 5-seconds video sequences were repeated until the subject responded. Once they<br />
chose a side, they were asked to rate the chosen side relative to the other side as “a little better,” “better,” or “much better” than<br />
the other side (responses were recorded as a score <strong>of</strong> 1, 2, or 3). If a subject selected the enhanced side sequence, a positive<br />
score was assigned. If the subject selected the original un-enhanced sequence, a negative score was assigned. <strong>The</strong> negative or<br />
positive score from the first question was combined with the second question to yield a score that ranged from –3 to 3 except<br />
zero. Two scores were derived from each level <strong>of</strong> enhancement <strong>for</strong> each sequence (one score when enhancement was on the<br />
left side and one when it was on the right). <strong>The</strong> two scores were averaged.<br />
Twenty-four visually impaired subjects (14 men), median age 71.0 years, with visual acuity ranging from 20/70 to 20/2500<br />
participated in this study. All subjects had documented CFL in both eyes. During the experiments we noted that a few subjects<br />
seemed to have a clear preference <strong>for</strong> one side <strong>of</strong> the screen. We there<strong>for</strong>e tested <strong>for</strong> each patient if the selection was the same<br />
<strong>for</strong> the two identical presentations that differed only in side. For 11 <strong>of</strong> the 24 subjects, the preference was dependent on the<br />
side <strong>of</strong> the display (Paired t-test, P < 0.05) indicating a bias to one side, and there<strong>for</strong>e they were excluded from analysis. Fig.<br />
13 shows the results from the remaining 13 subjects who showed consistent (unbiased) preference. <strong>The</strong> results <strong>of</strong> these 13<br />
subjects were similar to those <strong>of</strong> the whole group. <strong>The</strong> two sequences that did not benefit from the enhancement were<br />
interlaced video sequences in which the enhancement substantially increased the interlacing artifacts.<br />
Figure 13. <strong>The</strong> median values <strong>of</strong> the 13 subjects who did not show a<br />
bias to one side <strong>of</strong> the screen. <strong>The</strong> subjects preferred the 3 lower<br />
enhancement levels (λ = 2 to 4) <strong>for</strong> two <strong>of</strong> the sequences (“Susie”<br />
and “Lion”. <strong>The</strong> two highest enhancement levels (λ = 4 and 5) <strong>for</strong><br />
the two other sequences (“Flwer” and “Tennis”) were rejected. <strong>The</strong><br />
lower enhancement levels were not significantly different from the<br />
original.<br />
b. Side by side <strong>evaluation</strong> <strong>of</strong> adaptive enhancement<br />
In a recent study [35] evaluating image enhancement with the adaptive enhancement as developed <strong>for</strong> a consumer home theatre<br />
product, we presented DVDs sequences from seven short video clips selected to represent various programs typically seen on
TV. Twenty subjects with CFL, seated 3 feet from and centered between two identical 27-inch televisions. One television<br />
picture was processed using the Digi<strong>Vision</strong> device (representing the setting <strong>of</strong> the Belkin’s Razor<strong>Vision</strong> commercial product),<br />
the other was not. Subjects were asked 16 times which television movie looked 'clearer' to them. Each television received the<br />
processed video <strong>for</strong> half <strong>of</strong> these presentations, and this was repeated twice. <strong>The</strong> level <strong>of</strong> enhancement processing controlled<br />
by the counterbalancing table gave 4 presentations <strong>of</strong> each level ('bypass', 'low', 'medium' and 'high') per subject. A custom<br />
s<strong>of</strong>tware program enabled the experimenter to record the subject's choice <strong>of</strong> clearer image, started video playback at the correct<br />
video, controlled the video switch <strong>for</strong> correct output, and sent the appropriate key presses to the Digi<strong>Vision</strong> control s<strong>of</strong>tware to<br />
select the correct enhancement level. Nineteen subjects, median age 60 years, visual acuity ranging from 20/46 to 20/609 (16<br />
<strong>of</strong> them had documented CFL) took part in this study. Two subjects showed a strong preference <strong>for</strong> one side (75% in both<br />
cases, p=0.028). Data from these two subjects were removed from general analysis. <strong>The</strong> remaining data were pooled across all<br />
subjects and presentation side and analyzed using the proportion <strong>of</strong> presentations preferred. Fig. 14 shows a clear and<br />
significant preference <strong>for</strong> enhancement (Chi-Square=21.0, p
ightness displays. <strong>The</strong> essential difficulty is how to create a clearly quantifiable measure <strong>of</strong> image quality that can be<br />
obtained from an observer watching a video program on TV. <strong>The</strong> <strong>challenge</strong> is particularly difficult if one attempts to measure<br />
an improvement in the per<strong>for</strong>mance <strong>of</strong> any (preferably relevant) task in visually impaired. This has proven elusive as it is not<br />
clear what constitutes such a task since people watching TV programs are doing so <strong>for</strong> their entertainment. Measuring<br />
preference and/or impression <strong>of</strong> quality <strong>of</strong> a live motion video has also proven difficult as the image quality <strong>of</strong> the underlying<br />
images vary with time making a judgment difficult and variable. We have investigated numerous approaches and feel that two<br />
approaches seem most promising. First, the selection <strong>of</strong> parameters <strong>for</strong> a preferred setting in response to a shift <strong>of</strong> a parameter<br />
to an extreme value is a potentially workable method. We have not yet attempted addressing more than one parameter at a time<br />
under this approach and we do not yet have sufficient experience to determine the stability and repeatability <strong>of</strong> these measures.<br />
Second, side by side comparison <strong>of</strong> a live video, while its parameter settings are changing may serve as a reasonable approach.<br />
This approach has the advantage <strong>of</strong> simplicity and the potential <strong>for</strong> testing each subject over sufficiently large number <strong>of</strong><br />
repetitions over a variable program material to let an average preferred setting or enhancement approach emerge. We plan to<br />
continue investigating these approaches while we search <strong>for</strong> even more effective enhancement algorithms.<br />
Acknowledgements<br />
Supported in part by NIH grants EY05957 and EY12890<br />
References<br />
[1] J. Packer and C. Kirchner, "Who's Watching? A Pr<strong>of</strong>ile <strong>of</strong> the Blind and Visually <strong>Impaired</strong> Audience <strong>for</strong> Television<br />
and Video," American Foundation <strong>for</strong> the Blind, 1997.<br />
[2] E. Peli and T. Peli, "<strong>Image</strong> enhancement <strong>for</strong> the visually impaired," Optical Engineering, vol. 23, pp. 47-51, 1984.<br />
[3] E. Peli, L. E. Arend, Jr., and G. T. Timberlake, "Computerized image enhancement <strong>for</strong> low vision: New technology,<br />
new possibilities," Journal <strong>of</strong> Visual Impairment & Blindness, vol. 80, pp. 849-854, 1986.<br />
[4] E. Peli, R. B. Goldstein, G. M. Young, C. L. Trempe, and S. M. Buzney, "<strong>Image</strong> enhancement <strong>for</strong> the visually<br />
impaired: Simulations and experimental results," Investigative Ophthalmology & Visual Science, vol. 32, pp. 2337-<br />
2350, 1991.<br />
[5] E. Peli, "Limitations <strong>of</strong> image enhancement <strong>for</strong> the visually impaired," Optometry and Visual Science, vol. 69, pp. 15-<br />
24, 1992.<br />
[6] E. Peli, E. Lee, C. L. Trempe, and S. Buzney, "<strong>Image</strong> enhancement <strong>for</strong> the visually impaired: the effects <strong>of</strong><br />
enhancement on face recognition," Journal <strong>of</strong> the Optical Society <strong>of</strong> America A, vol. 11, pp. 1929-1939, 1994.<br />
[7] T. Peli and J. S. Lim, "Adaptive filtering <strong>for</strong> image enhancement," Optical Engineering, vol. 21, pp. 108-112, 1982.<br />
[8] R. G. Hier, G. W. Schmidt, R. S. Miller, and S. E. DeForest, "Real-time locally adaptive contrast enhancement: A<br />
practical key to overcoming display and human-visual-system limitations," presented at 1993 SID International<br />
Symposium Digest <strong>of</strong> Technical Papers, Seattle, WA, 1993.<br />
[9] E. Peli, "Recognition per<strong>for</strong>mance and perceived quality <strong>of</strong> video enhanced <strong>for</strong> the visually impaired," Ophthalmic<br />
and Physiological Optics, vol. 25, pp. 543-555, 2005.<br />
[10] C. K. Chow and T. Kaneko, "Automatic boundary detection <strong>of</strong> the left ventricle from cineangiograms," Comput.<br />
Biomed. Res, vol. 5, pp. 388-410, 1972.<br />
[11] E. Peli and M. Lahav, "Drusen measurements from fundus photographs using computerized image analysis,"<br />
Ophthalmology, vol. 93, pp. 1575-1580, 1986.<br />
[12] E. Peli, "Visual issues in the use <strong>of</strong> a head mounted monocular display," Optical Engineering, vol. 29, pp. 883-892,<br />
1990.<br />
[13] E. Peli, "Simple 1-D enhancement <strong>for</strong> head-mounted low vision aid," Visual Impairment Research, vol. 1, pp. 3-10,<br />
1999.
[14] E. Peli, J. Kim, Y. Yitzhaky, R. B. Goldstein, and R. L. Woods, "Wideband enhancement <strong>of</strong> television images <strong>for</strong><br />
people with visual impairment," Journal <strong>of</strong> the Optical Society <strong>of</strong> America A, vol. 21, pp. 937-950, 2004.<br />
[15] E. Peli, "Feature detection algorithm based on a visual system model," Proceedings <strong>of</strong> the IEEE, vol. 90, pp. 78-93,<br />
2002.<br />
[16] G. Luo, N. M. Rensing, E. Weststrate, and E. Peli, "Registration <strong>of</strong> an on-axis see-through head<br />
mounted display and camera system," Optical Engineering, vol. 44, 2005.<br />
[17] J. Tang, E. Peli, and S. Acton, "<strong>Image</strong> enhancement using a contrast measure in the compressed domain," IEEE Signal<br />
Processing Letters, vol. 10, pp. 289-292, 2003.<br />
[18] J. Tang, J. Kim, and E. Peli, "<strong>Image</strong> enhancement in the JPEG domain <strong>for</strong> people with vision impairment," IEEE<br />
Transactions on Biomedical Engineering, vol. 51, pp. 2013-2023, 2004.<br />
[19] J. Kim, A. Vora, and E. Peli, "MPEG-based image enhancement <strong>for</strong> the visually impaired," Optical Engineering, vol.<br />
43, pp. 1318-1328, 2004.<br />
[20] PixelTools, "MPEG Repair s<strong>of</strong>tware, Pixeltools Corporation, http://www.pixeltools.com/MpegRepair.html.," 2006.<br />
[21] M. Fullerton and E. Peli, "Post-transmission digital video enhancement <strong>for</strong> people with visual impairments," Journal<br />
<strong>of</strong> the Society <strong>for</strong> In<strong>for</strong>mation Display, vol. 14, pp. 15-24, 2006.<br />
[22] D. Miller and G. Benedek, Intraocular light scattering. Springfield, Illinois: Charles C. Thomas, 1973.<br />
[23] E. Peli, "Contrast in complex images," Journal <strong>of</strong> the Optical Society America A, vol. 7, pp. 2032-2040, 1990.<br />
[24] E. Peli, "Test <strong>of</strong> a model <strong>of</strong> foveal vision by using simulations," Journal <strong>of</strong> the Optical Society <strong>of</strong> America A, vol. 13,<br />
pp. 1131-1138, 1996.<br />
[25] E. Peli, "Contrast sensitivity function and image discrimination," Journal <strong>of</strong> the Optical Society <strong>of</strong> America A, vol. 18,<br />
pp. 283-293, 2001.<br />
[26] E. Peli, "<strong>Enhancement</strong> <strong>of</strong> retinal images: pros and problems," Neuroscience and Behavioral Reviews, vol. 17, pp. 477-<br />
482, 1993.<br />
[27] J. Sergent, "Microgenesis <strong>of</strong> face perception," in Aspects <strong>of</strong> Face Processing, H. Ellis, M. Jeeves, F. Newcombe, and<br />
A. Young, Eds. Boston: Martinus Nijh<strong>of</strong>f, 1986, pp. 17-33.<br />
[28] A. O'Toole, R. Millward, and J. Anderson, "A physical system approach to recognition memory <strong>for</strong> spatially<br />
trans<strong>for</strong>med faces," Neural Networks, vol. 1, pp. 179-199, 1988.<br />
[29] C. E. Metz, P. Wang, and H. B. Kronman, "A new approach <strong>for</strong> testing the significance <strong>of</strong> differences between ROC<br />
curves measured from correlated data," presented at Proceedings <strong>of</strong> the VIII Conference on In<strong>for</strong>mation Processing in<br />
Medical Imaging, <strong>The</strong> Hague, 1983.<br />
[30] J. A. Swets and R. M. Pickett, "Fundamentals <strong>of</strong> accuracy analysis," in Evaluation <strong>of</strong> Diagnostic Systems: Methods<br />
From Signal Detection <strong>The</strong>ory. New York: Academic Press, 1982.<br />
[31] E. Peli, E. M. Fine, and A. T. Labianca, "Evaluating visual in<strong>for</strong>mation provided by audio description," Journal <strong>of</strong><br />
Visual Impairment & Blindness, vol. 90, pp. 378-385, 1996.<br />
[32] B. J. Cronin and S. R. King, "<strong>The</strong> development <strong>of</strong> the descriptive video service," Journal <strong>of</strong> Visual Impairment and<br />
Blindness, vol. 84, pp. 503-506, 1990.<br />
[33] E. Fine, E. Peli, and N. Brady, "Video enhancement improves per<strong>for</strong>mance <strong>of</strong> persons with moderate visual loss,"<br />
presented at Proceedings <strong>of</strong> the International Conference on Low <strong>Vision</strong>, "<strong>Vision</strong> '96", Madrid, Spain, 1996.<br />
[34] R. Hamberg and H. de Ridder, "Continuous assessment <strong>of</strong> perceptual image quality.," Journal <strong>of</strong> the Optical Society <strong>of</strong><br />
America A, vol. 12, pp. 2573-2577., 1995.<br />
[35] M. Fullerton and E. Peli, "People with visual impairment prefer TV viewing using a contrast enhancement consumer<br />
product," presented at 2007 SID International Symposium, 2007 (Submitted).