Image Enhancement in the JPEG Domain for People with Vision ...
Image Enhancement in the JPEG Domain for People with Vision ...
Image Enhancement in the JPEG Domain for People with Vision ...

You also want an ePaper? Increase the reach of your titles
YUMPU automatically turns print PDFs into web optimized ePapers that Google loves.
TBME-00426-2003.R1<br />
<strong>Image</strong> <strong>Enhancement</strong> <strong>in</strong> <strong>the</strong> <strong>JPEG</strong> Doma<strong>in</strong> <strong>for</strong><br />
<strong>People</strong> <strong>with</strong> <strong>Vision</strong> Impairment<br />
J<strong>in</strong>shan Tang, Senior Member, Jeonghoon Kim, and Eli Peli<br />
Abstract—An image enhancement algorithm <strong>for</strong> low-vision<br />
patients was developed <strong>for</strong> images compressed us<strong>in</strong>g <strong>the</strong> <strong>JPEG</strong><br />
standard. The proposed algorithm enhances <strong>the</strong> images <strong>in</strong> <strong>the</strong><br />
Discrete Cos<strong>in</strong>e Trans<strong>for</strong>m (DCT) doma<strong>in</strong> by weight<strong>in</strong>g <strong>the</strong><br />
quantization table <strong>in</strong> <strong>the</strong> decoder. Our specific implementation<br />
<strong>in</strong>creases <strong>the</strong> contrast at all bands of frequencies by an equal<br />
factor. The enhancement algorithm has four advantages: (1) low<br />
computational cost, (2) suitability <strong>for</strong> real–time application, (3)<br />
ease of adjustment by end-users (<strong>for</strong> example, adjust<strong>in</strong>g a s<strong>in</strong>gle<br />
parameter), and (4) less severe block artifacts as compared <strong>with</strong><br />
conventional (post compression) enhancements. Experiments <strong>with</strong><br />
visually impaired patients show improved perceived image<br />
quality at moderate levels of enhancement but rejection of<br />
artifacts caused by higher levels of enhancement.<br />
Index Terms— DCT, DCT filter<strong>in</strong>g, enhancement, image<br />
quantization table, <strong>JPEG</strong>, Television, vision impairment,<br />
M<br />
I. INTRODUCTION<br />
ILLIONS of people are visually impaired, <strong>with</strong> <strong>the</strong> number of<br />
people <strong>with</strong> disabl<strong>in</strong>g visual problems <strong>in</strong>creas<strong>in</strong>g <strong>with</strong> <strong>the</strong><br />
grow<strong>in</strong>g ag<strong>in</strong>g population. A Louis Harris survey found that<br />
vision impairment affects 17% of Americans 45 and older, and 26%<br />
of those 75 and older [1]. Visually impaired people have difficulties<br />
read<strong>in</strong>g small pr<strong>in</strong>t, watch<strong>in</strong>g television, recogniz<strong>in</strong>g faces, etc. While<br />
much research and rehabilitation ef<strong>for</strong>t has been aimed at improv<strong>in</strong>g<br />
<strong>the</strong> read<strong>in</strong>g ability of low-vision patients [2, 3], <strong>the</strong> <strong>in</strong>creas<strong>in</strong>g use of<br />
television and personal computers heightens <strong>the</strong> need <strong>for</strong> image<br />
enhancement particular to <strong>the</strong>se doma<strong>in</strong>s as well. Previous work on<br />
image enhancement as a low-vision aid [4-9] has been carried out<br />
<strong>with</strong> uncompressed images. However, many images are now handled<br />
<strong>in</strong> compressed <strong>for</strong>mats, e.g. <strong>in</strong> computers and digital television, and<br />
<strong>the</strong> expected growth of such applications is likely to <strong>in</strong>crease <strong>the</strong> need<br />
<strong>for</strong> enhancement that can per<strong>for</strong>m well <strong>with</strong>out access to <strong>the</strong><br />
uncompressed orig<strong>in</strong>al.<br />
This paper describes an image enhancement approach <strong>for</strong> lowvision<br />
viewers applied directly <strong>with</strong><strong>in</strong> <strong>the</strong> compression doma<strong>in</strong>, based<br />
on aspects of <strong>the</strong> <strong>JPEG</strong> standard compression protocol that are also<br />
applicable to MPEG compression <strong>for</strong> mov<strong>in</strong>g images [10]. <strong>Image</strong>s<br />
Manuscript received October 6, 2003. This work was supported <strong>in</strong> part by<br />
NIH grants EY05957 and EY12890 to EP and by a postdoctoral fellowship<br />
program from Korea Science & Eng<strong>in</strong>eer<strong>in</strong>g Foundation (KOSEF) to JK.<br />
J<strong>in</strong>shan Tang was <strong>with</strong> Schepens Eye Research Institute, Harvard Medical<br />
School, Boston, MA 02114 USA. He is now <strong>with</strong> <strong>the</strong> Department of<br />
Electrical and Computer Eng<strong>in</strong>eer<strong>in</strong>g, University of Virg<strong>in</strong>ia, Charlottesville,<br />
VA 22903 USA.<br />
Jeonghoon Kim was <strong>with</strong> Schepens Eye Research Institute, Harvard<br />
Medical School, Boston, MA 02114 USA.<br />
Eli Peli is <strong>with</strong> Schepens Eye Research Institute, Harvard Medical School,<br />
Boston, MA 02114 USA. (e-mail: eli@vision.eri.harvard.edu).<br />
delivered ultimately <strong>in</strong> a <strong>JPEG</strong> <strong>for</strong>mat may be enhanced: prior to<br />
compression, after decompression, or <strong>with</strong><strong>in</strong> <strong>the</strong> <strong>JPEG</strong> doma<strong>in</strong> (<strong>the</strong><br />
method chosen here). Pre-compression enhancement has <strong>the</strong><br />
disadvantage of reduc<strong>in</strong>g <strong>the</strong> amount of compression subsequently<br />
possible as compared to <strong>the</strong> unenhanced orig<strong>in</strong>al. For example, Hader<br />
et al [11] proposes to low-pass filter <strong>the</strong> image be<strong>for</strong>e compression<br />
and <strong>the</strong>n enhance it after decompression. In addition, as it is designed<br />
to reduce high frequency content, any amount of compression will<br />
counteract <strong>the</strong> enhancement effect. On <strong>the</strong> o<strong>the</strong>r hand, postcompression<br />
enhancement is more likely to <strong>in</strong>crease block artifacts:<br />
compress<strong>in</strong>g an image creates block artifacts above, near-to or<br />
(ideally) below <strong>the</strong>ir visibility thresholds, and enhancement is likely<br />
to <strong>in</strong>crease <strong>the</strong> visibility of <strong>the</strong> artifacts as well. Our approach of<br />
apply<strong>in</strong>g image enhancement <strong>with</strong><strong>in</strong> <strong>the</strong> <strong>JPEG</strong> doma<strong>in</strong> helps to<br />
reduce this problem. S<strong>in</strong>ce block artifacts are ma<strong>in</strong>ly affected by <strong>the</strong><br />
quantization of low-frequency coefficients, keep<strong>in</strong>g <strong>the</strong>se (and <strong>the</strong><br />
DC) coefficients unmodified or m<strong>in</strong>imally adjusted should reduce <strong>the</strong><br />
severity of artifacts. The algorithm implemented here has this<br />
property and <strong>in</strong>deed reduces <strong>the</strong> appearance of block artifacts.<br />
To apply and assess <strong>the</strong> visual effects of image enhancement, one<br />
requires a visually mean<strong>in</strong>gful def<strong>in</strong>ition of contrast [See, <strong>for</strong><br />
example, a special issue of <strong>Vision</strong> Research, vol 37(23) 1998,<br />
cover<strong>in</strong>g this topic]. Various contrast measures have been proposed,<br />
and those def<strong>in</strong>ed <strong>in</strong> <strong>the</strong> spatial frequency doma<strong>in</strong> may be considered<br />
applicable <strong>for</strong> use <strong>in</strong> our proposed image enhancement application. In<br />
particular, Peli [12] def<strong>in</strong>ed contrast <strong>for</strong> natural or complex images as<br />
<strong>the</strong> ratio of <strong>the</strong> band-pass filtered image at a given frequency band to<br />
<strong>the</strong> low-pass filtered image one octave below it. Similarly, Toet [13]<br />
def<strong>in</strong>ed contrast as <strong>the</strong> ratios of low-pass versions of <strong>the</strong> image. The<br />
measure we propose is based on ratio of band pass versions of <strong>the</strong><br />
image redef<strong>in</strong>ed <strong>with</strong><strong>in</strong> <strong>the</strong> discrete cos<strong>in</strong>e trans<strong>for</strong>m (DCT) doma<strong>in</strong><br />
that is used <strong>in</strong> <strong>JPEG</strong> compression [10].<br />
As our goal is to improve everyday image view<strong>in</strong>g <strong>for</strong> low vision<br />
patients, we chose to use TV type monitors (NTSC, <strong>in</strong>terlaced) <strong>in</strong> our<br />
subjective evaluation experiment ra<strong>the</strong>r than computer progressive<br />
displays; although use of computer displays is also <strong>in</strong>creas<strong>in</strong>g,<br />
<strong>in</strong>dividuals <strong>in</strong> <strong>the</strong> ag<strong>in</strong>g population view television screens more<br />
often and <strong>for</strong> longer periods than computer screens. Our ef<strong>for</strong>ts as<br />
described here <strong>for</strong> still images are expected to be applied <strong>in</strong> a future<br />
study to mov<strong>in</strong>g images us<strong>in</strong>g <strong>the</strong> (<strong>JPEG</strong>-like) MPEG <strong>for</strong>mat.<br />
II. IMAGE ENHANCEMENT IN THE <strong>JPEG</strong> DOMAIN<br />
A. <strong>JPEG</strong> basics<br />
<strong>JPEG</strong> is an image compression and decompression standard that<br />
is based on <strong>the</strong> DCT [14, 15]. In <strong>the</strong> compression stage, a given<br />
image is first divided <strong>in</strong>to non-overlapp<strong>in</strong>g blocks of 8× 8 pixels.<br />
The two-dimensional DCT is <strong>the</strong>n computed <strong>for</strong> each block. The 64<br />
DCT coefficients are subsequently quantized us<strong>in</strong>g a quantization<br />
table (a lossy operation), and <strong>the</strong>reafter <strong>the</strong>y are losslessly coded and<br />
transmitted or stored toge<strong>the</strong>r <strong>with</strong> <strong>the</strong> quantization table. In <strong>the</strong><br />
decompression stage, each block of <strong>the</strong> received compressed data is<br />
1
TBME-00426-2003.R1<br />
decoded, dequantized us<strong>in</strong>g <strong>the</strong> quantization table, and <strong>in</strong>verse DCT<br />
trans<strong>for</strong>med <strong>in</strong>to an image block. The specific design of a<br />
quantization table is important because of its <strong>in</strong>fluences on both <strong>the</strong><br />
compression ratio and reconstructed image quality. A Basic<br />
Quantization table (see Figure 5 <strong>in</strong> [15]) is often used <strong>in</strong> <strong>JPEG</strong> based<br />
image compression, but o<strong>the</strong>r quantization tables can be derived from<br />
it by adjust<strong>in</strong>g a quality factor [15]. Any o<strong>the</strong>r quantization table is<br />
acceptable <strong>with</strong><strong>in</strong> <strong>the</strong> <strong>JPEG</strong> standard s<strong>in</strong>ce <strong>the</strong> table is transmitted or<br />
stored <strong>with</strong> <strong>the</strong> coded image.<br />
B. Contrast Measure of <strong>Image</strong>s <strong>in</strong> DCT Domian<br />
<strong>Image</strong> enhancement methods may be classified <strong>in</strong>to those that<br />
enhance contrast directly and those that enhance contrast <strong>in</strong>directly.<br />
Direct contrast enhancement methods [16-18] measure <strong>the</strong> image<br />
contrast be<strong>for</strong>e enhancement. In this paper, we <strong>in</strong>troduce a new direct<br />
contrast enhancement method based on a def<strong>in</strong>ition of image contrast<br />
<strong>in</strong> <strong>the</strong> DCT doma<strong>in</strong>.<br />
Let D be a 8× 8 array of DCT coefficients of an image block.<br />
The DCT coefficients represent <strong>the</strong> spatial frequency content of <strong>the</strong><br />
image <strong>in</strong> a similar way to <strong>the</strong> coefficients <strong>in</strong> one quadrant of <strong>the</strong> two<br />
dimensional Fourier doma<strong>in</strong>. The d 00 coefficient represents <strong>the</strong> DC<br />
level of <strong>the</strong> block, and <strong>the</strong> o<strong>the</strong>r coefficients represent spatial<br />
frequencies that <strong>in</strong>crease <strong>with</strong> <strong>the</strong>ir distance from d 00 . For <strong>in</strong>stance,<br />
coefficients d 04 and d 40 represent a spatial frequency of 4 cycles per<br />
block <strong>in</strong> <strong>the</strong> horizontal and vertical directions, respectively. A band<br />
limited contrast measure <strong>in</strong> <strong>the</strong> DCT doma<strong>in</strong> can be def<strong>in</strong>ed by<br />
En<br />
C<br />
n<br />
= ( 1 ≤ n ≤ 14 , n ∈ Z ) , (2)<br />
E<br />
where<br />
n−1<br />
∑<br />
d<br />
i,<br />
j<br />
i+<br />
j=<br />
n<br />
En<br />
= , (3)<br />
Nn<br />
is <strong>the</strong> average amplitude over a spectral band enclosed by an ellipse<br />
<strong>in</strong> (1) and<br />
⎧ n + 1<br />
= ⎨<br />
⎩14<br />
− n + 1<br />
n < 8<br />
n ≥ 8<br />
(1)<br />
N n<br />
. (4)<br />
Note that <strong>the</strong> 14 bands def<strong>in</strong>ed <strong>in</strong> this way represent approximately<br />
equal spatial frequencies and are consistent <strong>with</strong> <strong>the</strong> zigzag structure<br />
of cod<strong>in</strong>g <strong>the</strong> blocks <strong>with</strong><strong>in</strong> <strong>the</strong> <strong>JPEG</strong> standard.<br />
C. <strong>Image</strong> contrast enhancement <strong>in</strong> <strong>the</strong> DCT doma<strong>in</strong><br />
Let <strong>the</strong> contrast of <strong>the</strong> various bands def<strong>in</strong>ed <strong>in</strong> <strong>the</strong><br />
compressed/quantized DCT block be C = ( c1,<br />
c2<br />
,..., c14<br />
) and<br />
<strong>the</strong> contrast of <strong>the</strong> enhanced image be C = ( c1,<br />
c2,...,<br />
c14<br />
) . If we<br />
enhance <strong>the</strong> contrast by <strong>the</strong> same constant enhancement factor, λ, <strong>for</strong><br />
all bands of frequencies, <strong>the</strong>n <strong>the</strong> relationship between <strong>the</strong>m can be<br />
described by<br />
cn = λc n<br />
. (5)<br />
Thus, we have<br />
E<br />
E<br />
n<br />
n−1<br />
= c<br />
n<br />
= λc<br />
that can be expanded as follows<br />
E<br />
λE<br />
n<br />
=<br />
λE<br />
E<br />
λE<br />
n<br />
n−1<br />
λE<br />
n<br />
n n−1<br />
n<br />
= En−<br />
1<br />
= En−2<br />
En−<br />
1<br />
En−<br />
1<br />
En−2<br />
E<br />
2 n<br />
n n<br />
= λ En−2<br />
= ⋅⋅⋅λ<br />
E0<br />
=<br />
En−2<br />
E0<br />
E<br />
, (6)<br />
,<br />
n<br />
λ E<br />
where E<br />
0<br />
= E0<br />
.<br />
Us<strong>in</strong>g equation (3) and (7), we can obta<strong>in</strong> <strong>the</strong> enhanced DCT<br />
coefficients d<br />
ij as<br />
i+<br />
j<br />
d<br />
ij = λ dij<br />
, (8)<br />
that can be realized by weight<strong>in</strong>g <strong>the</strong> dequantization table.<br />
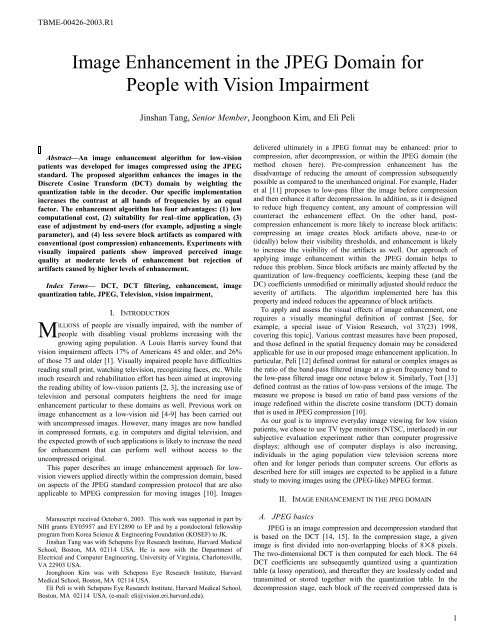
The enhancement algorithm (Figure 1) shows that <strong>the</strong> modified<br />
dequantization table Q is obta<strong>in</strong>ed by weight<strong>in</strong>g <strong>the</strong> quantization<br />
table Q , transmitted <strong>with</strong> <strong>the</strong> compressed image, by <strong>the</strong> follow<strong>in</strong>g<br />
equation:<br />
Q = Λ ∗ Q , (9)<br />
where <strong>the</strong> notation “*” is po<strong>in</strong>t-wise multiplication of two matrices<br />
and<br />
i+<br />
j<br />
Λ( i,<br />
j)<br />
= λ , (10)<br />
is <strong>the</strong> filter<strong>in</strong>g matrix.<br />
The post-transmission enhancement of an image <strong>in</strong> <strong>the</strong> DCT<br />
doma<strong>in</strong> provides dist<strong>in</strong>ct advantages over image enhancement<br />
methods that ei<strong>the</strong>r utilize spatial filter<strong>in</strong>g after application of an<br />
Inverse Discrete Cos<strong>in</strong>e Trans<strong>for</strong>m (IDCT) or filter <strong>the</strong> image be<strong>for</strong>e<br />
transmission. The present method has m<strong>in</strong>imal computational cost<br />
(only 64 multiplications) and uses <strong>the</strong> IDCT operation already<br />
per<strong>for</strong>med as part of <strong>the</strong> decompresssion. Implementation merely<br />
requires access to <strong>the</strong> quantization table employed to decode <strong>the</strong><br />
image. Fu<strong>the</strong>rmore, <strong>the</strong> method allows a user to choose <strong>the</strong> desired<br />
filter <strong>in</strong>tractively. For example, <strong>the</strong> user may cont<strong>in</strong>uously vary λ ,<br />
and view <strong>the</strong> result <strong>in</strong> real-time, <strong>in</strong> order to select <strong>the</strong> appearance<br />
meet<strong>in</strong>g <strong>the</strong>ir <strong>in</strong>dividual requirements. This can be easily<br />
acomplished <strong>in</strong> real time.<br />
n<br />
(7)<br />
2
TBME-00426-2003.R1<br />
Figure 1. <strong>Image</strong> <strong>Enhancement</strong> <strong>in</strong> <strong>JPEG</strong> Doma<strong>in</strong> is achieved by weight<strong>in</strong>g <strong>the</strong><br />
quantization table <strong>with</strong> an appropriate filter (weight<strong>in</strong>g array). Q is <strong>the</strong><br />
modified quantization table obta<strong>in</strong>ed by multiply<strong>in</strong>g (po<strong>in</strong>t by po<strong>in</strong>t) <strong>the</strong><br />
weight<strong>in</strong>g array <strong>with</strong> <strong>the</strong> quantization table Q , which can be accessed from<br />
<strong>the</strong> <strong>JPEG</strong> bit stream.<br />
D. Directional Contrast <strong>Enhancement</strong> of <strong>Image</strong>s <strong>in</strong> <strong>the</strong><br />
DCT Doma<strong>in</strong><br />
Apply<strong>in</strong>g enhancement <strong>in</strong> <strong>the</strong> <strong>in</strong>terlaced video doma<strong>in</strong> normally<br />
results <strong>in</strong> a substantial <strong>in</strong>crease <strong>in</strong> <strong>in</strong>terlace artifacts. Such artifacts<br />
may be reduced by enhanc<strong>in</strong>g <strong>the</strong> horizontal direction contrast<br />
(<strong>with</strong><strong>in</strong> a scan l<strong>in</strong>e) more than <strong>the</strong> vertical direction contrast. Us<strong>in</strong>g<br />
<strong>the</strong> same <strong>for</strong>mulation as above, more contrast enhancement <strong>in</strong> <strong>the</strong><br />
vertical direction frequency <strong>in</strong> <strong>the</strong> DCT doma<strong>in</strong> (<strong>the</strong> horizontal space<br />
doma<strong>in</strong>) may be achieved by limit<strong>in</strong>g <strong>the</strong> enhancement to <strong>the</strong> upperright<br />
segment of <strong>the</strong> filter<strong>in</strong>g matrix us<strong>in</strong>g:<br />
d<br />
ij =<br />
i+<br />
j<br />
⎪⎧<br />
λ d<br />
⎨<br />
⎪⎩ di,<br />
j<br />
i,<br />
j<br />
i ≤ j<br />
i > j<br />
III. METHODS<br />
. (11)<br />
A. Choice of quality factor <strong>for</strong> <strong>JPEG</strong> Compression<br />
For our experiments we needed a level of compression<br />
appropriate <strong>for</strong> good quality TV pictures, one <strong>in</strong> which <strong>the</strong><br />
compressed images were almost <strong>in</strong>dist<strong>in</strong>guishable from <strong>the</strong> orig<strong>in</strong>als.<br />
In computer screen <strong>JPEG</strong>-based compression applications [15] <strong>the</strong><br />
quality factor, q, is often set at 50. We tested 4 candidate quality<br />
factors, one of which is above and two of which are below that value,<br />
q=15, 35, 50 or 60, and applied subjective test<strong>in</strong>g by normally<br />
sighted observers to compare <strong>the</strong> quality of <strong>the</strong> variously compressed<br />
versions <strong>with</strong> <strong>the</strong>ir uncompressed orig<strong>in</strong>als. Thirty analog images<br />
were captured randomly from cable television broadcasts, and each<br />
image was compressed us<strong>in</strong>g <strong>the</strong> four different quality factors.<br />
The decompressed images and <strong>the</strong> uncompressed orig<strong>in</strong>al<br />
images were displayed on a 27-<strong>in</strong>ch television <strong>in</strong> random order.<br />
Subjects <strong>with</strong> normal vision were asked to rate <strong>the</strong> display images <strong>in</strong><br />
terms of <strong>the</strong>ir quality as compared to a standard TV image us<strong>in</strong>g a<br />
graphics tablet and mouse. The distance from <strong>the</strong> TV monitor to <strong>the</strong><br />
subject was 36 <strong>in</strong>ches (such short view<strong>in</strong>g distance is frequently used<br />
by visually impaired observers). Subjects were asked to rate <strong>the</strong><br />
decompressed images as ‘very bad’, ‘bad’, ‘acceptable’, ‘good’, or<br />
‘excellent’, and <strong>the</strong>ir rat<strong>in</strong>gs were scored on a correspond<strong>in</strong>g scale of<br />
1 to 5.<br />
Eight subjects (20 to 40 years old) <strong>with</strong> normal, or corrected to<br />
normal, vision participated <strong>in</strong> <strong>the</strong> experiment. The subjects’ quality<br />
rat<strong>in</strong>g scores (1 to 5) were used to calculate receiver operat<strong>in</strong>g<br />
characteristic curves (ROCs) [19]; a non-standard application of<br />
ROC analysis was used <strong>for</strong> a comparison between <strong>the</strong> rat<strong>in</strong>gs <strong>for</strong> <strong>the</strong><br />
variously compressed versions and <strong>the</strong> uncompressed orig<strong>in</strong>al.<br />
(Typically <strong>in</strong> ROC analysis, per<strong>for</strong>mance is compared aga<strong>in</strong>st a<br />
known ground truth—see Section III-G below). The ROC curve was<br />
obta<strong>in</strong>ed as follows: For <strong>the</strong> first data po<strong>in</strong>t on <strong>the</strong> curve, <strong>the</strong> fraction<br />
of <strong>the</strong> subjects giv<strong>in</strong>g a rat<strong>in</strong>g of ‘very bad’ (correspond<strong>in</strong>g to a score<br />
of 1) <strong>for</strong> <strong>the</strong> orig<strong>in</strong>al image was plotted aga<strong>in</strong>st <strong>the</strong> fraction of <strong>the</strong><br />
subjects giv<strong>in</strong>g <strong>the</strong> same rat<strong>in</strong>g <strong>for</strong> a particular compressed image.<br />
The correspond<strong>in</strong>g cumulative fractions were calculated similarly <strong>for</strong><br />
<strong>the</strong> o<strong>the</strong>r po<strong>in</strong>ts of <strong>the</strong> curve, and <strong>the</strong> data were fitted us<strong>in</strong>g a<br />
b<strong>in</strong>ormal model [19]. The area under <strong>the</strong> ROC, A z , was taken as a<br />
measure of <strong>the</strong> relative quality of <strong>the</strong> compressed images. The level<br />
of correlation between <strong>the</strong> responses <strong>for</strong> <strong>the</strong> two compared conditions<br />
was used to determ<strong>in</strong>e <strong>the</strong> statistical significance of <strong>the</strong> difference<br />
between <strong>the</strong> areas under <strong>the</strong> two ROC curves. (A p-value of less than<br />
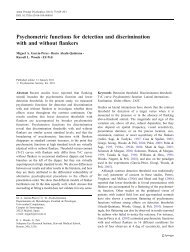
0.05 level was considered to be significant [19].) The ROC curves<br />
are shown <strong>in</strong> Figure 2. For q = 15, 35 and 50, <strong>the</strong> quality of <strong>the</strong><br />
unenhanced compressed images was <strong>in</strong>ferior to that of <strong>the</strong><br />
uncompressed images as <strong>the</strong> A z was < 0.5 (p < 0.013). For q = 60, <strong>the</strong><br />
perceived quality difference between <strong>the</strong> orig<strong>in</strong>al images and <strong>the</strong><br />
compressed images was not statistically significant (p = 0.26).<br />
There<strong>for</strong>e, <strong>in</strong> <strong>the</strong> follow<strong>in</strong>g experiments, q = 60 was used as <strong>the</strong><br />
quality factor <strong>in</strong> <strong>the</strong> <strong>JPEG</strong> compression.<br />
True postive fraction<br />
1.0<br />
0.9<br />
0.8<br />
0.7<br />
0.6<br />
0.5<br />
0.4<br />
0.3<br />
0.2<br />
0.1<br />
Data <strong>for</strong> q=15<br />
Fitt<strong>in</strong>g <strong>for</strong> q=15,p=0.0000<br />
Data <strong>for</strong> q=35<br />
Fitt<strong>in</strong>g <strong>for</strong> q=35,p=0.0000<br />
Data <strong>for</strong> q=50<br />
Fitt<strong>in</strong>g <strong>for</strong> q=50,p=0.0130<br />
Data <strong>for</strong> q=60<br />
Fitt<strong>in</strong>g <strong>for</strong> q=60,p=0.26<br />
0.0<br />
0.0 0.1 0.2 0.3 0.4 0.5 0.6 0.7 0.8 0.9 1.0<br />
False positive fraction<br />
Figure 2. ROC analysis <strong>for</strong> <strong>the</strong> choice of quality factor, q, of compressed<br />
images as compared to uncompressed orig<strong>in</strong>als. The area under <strong>the</strong> ROC, A z,<br />
is taken as a measure of <strong>the</strong> relative quality of <strong>the</strong> compressed images. The p-<br />
value <strong>in</strong>dicates <strong>the</strong> statistical significance of <strong>the</strong> difference between two areas.<br />
Only <strong>for</strong> q = 60 <strong>the</strong> perceived quality difference<br />
3
TBME-00426-2003.R1<br />
(a)<br />
(d)<br />
(b)<br />
(e)<br />
(c)<br />
(f)<br />
Figure 3. Examples of processed images: (a), (b) and (c) are samples of enhanced images; (d), (e) and (f) are difference images between<br />
<strong>the</strong> decompressed orig<strong>in</strong>al image and <strong>the</strong> enhanced image <strong>in</strong> (a), (b) and (c), respectively. Enhanced images <strong>in</strong> (a) and (b) were obta<strong>in</strong>ed<br />
us<strong>in</strong>g λ = 1.9. The enhanced image <strong>in</strong> (c) was obta<strong>in</strong>ed us<strong>in</strong>g λ = 1.5. Note, <strong>the</strong> effect of <strong>the</strong> enhancement as seen on <strong>the</strong> TV screen is<br />
more dramatic than it appears <strong>in</strong> pr<strong>in</strong>t.<br />
between <strong>the</strong> orig<strong>in</strong>al images and <strong>the</strong> compressed images was<br />
not significant; we used images <strong>with</strong> this quality factor to<br />
evaluate our enhancement technique.<br />
B. Directional enhancement<br />
In pilot experiments we noted that when enhanced images obta<strong>in</strong>ed<br />
by <strong>the</strong> non-directional enhancement method were displayed on <strong>the</strong><br />
television monitor <strong>the</strong>y produced a significant flicker<strong>in</strong>g artifact. This<br />
flicker<strong>in</strong>g did not occur when <strong>the</strong> same images were displayed on a<br />
computer display. The flicker<strong>in</strong>g was a result of field <strong>in</strong>terlac<strong>in</strong>g.<br />
While flicker<strong>in</strong>g artifacts <strong>in</strong> a s<strong>in</strong>gle <strong>in</strong>terlaced frame are well known<br />
to occur due to image motion occurr<strong>in</strong>g between <strong>the</strong> two<br />
fields, this artifact was also seen <strong>in</strong> images <strong>with</strong> m<strong>in</strong>imal or no<br />
motion. The flicker<strong>in</strong>g artifact occurred when <strong>the</strong> enhancement<br />
resulted <strong>in</strong> two abutt<strong>in</strong>g raster l<strong>in</strong>e segments <strong>with</strong> a large difference <strong>in</strong><br />
brightness. As <strong>the</strong>se segments were alternately refreshed (repeat<strong>in</strong>g at<br />
30 Hz), <strong>the</strong>y appear to move or flicker. The effect is even stronger<br />
from <strong>the</strong> shorter observation distance typically used by low vision<br />
persons (approximately 36 <strong>in</strong>ches, 91 cm). S<strong>in</strong>ce <strong>the</strong> artifact appeared<br />
to be associated only <strong>with</strong> <strong>the</strong> enhancement of vertical contrast (<strong>in</strong> <strong>the</strong><br />
spatial doma<strong>in</strong>), we applied <strong>the</strong> directional enhancement method<br />
(Section II-D), which substantially reduced <strong>the</strong>se flicker<strong>in</strong>g artifacts.<br />
4
TBME-00426-2003.R1<br />
C. <strong>Image</strong> process<strong>in</strong>g<br />
The static TV images (see Section III-E below) were<br />
compressed us<strong>in</strong>g a standard <strong>JPEG</strong> compression algorithm <strong>with</strong> <strong>the</strong><br />
quality factor of 60. The correspond<strong>in</strong>g quantization table is<br />
⎡13<br />
⎢<br />
⎢<br />
10<br />
⎢11<br />
⎢<br />
⎢11<br />
Q =<br />
⎢14<br />
⎢<br />
⎢19<br />
⎢39<br />
⎢<br />
⎢⎣<br />
58<br />
9<br />
10<br />
10<br />
14<br />
18<br />
28<br />
51<br />
74<br />
11<br />
13<br />
18<br />
30<br />
44<br />
62<br />
76<br />
13<br />
15<br />
19<br />
23<br />
45<br />
51<br />
70<br />
78<br />
The images were<br />
subsequently decompressed.<br />
In <strong>the</strong> decompression stage,<br />
<strong>the</strong> directional enhancement<br />
method (Section II-D) was<br />
applied to enhance <strong>the</strong><br />
images. Only <strong>the</strong> lum<strong>in</strong>ance<br />
component was enhanced; <strong>the</strong><br />
color components were not<br />
modified. For each <strong>JPEG</strong><br />
image, we implemented 16<br />
different process<strong>in</strong>g levels,<br />
each correspond<strong>in</strong>g to a<br />
different value of λ, rang<strong>in</strong>g<br />
from 0.1 to 1.9 (Table 1). The<br />
image <strong>with</strong> λ = 1 reproduced<br />
<strong>the</strong> orig<strong>in</strong>al decompressed unenhanced<br />
image. The levels<br />
of λ = 1.1 to 1.9 produced<br />
enhanced images while<br />
λ = 0.1 to λ = 0.9 levels<br />
resulted <strong>in</strong> low pass filter<strong>in</strong>g<br />
of <strong>the</strong> images and thus<br />
produced degraded images.<br />
Degraded images were<br />
necessary to verify that <strong>the</strong><br />
subjects were respond<strong>in</strong>g to<br />
contrast enhancement, and<br />
not just contrast modification.<br />
8<br />
19<br />
21<br />
32<br />
41<br />
54<br />
65<br />
82<br />
90<br />
32<br />
46<br />
46<br />
70<br />
87<br />
83<br />
97<br />
80<br />
41<br />
48<br />
55<br />
64<br />
82<br />
90<br />
96<br />
82<br />
49 ⎤<br />
44<br />
⎥<br />
⎥<br />
45 ⎥<br />
⎥<br />
50 ⎥<br />
62 ⎥<br />
⎥<br />
74 ⎥<br />
81 ⎥<br />
⎥<br />
79 ⎥⎦<br />
Table 1. The 16 image<br />
“enhancement” levels used <strong>in</strong><br />
procedure 1. The first 6 levels are<br />
images processed <strong>with</strong> values<br />
chosen to produce degraded<br />
images (λ < 1.0). The 7 th level is<br />
<strong>the</strong> orig<strong>in</strong>al image and <strong>the</strong> o<strong>the</strong>r 9<br />
enhancement levels are processed<br />
us<strong>in</strong>g <strong>the</strong> <strong>JPEG</strong> enhancement<br />
algorithm described here <strong>with</strong> <strong>the</strong><br />
<strong>in</strong>dicated ga<strong>in</strong> factors (λ > 1.0).<br />
Level No.<br />
Scale Factor or λ<br />
1 0.1<br />
2 0.3<br />
3 0.5<br />
4 0.7<br />
5 0.8<br />
6 0.9<br />
7 1.0<br />
8 1.1<br />
9 1.2<br />
10 1.3<br />
11 1.4<br />
12 1.5<br />
13 1.6<br />
14 1.7<br />
15 1.8<br />
16 1.9<br />
(12)<br />
The <strong>in</strong>clusion of degraded images also prevents <strong>the</strong> orig<strong>in</strong>al images<br />
from always be<strong>in</strong>g <strong>the</strong> lowest-contrast images presented. <strong>Image</strong>s were<br />
preprocessed and stored <strong>for</strong> presentation dur<strong>in</strong>g <strong>the</strong> experiment.<br />
Figure 3 shows samples of enhanced images. The pr<strong>in</strong>ted images are<br />
not a valid representation of <strong>the</strong> displayed images. In particular, <strong>the</strong><br />
pr<strong>in</strong>ted image cannot present <strong>the</strong> flicker<strong>in</strong>g effect associated <strong>with</strong> <strong>the</strong><br />
<strong>in</strong>terlaced video used <strong>in</strong> <strong>the</strong> presentation (this effect also cannot be<br />
seen when <strong>the</strong> same image is presented on a progressive display).<br />
D. <strong>Enhancement</strong> evaluation by low-vision patients<br />
Two procedures were used to exam<strong>in</strong>e <strong>the</strong> low vision<br />
patients’ appreciation of <strong>the</strong> <strong>JPEG</strong> enhanced images. In <strong>the</strong> first<br />
procedure, a subject was <strong>in</strong>structed to select <strong>the</strong> “level” (one of<br />
sixteen choices of λ) that <strong>the</strong>y considered to “look <strong>the</strong> best.” In<br />
<strong>the</strong> second procedure, <strong>the</strong> subject compared <strong>the</strong> orig<strong>in</strong>al images<br />
(The orig<strong>in</strong>al images here are unenhanced decompressed<br />
images. Because we are <strong>in</strong>terested <strong>in</strong> enhanc<strong>in</strong>g compressed<br />
images, we don’t use <strong>the</strong> images be<strong>for</strong>e compression <strong>in</strong> <strong>the</strong><br />
follow<strong>in</strong>g experiments <strong>for</strong> low-vision patients.) to <strong>the</strong> images<br />
that were processed us<strong>in</strong>g <strong>the</strong> median of <strong>the</strong> levels selected <strong>in</strong><br />
procedure 1, and <strong>the</strong> subject ranked <strong>the</strong> images on a scale of<br />
perceived quality (see detailed description of procedures 1 and 2<br />
below).<br />
Prior to test<strong>in</strong>g, each subject was asked about <strong>the</strong> size of his or<br />
her television at home, and about how close to it he or she usually<br />
sits while watch<strong>in</strong>g a program. Subjects were <strong>the</strong>n seated at a<br />
distance from our 27-<strong>in</strong>ch television test monitor that approximated<br />
<strong>the</strong> visual angle <strong>the</strong>y were accustomed to view<strong>in</strong>g <strong>the</strong>ir own set at<br />
home. This distance was reduced if <strong>the</strong> subject could not discern<br />
image changes as <strong>the</strong> enhancement level varied. For our low-vision<br />
subjects, <strong>the</strong> average seat<strong>in</strong>g distance was 36.0 ± 14.2 <strong>in</strong>ches from<br />
<strong>the</strong> television, while <strong>the</strong> standard view<strong>in</strong>g distance of a 27-<strong>in</strong>ch<br />
television would have been 105 <strong>in</strong>ches [20].<br />
Because many of <strong>the</strong> subjects were elderly, <strong>with</strong> little or no<br />
computer experience, be<strong>for</strong>e <strong>the</strong> actual experimental session <strong>the</strong>y<br />
sometimes needed a practice session to become com<strong>for</strong>table <strong>with</strong> <strong>the</strong><br />
graphics tablet and mouse. The images used <strong>in</strong> <strong>the</strong>se practice sessions<br />
were different from those used to collect <strong>the</strong> image quality data. The<br />
room was dimly lit by recessed overhead <strong>in</strong>candescent lamps, and <strong>the</strong><br />
lum<strong>in</strong>ance at <strong>the</strong> monitor surface was measured approximately 1 ftcandle.<br />
1) Procedure 1: Select<strong>in</strong>g <strong>the</strong> Preferred <strong>JPEG</strong> <strong>Enhancement</strong><br />
Level<br />
Subjects were shown a static image (drawn from a set of 10<br />
different images) on <strong>the</strong> TV screen. By mov<strong>in</strong>g <strong>the</strong> mouse up and<br />
down on <strong>the</strong> blank graphics tablet, <strong>the</strong>y could select which of <strong>the</strong> 16<br />
predeterm<strong>in</strong>ed levels of contrast adjustment were applied to <strong>the</strong><br />
image.<br />
Each subject was asked to f<strong>in</strong>d <strong>the</strong> spot on <strong>the</strong> tablet<br />
correspond<strong>in</strong>g to <strong>the</strong> image adjustment level where, “you like <strong>the</strong><br />
picture <strong>the</strong> best, where it is clearest <strong>for</strong> you, and where you got <strong>the</strong><br />
most detail out of <strong>the</strong> picture.” Once subjects found an image that<br />
looked <strong>the</strong> best to <strong>the</strong>m, <strong>the</strong>y recorded that sett<strong>in</strong>g by click<strong>in</strong>g on a<br />
mouse button. After a response, <strong>the</strong> next image from <strong>the</strong> set of 10 was<br />
displayed. For each trial, <strong>the</strong> mapp<strong>in</strong>g of <strong>the</strong> active region of <strong>the</strong><br />
graphics tablet to <strong>the</strong> enhancement level presented was randomly<br />
shifted so that <strong>the</strong> subjects were unable to associate a fixed<br />
mechanical position <strong>with</strong> <strong>the</strong>ir choices.<br />
2) Procedure 2: Perceived <strong>Image</strong> Quality<br />
The rounded median level [21] of procedure 1 was chosen as <strong>the</strong><br />
<strong>in</strong>dividually preferred enhancement level <strong>for</strong> use <strong>in</strong> procedure 2. Four<br />
versions of each of 50 images (a total of 200 images) were shown to<br />
subjects <strong>in</strong> a randomized sequence. The four versions <strong>for</strong> each image<br />
<strong>in</strong>cluded: (1) orig<strong>in</strong>al image; (2) <strong>in</strong>dividually chosen enhancement<br />
(based on procedure 1); (3) a degraded image (λ = 0.8); and (4) an<br />
image enhanced by a second arbitrarily selected enhancement level.<br />
The 50 images used <strong>in</strong> procedure 2 did not <strong>in</strong>clude <strong>the</strong> 10 used <strong>in</strong><br />
procedure 1.<br />
The second arbitrarily selected enhancement level was selected<br />
to supply ano<strong>the</strong>r enhancement which had a different appearance<br />
from <strong>the</strong> level selected by <strong>the</strong> patient. The second arbitrarily selected<br />
enhancement level was chosen to be several levels above <strong>the</strong><br />
<strong>in</strong>dividually-selected enhancement level <strong>for</strong> those who selected a low<br />
level of enhancement, and several levels below <strong>the</strong> <strong>in</strong>dividuallyselected<br />
enhancement level <strong>for</strong> patients who selected a high level of<br />
enhancement. Table 2 lists <strong>the</strong> possible <strong>in</strong>dividually chosen<br />
enhancement levels and <strong>the</strong> correspond<strong>in</strong>g second selected<br />
enhancement levels.<br />
5
TBME-00426-2003.R1<br />
By mov<strong>in</strong>g <strong>the</strong> mouse vertically on <strong>the</strong> graphics tablet, <strong>the</strong><br />
subjects rated <strong>the</strong> quality of each enhanced image aga<strong>in</strong>st an<br />
unenhanced version of <strong>the</strong> same image. The subjects were asked to<br />
rank each image as “better,” “slightly better,” “typical,” “slightly<br />
worse,” or “worse” than <strong>the</strong> orig<strong>in</strong>al image, <strong>with</strong> <strong>the</strong>se rank<strong>in</strong>gs<br />
pr<strong>in</strong>ted <strong>in</strong> large font on <strong>the</strong> graphics tablet, <strong>with</strong> “better” near <strong>the</strong> top<br />
of <strong>the</strong> tablet, and “worse” near <strong>the</strong> bottom. Be<strong>for</strong>e <strong>the</strong> computer<br />
accepted <strong>the</strong>ir score, <strong>the</strong> subjects were required to compare <strong>the</strong> test<br />
image to <strong>the</strong> orig<strong>in</strong>al image at least once by mov<strong>in</strong>g <strong>the</strong> mouse to a<br />
designated section at <strong>the</strong> right edge of <strong>the</strong> tablet marked by a black<br />
stripe, <strong>the</strong>reby display<strong>in</strong>g <strong>the</strong> orig<strong>in</strong>al image. Once this was viewed,<br />
<strong>the</strong> subject was allowed to grade <strong>the</strong> test image. If desired, subjects<br />
could view <strong>the</strong> orig<strong>in</strong>al image and compare it <strong>with</strong> <strong>the</strong> test image<br />
multiple times.<br />
Table 2. The available <strong>in</strong>dividually chosen<br />
enhancement levels and <strong>the</strong>ir correspond<strong>in</strong>g<br />
second arbitrarily selected enhancement levels.<br />
Individually<br />
chosen<br />
enhancement<br />
E. <strong>Image</strong> Acquisition<br />
Second arbitrarily<br />
selected enhancement<br />
Level 1 10<br />
Level 2 10<br />
Level 3 10<br />
Level 4 11<br />
Level 5 12<br />
Level 6 12<br />
Level 7<br />
12<br />
(Orig<strong>in</strong>al)<br />
Level 8 12<br />
Level 9 12<br />
Level 10 13<br />
Level 11 13<br />
Level 12 14<br />
Level 13 16<br />
Level 14 12<br />
Level 15 12<br />
Level 16 12<br />
S<strong>in</strong>gle video frames (static images) were randomly grabbed from<br />
various shows on cable television channels <strong>in</strong> Boston, Massachusetts<br />
on June 26, 2000. The frames were captured us<strong>in</strong>g a Video Toaster<br />
card [22] as 480 x 720 x 3 RGB bitmap images. They were converted<br />
us<strong>in</strong>g Matlab [23] to RTV <strong>for</strong>mat <strong>for</strong> presentation on a TV monitor<br />
us<strong>in</strong>g a SpeedRazor graphics card [24]. Of <strong>the</strong> 200 digitized images<br />
acquired, 127 were judged by 2 normally-sighted observers to<br />
conta<strong>in</strong> little or no apparent motion due to differences between <strong>the</strong> 2<br />
<strong>in</strong>terlaced fields. Fifty of <strong>the</strong>se were selected randomly <strong>for</strong> <strong>the</strong> study.<br />
F. Apparatus<br />
All process<strong>in</strong>g, experiment control, and analysis were done<br />
us<strong>in</strong>g an Intel PC runn<strong>in</strong>g W<strong>in</strong>dows NT 4.0 (Service Pack 6). <strong>Image</strong>s<br />
were displayed on a 27-<strong>in</strong>ch (diagonal) Sony Tr<strong>in</strong>itron NTSC <strong>for</strong>mat<br />
television monitor us<strong>in</strong>g a Video Toaster image process<strong>in</strong>g system<br />
[22], under <strong>the</strong> control of programs written <strong>in</strong> Microsoft Visual Basic<br />
and Matlab [23]. In procedure 1, subjects moved <strong>the</strong> mouse over a<br />
12-<strong>in</strong>ch SummaSketch III [25] graphics tablet device to select<br />
enhancement levels. The same tablet was used to grade <strong>the</strong> images <strong>in</strong><br />
procedure 2, as described above. In both experiments, subjects<br />
designated <strong>the</strong>ir f<strong>in</strong>al choice by press<strong>in</strong>g <strong>the</strong> mouse button.<br />
G. Data Analysis<br />
Data from procedure 2 was analyzed us<strong>in</strong>g <strong>the</strong> ROC signal<br />
detection approach [26] described above. The Rockit program<br />
[19,27] was used to determ<strong>in</strong>e <strong>the</strong> area under <strong>the</strong> fitted ROC curve,<br />
A z [28]. Paired comparisons were made between responses to <strong>the</strong><br />
orig<strong>in</strong>al images and a set of correspond<strong>in</strong>g processed images. As<br />
<strong>the</strong>re were three sets of processed images <strong>for</strong> each subject, three ROC<br />
curves were computed (see Figure 4), represent<strong>in</strong>g <strong>the</strong> perceived<br />
image quality of each of <strong>the</strong> process<strong>in</strong>g options as compared <strong>with</strong> <strong>the</strong><br />
orig<strong>in</strong>al.<br />
In traditional ROC analysis, system (e.g. subject) responses to<br />
“noise” presentations and to “noise-plus-signal” presentations are<br />
compared. In our study, <strong>the</strong> orig<strong>in</strong>al images are treated as <strong>the</strong> noise<br />
presentations, and <strong>the</strong> processed versions are treated as <strong>the</strong> noiseplus-signal<br />
presentations. As can be seen <strong>in</strong> Figure 4, our raw data<br />
consisted of multiple distributions along <strong>the</strong> perceived image quality<br />
dimension (<strong>for</strong> simplicity, Figure 4 only shows data <strong>for</strong> 3 of <strong>the</strong> 4<br />
Figure 4. One patient’s distribution of responses to <strong>the</strong> orig<strong>in</strong>al, chosen<br />
enhancement, and degraded images. For simplicity, <strong>the</strong> responses to <strong>the</strong><br />
second enhancement are not <strong>in</strong>cluded. The responses are taken from <strong>the</strong><br />
graphics tablet read<strong>in</strong>gs and quantized to <strong>the</strong> range 0 to 10, where 0<br />
represents a score of “worse” and 10 represents “better” <strong>in</strong> comparison to <strong>the</strong><br />
orig<strong>in</strong>al image. These data were <strong>for</strong> a patient who clearly preferred <strong>the</strong><br />
enhancement; <strong>the</strong> three distributions are clearly separated. These data were<br />
used to construct <strong>the</strong> ROC curves shown <strong>in</strong> panel (a) of Figure 5.<br />
image sets). When <strong>the</strong> perceived image quality of <strong>the</strong> processed<br />
images was higher than <strong>the</strong> orig<strong>in</strong>al images (level 9 image set <strong>in</strong><br />
Figure 5(a)), A z was greater than 0.5. For <strong>the</strong> degraded image set, <strong>the</strong><br />
perceived image quality distribution was lower than that of <strong>the</strong><br />
orig<strong>in</strong>al images, creat<strong>in</strong>g an A z of less than 0.5. Our ROC analysis<br />
measures perceived relative image quality, and not enhancement<br />
detection, as might be done <strong>in</strong> ano<strong>the</strong>r application. Consequently, <strong>the</strong><br />
traditional labels of <strong>the</strong> axes of <strong>the</strong> ROC figure (e.g. true-positive<br />
fraction, or “hit” rate) do not to represent our situation. In our<br />
analysis, <strong>the</strong> true-positive fraction dimension is <strong>the</strong> proportion of <strong>the</strong><br />
processed image set <strong>with</strong> a higher perceived image quality than <strong>the</strong><br />
orig<strong>in</strong>al images, while <strong>the</strong> false-positive fraction (“false-alarm” rate)<br />
dimension is <strong>the</strong> equivalent proportion <strong>for</strong> <strong>the</strong> orig<strong>in</strong>al images<br />
perceived as hav<strong>in</strong>g higher quality than <strong>the</strong> processed images (a<br />
‘higher’ quality be<strong>in</strong>g relative to <strong>the</strong> criterion used <strong>for</strong> <strong>the</strong> particular<br />
po<strong>in</strong>t on <strong>the</strong> ROC curve). However, we use <strong>the</strong> traditional axis labels<br />
as shown <strong>in</strong> Figure 5.<br />
6
TBME-00426-2003.R1<br />
While <strong>the</strong> graphics tablet gives a cont<strong>in</strong>uous response measure,<br />
<strong>for</strong> some subjects, <strong>the</strong> responses were multi-modal, a consequence of<br />
<strong>the</strong> large-font guide words on <strong>the</strong> tablet (many subjects did not<br />
<strong>in</strong>terpolate between <strong>the</strong> five words). The data shown <strong>in</strong> figure 4 has a<br />
slight tendency towards this multi-modal response pattern. In<br />
addition, often <strong>the</strong> response distributions were not normally<br />
distributed. Even so, <strong>the</strong> Rockit program appeared to give a<br />
reasonable fit to our data <strong>in</strong> most cases (Figure 5). The Rockit<br />
program provides confidence limits <strong>for</strong> each ROC curve area [28],<br />
and <strong>the</strong>se were used to determ<strong>in</strong>e <strong>the</strong> significance of <strong>the</strong> responses of<br />
<strong>in</strong>dividual subjects to a particular type of image process<strong>in</strong>g.<br />
S<strong>in</strong>ce <strong>the</strong> image enhancement levels used <strong>in</strong> procedure 1 were<br />
ordered but <strong>the</strong> perceptual <strong>in</strong>tervals were not necessarily equal, nonparametric<br />
statistical tests were used <strong>for</strong> <strong>the</strong>se comparisons. A z data<br />
distributions from procedure 2 were found to be approximately<br />
normally distributed, and thus parametric statistical tests were used<br />
<strong>for</strong> <strong>the</strong>se comparisons.<br />
as did all o<strong>the</strong>rs, clearly rejected <strong>the</strong> degraded images (A z = 0.01). (b) A more<br />
typical example <strong>in</strong> which only slight and not statistically significant<br />
preference was found <strong>for</strong> <strong>the</strong> chosen enhancement: a patient <strong>with</strong> Ret<strong>in</strong>itis<br />
Pigmentosa (visual acuity 20/83). Here, preference <strong>for</strong> <strong>the</strong> chosen<br />
enhancement (level = 8,A z = 0.61) was slightly but not significantly higher<br />
than <strong>for</strong> <strong>the</strong> orig<strong>in</strong>al. This subject showed no significant preference <strong>for</strong> <strong>the</strong><br />
second enhancement level = 12 (A z = 0.37), and also rejected <strong>the</strong> degraded<br />
image (level = 5, A z = 0.002). Note that <strong>the</strong> ROC data shown <strong>in</strong> panel (a) is<br />
constructed from distribution of data shown <strong>in</strong> Figure 4.<br />
H. Subjects<br />
Patients were recruited from cl<strong>in</strong>ical practices that concentrated<br />
on ret<strong>in</strong>al diseases, and most had central ret<strong>in</strong>al dysfunction from<br />
such diseases as age related macular degeneration. All patients signed<br />
a subject consent <strong>for</strong>m, approved by IRB committee. All <strong>in</strong>cluded<br />
subjects were at least 18 years of age, able to read and understand <strong>the</strong><br />
consent <strong>for</strong>m, able to follow verbal <strong>in</strong>structions <strong>in</strong> English, and were<br />
not suffer<strong>in</strong>g from a condition, such as arthritis, that might <strong>in</strong>hibit<br />
<strong>the</strong>ir ability to control <strong>the</strong> mouse. We did not recruit low-vision<br />
subjects who use a telescope device to view television. Subjects<br />
viewed <strong>the</strong> TV images <strong>with</strong> both eyes.<br />
Visual acuity was measured us<strong>in</strong>g a BVAT (Model No. 22-<br />
4850, Mentor O&O Inc). Visual fields were measured us<strong>in</strong>g a Bausch<br />
& Lomb Auto-Plot Tangent Screen (Cat. No. 71-54-41) to document<br />
central field loss (CFL). Visual fields were measured monocularly,<br />
us<strong>in</strong>g a 6 mm target at 1 meter, <strong>with</strong> <strong>the</strong> subject wear<strong>in</strong>g habitual<br />
distance correction (e.g. glasses). Some of <strong>the</strong> patients did not<br />
undergo <strong>the</strong> visual field tests but had a clear diagnosis of macular<br />
lesions account<strong>in</strong>g <strong>for</strong> <strong>the</strong>ir acuity loss and thus were presumed to<br />
have CFL. One subject of <strong>the</strong> 48 total subjects who were referred did<br />
not meet <strong>the</strong> study <strong>in</strong>clusion criteria. The rema<strong>in</strong><strong>in</strong>g subjects (Group<br />
A, N = 47) completed procedure 1. Due to cl<strong>in</strong>ical schedules and<br />
physical constra<strong>in</strong>ts (such as age-related stam<strong>in</strong>a), fewer subjects also<br />
completed procedure 2 (Group B, N = 27). Table 3 shows <strong>the</strong><br />
characteristics and numbers of subjects that completed <strong>the</strong> two<br />
portions of <strong>the</strong> experiment.<br />
(a)<br />
Table 3. The cl<strong>in</strong>ical characteristics of <strong>the</strong> participat<strong>in</strong>g patients. Due to<br />
schedule constra<strong>in</strong>ts and o<strong>the</strong>r factors only some of <strong>the</strong> patients who<br />
completed procedure 1 (Group A) also completed procedure 2 (Group B). N is<br />
<strong>the</strong> number of subjects <strong>in</strong> each group, and CFL is <strong>the</strong> number of subjects who<br />
had documented central visual field loss <strong>in</strong> both eyes.<br />
Group N Age (years)<br />
Average ± SD<br />
Median (Range)<br />
VA (Log MAR)<br />
Average ± SD<br />
Median (range)<br />
CFL<br />
A 47<br />
61.8 ± 20.0<br />
68.5 (19.2-86.5)<br />
0.93 ± 0.31<br />
0.88 (0.50-2.10)<br />
32<br />
B 27 59.5 ± 20.4<br />
68.1 (20.8-86.5)<br />
0.99 ± 0.37<br />
0.96 (0.50-1.20)<br />
15<br />
IV. RESULTS<br />
(b)<br />
Figure 5. The ROC fitted curves <strong>for</strong> two patients. The thick l<strong>in</strong>es are <strong>the</strong> fits<br />
to <strong>the</strong> filled triangular symbols (<strong>the</strong> chosen enhancement level) and <strong>the</strong> th<strong>in</strong><br />
l<strong>in</strong>es are <strong>the</strong> fits to <strong>the</strong> open square symbols (<strong>the</strong> second enhancement level<br />
tested). The dotted l<strong>in</strong>es are <strong>the</strong> fits to <strong>the</strong> filled diamond symbols (degraded<br />
image). (a) A patient <strong>with</strong> Optic Atrophy (visual acuity 20/250) who clearly<br />
favored <strong>the</strong> chosen enhancement (level = 9,A z = 0.83), and showed no<br />
preference <strong>for</strong> <strong>the</strong> second enhancement (level = 12, A z = 0.49). This patient,<br />
A. Reduction of block artifacts by image enhancement <strong>in</strong><br />
<strong>JPEG</strong> doma<strong>in</strong><br />
Figure 6 provides a comparison of <strong>JPEG</strong> based enhancement <strong>with</strong><br />
standard post-compression enhancement of a <strong>JPEG</strong> compressed<br />
image. To better illustrate <strong>the</strong> effects <strong>in</strong> pr<strong>in</strong>t, we show an enlarged<br />
partial image of <strong>the</strong> familiar “Lena” image. Figure 6(a) shows <strong>the</strong><br />
orig<strong>in</strong>al (uncompressed) image, while Figure 6(b) is a <strong>JPEG</strong><br />
decompressed image <strong>with</strong>out enhancement <strong>with</strong> a Peak Signal-to-<br />
7
TBME-00426-2003.R1<br />
Noise Ratio (PSNR) of 35.4 dB (q = 60) [20]. Only m<strong>in</strong>or<br />
degradation is evident <strong>with</strong> this level of compression. Figure 6(c)<br />
shows <strong>the</strong> decompressed image enhanced us<strong>in</strong>g conventional postcompression<br />
enhancement <strong>with</strong> Pa<strong>in</strong>t Shop Pro TM [29], apply<strong>in</strong>g <strong>the</strong><br />
<strong>Image</strong>-Sharpen tool four times recursively. This produce similar<br />
contrast enhancement to <strong>the</strong> λ = 1.35 comparison images. As seen <strong>in</strong><br />
Figure 6(c) this process<strong>in</strong>g results <strong>in</strong> a high pass filter<strong>in</strong>g contrast<br />
enhanc<strong>in</strong>g effect but also causes an obvious <strong>in</strong>crease <strong>in</strong> block<br />
artifacts. Figure 6(d) shows <strong>the</strong> result of <strong>the</strong> <strong>JPEG</strong> based<br />
enhancement applied <strong>in</strong> <strong>the</strong> decod<strong>in</strong>g stage. <strong>Enhancement</strong> <strong>with</strong><br />
λ = 1.35 was used to produce a similar enhancement effect to that of<br />
Figure 6(c), but, as is evident <strong>in</strong> <strong>the</strong> figure, that level of enhancement<br />
is achieved <strong>with</strong> less severe block artifacts.<br />
B. Experimental results <strong>for</strong> low-vision patients<br />
Figure 7 is <strong>the</strong> histogram of <strong>the</strong> selected preferred enhancement level<br />
<strong>in</strong> procedure 1 (Group A, N = 47). The median preferred level<br />
selected was 8, correspond<strong>in</strong>g to λ = 1.1(25% quartile: level 7, 75%<br />
quartile: level 10), which was significantly different from <strong>the</strong> orig<strong>in</strong>al<br />
image level of 7 (Wilcoxon signed-rank test, Z 34 = 3.831,<br />
p < 0.0001). The enhancement levels that <strong>the</strong> patients selected were<br />
not correlated <strong>with</strong> <strong>the</strong>ir visual acuities (r = 0.030, p = 0.842). Seven<br />
patients preferred <strong>the</strong> orig<strong>in</strong>al image <strong>with</strong>out enhancement (λ = 1).<br />
Eleven of <strong>the</strong> 47 patients actually selected degraded images, although<br />
only mildly degraded images were selected (most chose λ = 0.9 <strong>with</strong><br />
only 2 patients select<strong>in</strong>g λ = 0.8). It is likely that <strong>the</strong> patients could<br />
not differentiate <strong>the</strong>se low level degradations from <strong>the</strong> orig<strong>in</strong>al<br />
images. In response to our questions and often spontaneously, all of<br />
<strong>the</strong> patients who selected degraded images reported that <strong>the</strong> enhanced<br />
images appeared <strong>the</strong> same or were not as clear as <strong>the</strong> orig<strong>in</strong>al images.<br />
Most of <strong>the</strong> 29 (62%) subjects who selected enhanced images<br />
reported, <strong>in</strong> response to questions or spontaneously, that <strong>the</strong><br />
enhanced images were clearer, sharper, and easier to see than <strong>the</strong><br />
orig<strong>in</strong>al ones.<br />
Twenty of <strong>the</strong> 27 subjects who completed both procedures 1 and 2<br />
repeated procedure 1 after complet<strong>in</strong>g procedure 2. For this group,<br />
(a)<br />
(c)<br />
(b)<br />
(d)<br />
Figure 6. The effect of enhancement on block artifacts. (a) The orig<strong>in</strong>al “Lena” image. Note that <strong>the</strong> image is a magnified partial<br />
face image. (b) The <strong>JPEG</strong> decompressed image <strong>with</strong>out enhancement (PSNR = 35.4 dB, q = 60). Only m<strong>in</strong>or degradation is<br />
evident <strong>with</strong> this level of compression. (c) The compressed image of (b) enhanced <strong>with</strong> conventional graphics software (Pa<strong>in</strong>t Shop<br />
Pro TM ) (PSNR = 19.9 dB). Note <strong>the</strong> clear visibility of block artifacts <strong>in</strong> <strong>the</strong> image. (d) <strong>Image</strong> enhanced <strong>with</strong> <strong>the</strong> proposed <strong>JPEG</strong><br />
based enhancement, λ = 1.35 (PSNR = 21.1 dB). Note <strong>the</strong> similar contrast enhancement compared to (c) <strong>with</strong> fewer block artifacts.<br />
8
TBME-00426-2003.R1<br />
<strong>the</strong> median score of <strong>the</strong>ir first selection was 8.5 and <strong>the</strong> median<br />
selection on repeat was 8.0, this difference was not significant. The<br />
<strong>in</strong>dividual selections <strong>in</strong> <strong>the</strong> two repeats were highly correlated<br />
(r = 0.764, p < 0.0001).<br />
different than <strong>the</strong> A z <strong>with</strong> <strong>the</strong> second enhancement (paired sample T<br />
test, t = 6.745, p < 0.0001) and <strong>the</strong> degraded enhancement (t = 4.870,<br />
p < 0.0001), but <strong>the</strong> second enhancement was not significantly<br />
statistically different than <strong>the</strong> A z <strong>with</strong> <strong>the</strong> degraded enhancement<br />
(t = 0.802, p = 0.430).<br />
Figure 7. Preferred enhancement level distribution found <strong>in</strong> procedure 1<br />
<strong>for</strong> Group A (N = 47) and Group B (N 27). The two groups did not<br />
significantly differ <strong>in</strong> <strong>the</strong>ir selections of enhancement level (25% level = 7<br />
and 6.5, respectively, median level = 8 <strong>for</strong> both, 75% level = 10 <strong>for</strong> both).<br />
Note that few patients selected degraded images and <strong>the</strong>n only images <strong>with</strong><br />
slight degradation were selected.<br />
In procedure 2, patients viewed 50 images, each <strong>with</strong> <strong>the</strong>ir<br />
<strong>in</strong>dividually-chosen level of enhancement, <strong>with</strong> an arbitrarily selected<br />
level of enhancement (Table 2) and a degraded version of <strong>the</strong> image<br />
(level 5, λ = 0.8). The patients compared each of <strong>the</strong>se images to an<br />
unenhanced version and <strong>in</strong>dicated a comparative perceived image<br />
quality us<strong>in</strong>g <strong>the</strong> graphics tablet. The measurements <strong>for</strong> each of <strong>the</strong><br />
three image versions were quantized to eleven levels and converted to<br />
ROC curves each <strong>with</strong> an associated area, A z . Figure 5 shows <strong>the</strong><br />
results <strong>for</strong> two subjects. One patient clearly favored <strong>the</strong> images <strong>with</strong><br />
<strong>the</strong> chosen enhancement (this was <strong>the</strong> only patient who had such a<br />
clear appreciation of <strong>the</strong> enhancement). The o<strong>the</strong>r patient only<br />
slightly preferred <strong>the</strong> enhanced image and that effect was not<br />
statistically significant. These latter responses are similar to those of<br />
most of <strong>the</strong> patients. The degraded (λ = 0.8) images were clearly<br />
rejected by all patients <strong>in</strong> this procedure.<br />
If <strong>the</strong> quality of enhanced images was judged to be superior to that<br />
of <strong>the</strong> orig<strong>in</strong>al images, A z (<strong>the</strong> area under <strong>the</strong> ROC curve) would be<br />
larger than 0.50. Seven subjects of twenty-seven had A z greater than<br />
0.5 <strong>for</strong> <strong>the</strong>ir <strong>in</strong>dividually selected enhancement level, but <strong>the</strong><br />
difference was statistically significant <strong>for</strong> only one of <strong>the</strong>se subjects<br />
(A z = 0.83, Asymmetric 95% Confidence Interval (0.74, 0.90)). The<br />
average A z <strong>for</strong> group B was 0.38 ± 0.19.<br />
Although most subjects <strong>in</strong>dicated a preference <strong>for</strong> a particular<br />
<strong>JPEG</strong> enhancement <strong>in</strong> procedure 1, most did not f<strong>in</strong>d <strong>in</strong>dividuallyselected<br />
enhancements to be much better than <strong>the</strong> orig<strong>in</strong>al images. In<br />
procedure 2, subjects also viewed a second arbitrarily selected<br />
enhancement along <strong>with</strong> <strong>in</strong>tentionally degraded images. This allowed<br />
us to <strong>in</strong>vestigate <strong>the</strong> validity of our psychophysical method. If our<br />
method was flawed, we might expect that <strong>the</strong> subjects would not<br />
report a difference <strong>in</strong> image quality <strong>for</strong> <strong>the</strong>se o<strong>the</strong>r image sets. All of<br />
<strong>the</strong> subjects did <strong>in</strong>dicate that <strong>the</strong> second enhancement set had less<br />
image quality (A z = 0.20 ± 0.16), and all <strong>in</strong>dicated that <strong>the</strong> degraded<br />
images had lower quality scores (A z = 0.18 ± 0.15) than <strong>the</strong> orig<strong>in</strong>al<br />
images, even though a very modest level of degradation was used.<br />
The A z <strong>for</strong> chosen enhancement was statistically significantly<br />
V. CONCLUSION<br />
An image enhancement algorithm <strong>for</strong> low-vision patients <strong>in</strong> <strong>the</strong><br />
<strong>JPEG</strong> doma<strong>in</strong> has been proposed and implemented. The algorithm,<br />
which was tested here on static images, is <strong>in</strong>tended <strong>for</strong> use <strong>with</strong><br />
mov<strong>in</strong>g video sequences and can be easily applied to MPEG video<br />
<strong>for</strong>mats that <strong>in</strong>clude a <strong>JPEG</strong>-like cod<strong>in</strong>g.<br />
The proposed algorithm has numerous advantages. The<br />
computational cost is very low, s<strong>in</strong>ce it needs only to filter <strong>the</strong><br />
quantization table <strong>in</strong> <strong>the</strong> decompression stage (64 multiplications),<br />
allow<strong>in</strong>g <strong>for</strong> a real-time implementation. Because <strong>the</strong> enhancement is<br />
post-compression and could be implemented <strong>in</strong> <strong>the</strong> user’s TV<br />
receiver, it could be adjusted manually by low-vision patients via a<br />
remote control unit. This would permit <strong>in</strong>dividual enhancement tuned<br />
to <strong>the</strong> patients’ visual loss and would allow adjustment <strong>in</strong> response to<br />
<strong>the</strong> differ<strong>in</strong>g spatial content of images.<br />
Experimental results have shown that most low vision patients<br />
select a moderate level of enhancement when view<strong>in</strong>g still images<br />
displayed on a television monitor. Surpris<strong>in</strong>gly <strong>in</strong> procedure 2, when<br />
<strong>the</strong> patients compared <strong>the</strong>ir <strong>in</strong>dividually selected enhancement to <strong>the</strong><br />
orig<strong>in</strong>al, only one subject showed a significant level of preference.<br />
The reasons <strong>for</strong> this dichotomy between <strong>the</strong> results of <strong>the</strong> two<br />
procedures are not clear and will require fur<strong>the</strong>r <strong>in</strong>vestigation.<br />
Patients remarked that <strong>the</strong>y preferred to see natural-look<strong>in</strong>g images,<br />
and that <strong>the</strong> enhanced images were, to some extent, distorted.<br />
Whenever <strong>the</strong> patients could notice <strong>the</strong> distortion as such, <strong>the</strong>y<br />
rejected it. The specific filter implemented <strong>in</strong> this study (Equation 11)<br />
provides a uni<strong>for</strong>m contrast enhancement <strong>for</strong> all frequencies (though<br />
anisotropic). While this concept is simple and <strong>the</strong> result<strong>in</strong>g filter has<br />
an elegantly simple (s<strong>in</strong>gle parameter) structure, it may be a less than<br />
optimal way of enhanc<strong>in</strong>g images <strong>for</strong> <strong>the</strong> visually impaired; a limited<br />
band enhancement filter might be more effective s<strong>in</strong>ce it reduces <strong>the</strong><br />
distortions [30]. In addition, s<strong>in</strong>ce most low vision patients are<br />
completely unable to see very high frequencies, it might be better to<br />
actually suppress <strong>the</strong>se frequencies as <strong>the</strong>y can cause visible<br />
quantization artifacts, potentially <strong>with</strong>out benefit. In addition <strong>the</strong><br />
patients found <strong>the</strong> <strong>in</strong>terlace artifacts <strong>in</strong> our static images to be<br />
particularly bo<strong>the</strong>rsome. When compared to frozen s<strong>in</strong>gle frames,<br />
<strong>in</strong>terlace artifacts are much less noticeable <strong>in</strong> mov<strong>in</strong>g images; mov<strong>in</strong>g<br />
videos might not be as objectionable <strong>with</strong> enhancement.<br />
Implementation and test<strong>in</strong>g of this concept <strong>with</strong> mov<strong>in</strong>g video will be<br />
<strong>the</strong> topic of fur<strong>the</strong>r study.<br />
ACKNOWLEDGMENT<br />
The authors thank Robert B Goldste<strong>in</strong> <strong>for</strong> programm<strong>in</strong>g help and<br />
Avni Vora <strong>for</strong> help<strong>in</strong>g to run <strong>the</strong> patient experiments.<br />
REFERENCES<br />
[1] Louis Harris and Associates, I., The Lighthouse National Survey on<br />
<strong>Vision</strong> Loss: The experience, attitudes, and knowledge of middle-aged<br />
and older Americans. 1995, The Lighthouse, Inc.<br />
[2] E. Peli, E. M. F<strong>in</strong>e, and K. Pisano, "Video enhancement of text and<br />
movies <strong>for</strong> <strong>the</strong> visually impaired," <strong>in</strong> Low <strong>Vision</strong>:Research and New<br />
Developments <strong>in</strong> Rehabilitation, A. C. Kooijman, P. L. Looijestijn, J. A.<br />
Well<strong>in</strong>g, and G. J. van der Wildt, eds. IOS Press, Amsterdam, pp. 191–<br />
198,1994.<br />
9
TBME-00426-2003.R1<br />
[3] T. B. Lawton, "<strong>Image</strong> enhancement filters significantly improve read<strong>in</strong>g<br />
per<strong>for</strong>mance <strong>for</strong> low-vision observers," Ophthalmic and Physiological<br />
Optics, vol. 12, pp 93-200, 1992.<br />
[4] E. Peli, "Perceived quality of video enhanced <strong>for</strong> <strong>the</strong> visually impaired,"<br />
<strong>in</strong> <strong>Vision</strong> Science and Its Applications. Santa Fe, New Mexico, pp. 46-<br />
48, 1999.<br />
[5] E. Peli and T. Peli, "<strong>Image</strong> enhancement <strong>for</strong> <strong>the</strong> visually impaired,"<br />
Optical eng<strong>in</strong>eer<strong>in</strong>g, vol. 23, pp. 47-51, 1984.<br />
[6] E. Peli, "Simple 1-D image enhancement <strong>for</strong> head-mounted low-vision<br />
aid," Visual Impairment Research, vol. 1, pp. 3-10, 1999.<br />
[7] L. Isenberg, A. Luebker, and G. Legge, "<strong>Image</strong> enhancement of faces <strong>for</strong><br />
normal and low vision," Invest Ophthalmol Vis Sci, vol. 30 (suppl):<br />
396, 1989.<br />
[8] E. Peli, R. Goldste<strong>in</strong>, B. Young, C. Trempe, S. Buzney, "<strong>Image</strong><br />
enhancement <strong>for</strong> <strong>the</strong> visually impaired: simulations and experimental<br />
results," Invest Ophthalmol Vis Sci, vol. .32, pp. 2337-2350,<br />
1991.<br />
[9] E. F<strong>in</strong>e, E. Peli, "<strong>Enhancement</strong> of text <strong>for</strong> <strong>the</strong> visually impaired," J.<br />
Optical Soc. Am. A, vol. 12, pp. 1439-1447, 1995.<br />
[10] J. Kim, and E. Peli, "MPEG based image enhancement <strong>for</strong> people <strong>with</strong><br />
low vision," <strong>in</strong> SID 2003. Baltimore, MD, 2003, pp. 1156-1159.<br />
[11] O. Hader, A.Stern and R. Koresh, "<strong>Enhancement</strong> of an image<br />
compression algorithm by pre- and post-filter<strong>in</strong>g," Optical Eng<strong>in</strong>eer<strong>in</strong>g,<br />
vol. 40, pp. 193-199, 2001.<br />
[12] E. Peli, "Contrast <strong>in</strong> complex images," J Optical Soc Am A, vol. 7, pp.<br />
2032-2040, 1990.<br />
[13] A. Toet, "Multiscale contrast enhancement <strong>with</strong> application to image<br />
fusion," Optical Eng<strong>in</strong>eer<strong>in</strong>g, vol. 31, pp. 1026-1031, 1992.<br />
[14] V. Bhaskaran and K. Konstant<strong>in</strong>ides, <strong>Image</strong> and Video Compression<br />
Standards: Algorithms and Architecture, Kluwer Academic Publishers,<br />
1995.<br />
[15] R. Ansari and N. Memon, "The <strong>JPEG</strong> lossy image compression<br />
standard," <strong>in</strong> Handbook of <strong>Image</strong> and Video Process<strong>in</strong>g, Academic<br />
Press, pp. 513-526, 2000.<br />
[16] J. Tang, E. Peli, and S. Acton, " <strong>Image</strong> <strong>Enhancement</strong> Us<strong>in</strong>g A Contrast<br />
Measure <strong>in</strong> <strong>the</strong> Compressed Doma<strong>in</strong>," IEEE Signal Process<strong>in</strong>g Letters,<br />
vol. 10, pp. 289-292, 2003.<br />
[17] A. Beghcladi and A.L.Negrate, "Contrast enhancement technique based<br />
on local detection of edges," Computer vision, Graphics, <strong>Image</strong><br />
Process<strong>in</strong>g, vol. 46, pp. 162-274, 1989.<br />
[18] W.M.Morrow and et al, "Region-based contrast <strong>Enhancement</strong> of<br />
Mammograms," IEEE Trans. On Medical Imag<strong>in</strong>g, vol. 11, pp. 392-<br />
406, 1992.<br />
[19] The software used <strong>in</strong> <strong>the</strong> ROC analysis is available at<br />
http://www-radiology.uchicago.edu/krl/toppage11.htm.<br />
[20] M. Ardito et al., "Preferred view<strong>in</strong>g distance and display parameters," <strong>in</strong><br />
MOSAIC Handbook, pp. 165-181, 1996.<br />
[21] J. Freund, and B. Perles, "A New Look at Quartiles of Ungrouped Data,"<br />
The American Statistician, vol. 41, pp. 200-203, 1987.<br />
[22] NewTek, VideoToaster. 1998, NewTek: San Antonio, TX.<br />
[23] MathWorks, MatLab <strong>Image</strong> Process<strong>in</strong>g Toolbox. 1997, MathWorks:<br />
Natick, MA.<br />
[24] In:Sync, Speed Razor. 1999, In: Sync: Be<strong>the</strong>sda, MD.<br />
[25] GTO CalComp, I., SummaSketch III. 1989, GTO CalComp, Inc.<br />
Columbia, MD.<br />
[26] N. Macmillan and C. Creelman, Detection <strong>the</strong>ory: A user's guide,<br />
Cambridge University Press, 1991.<br />
[27] C. Metz, P. Wang, and H. Kronman, "A new approach <strong>for</strong> test<strong>in</strong>g <strong>the</strong><br />
significance of differences between ROC curves measured from<br />
correlated data," <strong>in</strong> Proceed<strong>in</strong>gs of <strong>the</strong> VIII Conference on In<strong>for</strong>mation<br />
Process<strong>in</strong>g <strong>in</strong> Medical Imag<strong>in</strong>g. The Hague, 1983.<br />
[28] J. Hanley, B. McNeil, "The mean<strong>in</strong>g and use of <strong>the</strong> area under a receiver<br />
operat<strong>in</strong>g characteristic (ROC) curve," Radiology, vol. 143, pp. 29-36<br />
,1982.<br />
[29] "http://www.jasc.com/products/psp/".<br />
[30] E. Peli, "Limitations of image enhancement <strong>for</strong> <strong>the</strong> visually impaired,"<br />
Optometry and Visual Science, vol. 69, pp. 15-24, 1992.<br />
J<strong>in</strong>shan Tang received his Ph.D. degree from<br />
Beij<strong>in</strong>g University of Posts and<br />
Telecommunications, P.R. Ch<strong>in</strong>a, <strong>in</strong> 1998. From<br />
September 1998 to June 2000, he worked as an<br />
<strong>in</strong>vited researcher <strong>in</strong> ATR Media Integration and<br />
Communications Research Laboratories (MIC),<br />
Kyoto, Japan. In June 2000, he went to Harvard<br />
Medical School to work on image enhancement<br />
technology. S<strong>in</strong>ce Dec. 2001, Dr. Tang has been<br />
work<strong>in</strong>g as a research scientist <strong>in</strong> Department of Electrical and Computer<br />
Eng<strong>in</strong>eer<strong>in</strong>g, University of Virg<strong>in</strong>ia. His research <strong>in</strong>terests are image<br />
enhancement <strong>for</strong> low-vision, content based image retrieval, cell detection and<br />
track<strong>in</strong>g, face detection and recognition. Dr. J<strong>in</strong>shan Tang is a senior member<br />
of IEEE.<br />
Jeonghoon Kim received his MS and PhD degrees<br />
<strong>in</strong> Electronics from <strong>the</strong> Yonsei University, Seoul,<br />
Korea <strong>in</strong> 1989 and 2000, respectively. S<strong>in</strong>ce 1989<br />
he has been <strong>with</strong> <strong>the</strong> Signal Process<strong>in</strong>g center at<br />
Samsung Electronics as a senior research eng<strong>in</strong>eer.<br />
From 2002 to 2003 he worked as a Postdoctoral<br />
researcher at Schepens Eye Resarch Institute,<br />
Harvard Medical School, Boston. He is an assistant<br />
professor <strong>in</strong> <strong>the</strong> department of Electronic<br />
Communication at <strong>the</strong> Sh<strong>in</strong>heung College, Korea.<br />
His <strong>in</strong>terests are vision rehabilitation, digital image process<strong>in</strong>g, 3-D<br />
process<strong>in</strong>g and digital ASIC design.<br />
Eli Peli received a BSEE, cum laude, and MSEE<br />
from <strong>the</strong> Technion-Israel Institute of Technology,<br />
and his doctorate from New England College of<br />
Optometry <strong>in</strong> Boston. Dr. Peli is Senior Scientist and<br />
<strong>the</strong> Moakley Scholar <strong>in</strong> Ag<strong>in</strong>g Eye Research at The<br />
Schepens Eye Research Institute, and Professor of<br />
Ophthalmology at Harvard Medical School. He also<br />
serves on <strong>the</strong> faculty of <strong>the</strong> New England College of<br />
Optometry and Tufts University School of Medic<strong>in</strong>e.<br />
S<strong>in</strong>ce 1983 he has been car<strong>in</strong>g <strong>for</strong> visually impaired<br />
patients as <strong>the</strong> director of <strong>the</strong> <strong>Vision</strong> Rehabilitation Service at <strong>the</strong> New<br />
England Medical Center Hospitals <strong>in</strong> Boston. Dr. Peli is a Fellow of <strong>the</strong><br />
American Academy of Optometry, a Fellow of <strong>the</strong> Optical Society of<br />
America, and a Fellow of <strong>the</strong> SID (Society <strong>for</strong> In<strong>for</strong>mation Display). His<br />
pr<strong>in</strong>cipal research <strong>in</strong>terests are image process<strong>in</strong>g <strong>in</strong> relation to visual function<br />
and cl<strong>in</strong>ical psychophysics <strong>in</strong> low vision rehabilitation, image understand<strong>in</strong>g<br />
and evaluation of display-vision <strong>in</strong>teraction. He also ma<strong>in</strong>ta<strong>in</strong>s an <strong>in</strong>terest <strong>in</strong><br />
oculomotor control and b<strong>in</strong>ocular vision.<br />
10