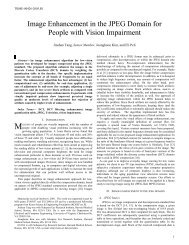
PDF 4.7 MB - Schepens Eye Research Institute
PDF 4.7 MB - Schepens Eye Research Institute
PDF 4.7 MB - Schepens Eye Research Institute
- No tags were found...

You also want an ePaper? Increase the reach of your titles
YUMPU automatically turns print PDFs into web optimized ePapers that Google loves.
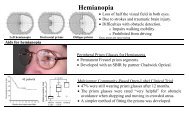
Normal Vision vs.Hemianopia180º Horizontalfield of view90º Horiz.field ofviewNormal Visual Field(Binocular)Left Hemianopia(Binocular)
HemianopiaHemi • an • opia = Half • Non • Seeing
Causes of HemianopiaHemianopia is an issue with the brain;not the eye.– Stroke– Brain tumor (or surgical removal of)– Head trauma
Prevalence• About 5 million stroke survivors inUnites States*• 30-45% of those have Hemianopia *** National Health Interview Survey, 2002** Gray et. al, Age Aging, 1989** Rossi et al, Neurology, 1990
Hemianopes Can Drive Legally27 Can Drive23 Cannot Drive
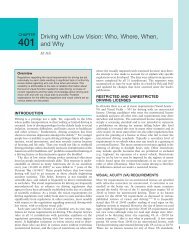
Driving With HemianopiaNon-uniform state laws between states:–Little empirical research to justify such laws–For the safety of other road users–For the safety drivers with hemianopia–Denying anyone driving privileges is aserious issue – removal of independence
Driving With Hemianopia+ Visual Aids?•Little information about driving with fieldexpanding visual aids•No states currently endorse the use of fieldexpanding visual aids to qualify.
A Visual Field Plot Does NotRepresent Real World Conditions
FAAC Incorporated: PP-1000Custom Scripting Software (Scenario Tool Kit v 1.3)
Honk at Pedestrian
Pedestrian At 220 Feet
Primary Measures•Detection (seen/not seen)•Reaction Time (when seen)
Where We Put PedestriansRight and Left Sides- Applicable to Right Hemianopiaor Left Hemianopia(Between Subject Comparison)- Compares Blind Side to Seeing Side(Within Subject Comparison)
Additional Methodology• Low & High (30 & 60 mph ) postedspeed limits• 5 scenarios per test(high/low speed, scripted traffic)• 12-14 targets appear per scenario• Approximately 30 minutes of driving
Targets Appear at Reasonable Distance–220’ (67m) away for low speedscenario, 440’ for high speed scenario–6’ target is visible–This distance equates to 5 secondsfrom driver–AASHTO guidelines 2.5 seconds toreact
• We place targets and want toknow where they appear in aperson’s visual field.• A target appears either left orright of anticipated gazedirection.• We must make assumptionsabout where the person islooking…
Video Examples‘Front Left’ Monitor:Illustrates targetpresentation viamultiple monitors‘Center’ Monitor:Driver looks here formajority of drive
Target AppearanceFront Left MonitorCenter MonitorRear ViewMirrorSide ViewMirror
Target Locationat Instant of Target Appearance
PlaceTarget Here14º off gazedirectionDriver looksstraight ahead
Predict Fixation More Accuratelywith ‘Attention-Getter’
Target Locationat Instant of Target Appearance
PlaceTarget Here14º left ofanticipatedfixation locationDriver looksat Ambulance
3. Position target 14ºand 440 feet fromtangent-driver line2. ComputeTangentPointDriver Gazesat TangentPoint of Curve1. Select a car locationin curve when targetwill appearConcept: Land and Lee, Nature (1994)
First Pilot StudyTwo drivers with Left Hemianopia (missingthe left visual field)Three drivers with normal visual field
Percentage of Targets Detected100Percentage detected806040200Control 1 Control 2 Control 3 Left hemi 1 Left hemi 2Left targetsRight targets
Percentage of Targets Detected100Percentage detected806040200Control 1 Control 2 Control 3 Left hemi 1 Left hemi 2Left targetsRight targets
Percentage of Targets Detected100Percentage detected806040200Control 1 Control 2 Control 3 Left hemi 1 Left hemi 2Left targetsRight targets
Mean Response TimesLeft targetsRight targetstime time in in secondsTime in3322321100left targetsright targetsleft targetsright targetscontrol 1 control 2 control 3 leftleftControl control 1 Control control 2 Control control 3 Left hemianopia left 1 1Left hemianopia left 2 2hemianopia 1hemianopia 2
Mean Response TimesLeft targetsRight targetstime time in in secondsTime in3322321100left targetsright targetsleft targetsright targetscontrol 1 control 2 control 3 leftleftControl control 1 Control control 2 Control control 3 Left hemianopia left 1 1Left hemianopia left 2 2hemianopia 1hemianopia 2
Mean Response TimesLeft targetsRight targetstime time in in secondsTime in3322321100left targetsright targetsleft targetsright targetscontrol 1 control 2 control 3 leftleftControl control 1 Control control 2 Control control 3 Left hemianopia left 1 1Left hemianopia left 2 2hemianopia 1hemianopia 2F(1,155) = 8.5, P=.005
Second Pilot Study
Percentage of Targets Detected100908070percent seen6050403020100No significant differences.control 4 control 5 partial left quadranopiaLeft targetsRight targets
Mean Reaction Times43.5time in seconds32.521.510.50control 4 control 5 partial left quadranopiaLeft targetsRight targets
Pilot Study Outcomes1. Complete hemianopia miss significantlymore targets on blind side than seeing sideor controls2. When detected, response times aresignificantly greater3. Partial hemianopia still shows difference (inreaction times, not % detected)
SummaryScenarios working as designed We can measure clear performancedifferences with our scenarios
Additional Measurements
Analysis of Driver Behaviorat T-IntersectionsSpecific challenges to drivers with Hemianopia
Analysis of Driver Behaviorat T-Intersections220’ 220’Illustration Not to Scale
Left Hemianopic Driver TurningLeft and Looking Left for TrafficOutside FunctionalVisual Field
Left Hemianopic Driver TurningLeft and Looking Right for TrafficOutside FunctionalVisual Field
Labeled T-intersection TargetsIf Driver Turns LeftThis is Target ALIf Driver Turns RightThis is Target AR
Controls at T-IntersectionsARALBLCLDRControl1MissSeenSeenSeenSeenControl2SeenSeenSeenSeenSeenControl3SeenSeenSeenSeenSeen
Hemianopes at IntersectionsField LossARALBLCLDRTroublesomeLeftLeftRightRightRightfor…+Left+Left
L. Hemianopes at IntersectionsField LossARALBLCLDRL Partial Quad.SeenMissMissSeenSeenLeft Hemi.MissMissSeenSeenMissTroublesomeLeftLeftRightRightRightfor…+Left+Left
Accuracy of Our PredictionsVisual FieldARALBLCLDRL Partial Hemi.SeenMissMissSeenSeenLeft Hemi.MissMissSeenSeenMissTroublesomeLeftLeftRightRightRightfor…+Left+Left
Hemianopes at IntersectionsField LossARALBLCLDRL Partial Quad.SeenMissMissSeenSeenLeft Hemi.MissMissSeenSeenMissRight Hemi.MissSeenSeenMissMissRight Hemi.SeenSeenSeenSeenMissRight Hemi.N/ASeenSeenSeenMissTroublesomeLeftLeftRightRightRightfor…+Left+Left
Hemianopes at IntersectionsVisual FieldARALBLCLDRL Partial Hemi.SeenMissMissSeenSeenRight Hemi.MissSeenSeenMissMissRight Hemi.SeenSeenSeenSeenMissRight Hemi.N/ASeenSeenSeenMissLeft Hemi.MissMissSeenSeenMissTroublesomeLeftLeftRightRightRightfor…+Left+Left
Accuracy of Our PredictionsVisual FieldARALBLCLDRL Partial Hemi.SeenMissMissSeenSeenLeft Hemi.MissMissSeenSeenMissRight Hemi.MissSeenSeenMissMissRight Hemi.SeenSeenSeenSeenMissRight Hemi.N/ASeenSeenSeenMissAccuracy of50%100%20%20%80%Prediction
Labeled T-intersection Targets
Additional Measure: Steering StabilityDo Hemianopic Drivers swerve more thandrivers with full visual field?Do Hemianopic Drivers tend to hug one sideof the road?
Additional Measure: Steering StabilityWe defined segments and perform analysisthrough straight, curved and intersectionsegments(Coeckelbergh et. al, Vision <strong>Research</strong>, 2002)
• Scenarios are sensitive to whatwe are looking to evaluate• Now using in study
The Study (In Progress)Peripheral Prisms: a visual aidfor hemianopic visual fieldloss
Peripheral PrismsWithoutWithLeft Hemianopia
Thank YouCo-Authors:–A. Bowers– E. Peli– K. Higgins– R. Goldstein– L. BobrowTechnical Assistance:–S. Lerner–FAACSupport:– NIH grants EY12890 andEY14723– Center for InnovativeVisual Rehabilitation atthe Boston VA Hospital