corporate responsibility report - London Stansted Airport
corporate responsibility report - London Stansted Airport
corporate responsibility report - London Stansted Airport

Create successful ePaper yourself
Turn your PDF publications into a flip-book with our unique Google optimized e-Paper software.
7<br />
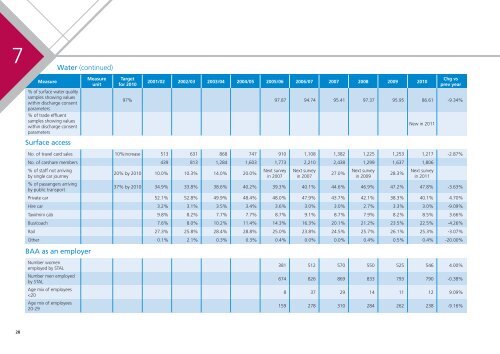
Water (continued)<br />
Measure<br />
% of surface water quality<br />
samples showing values<br />
within discharge consent<br />
parameters<br />
% of trade effluent<br />
samples showing values<br />
within discharge consent<br />
parameters<br />
Surface access<br />
Measure<br />
unit<br />
Target<br />
for 2010<br />
2001/02 2002/03 2003/04 2004/05 2005/06 2006/07 2007 2008 2009 2010<br />
Chg vs<br />
prev year<br />
97% 97.87 94.74 95.41 97.37 95.95 86.61 -9.34%<br />
New in 2011<br />
No. of travel card sales 10%increase 513 631 868 747 910 1,108 1,382 1,225 1,253 1,217 -2.87%<br />
No. of carshare members 439 813 1,284 1,603 1,773 2,210 2,438 1,299 1,637 1,806<br />
% of staff not arriving<br />
by single car journey<br />
% of passengers arriving<br />
by public transport<br />
20% by 2010 10.0% 10.3% 14.0% 20.0%<br />
Next survey<br />
in 2007<br />
Next survey<br />
in 2007<br />
27.0%<br />
Next survey<br />
in 2009<br />
28.3%<br />
Next survey<br />
in 2011<br />
37% by 2010 34.9% 33.8% 38.6% 40.2% 39.3% 40.1% 44.6% 46.9% 47.2% 47.8% -3.63%<br />
Private car 52.1% 52.8% 49.9% 48.4% 48.0% 47.9% 43.7% 42.1% 38.3% 40.1% 4.70%<br />
Hire car 3.2% 3.1% 3.5% 3.4% 3.6% 3.0% 3.0% 2.7% 3.3% 3.0% -9.09%<br />
Taxi/mini cab 9.8% 8.2% 7.7% 7.7% 8.7% 9.1% 8.7% 7.9% 8.2% 8.5% 3.66%<br />
Bus/coach 7.6% 8.0% 10.2% 11.4% 14.3% 16.3% 20.1% 21.2% 23.5% 22.5% -4.26%<br />
Rail 27.3% 25.8% 28.4% 28.8% 25.0% 23.8% 24.5% 25.7% 26.1% 25.3% -3.07%<br />
Other 0.1% 2.1% 0.3% 0.3% 0.4% 0.0% 0.0% 0.4% 0.5% 0.4% -20.00%<br />
BAA as an employer<br />
Number women<br />
employed by STAL<br />
Number men employed<br />
by STAL<br />
Age mix of employees<br />