Student Admissions, Outcomes, and Other Data - Argosy University
Student Admissions, Outcomes, and Other Data - Argosy University
Student Admissions, Outcomes, and Other Data - Argosy University

You also want an ePaper? Increase the reach of your titles
YUMPU automatically turns print PDFs into web optimized ePapers that Google loves.
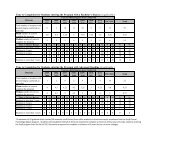
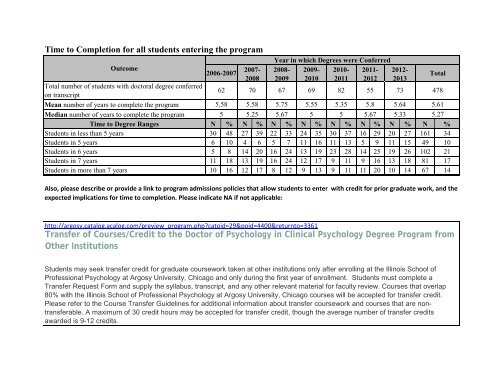
Time to Completion for all students entering the program<br />
Outcome<br />
Total number of students with doctoral degree conferred<br />
on transcript<br />
Mean number of years to complete the program<br />
Median number of years to complete the program<br />
2006-2007<br />
2007-<br />
2008<br />
Year in which Degrees were Conferred<br />
2008-<br />
2009<br />
2009-<br />
2010<br />
2010-<br />
2011<br />
2011-<br />
2012<br />
2012-<br />
2013<br />
62 70 67 69 82<br />
55 73 478<br />
5.58 5.58 5.75 5.55 5.35 5.8 5.64<br />
5 5.25 5.67 5 5 5.67 5.33 5.27<br />
Time to Degree Ranges N % N % N % N % N % N % N % N %<br />
<strong>Student</strong>s in less than 5 years 30 48 27 39 22 33 24 35 30 37 16 29 20 27 161 34<br />
<strong>Student</strong>s in 5 years 6 10 4 6 5 7 11 16 11 13 5 9 11 15 49 10<br />
<strong>Student</strong>s in 6 years 5 8 14 20 16 24 13 19 23 28 14 25 19 26 102 21<br />
<strong>Student</strong>s in 7 years 11 18 13 19 16 24 12 17 9 11 9 16 13 18 81 17<br />
<strong>Student</strong>s in more than 7 years 10 16 12 17 8 12 9 13 9 11 11 20 10 14 67 14<br />
Also, please describe or provide a link to program admissions policies that allow students to enter with credit for prior graduate work, <strong>and</strong> the<br />
expected implications for time to completion. Please indicate NA if not applicable:<br />
Total<br />
5.61<br />
http://argosy.catalog.acalog.com/preview_program.php?catoid=29&poid=4400&returnto=3361<br />
Transfer of Courses/Credit to the Doctor of Psychology in Clinical Psychology Degree Program from<br />
<strong>Other</strong> Institutions<br />
<strong>Student</strong>s may seek transfer credit for graduate coursework taken at other institutions only after enrolling at the Illinois School of<br />
Professional Psychology at <strong>Argosy</strong> <strong>University</strong>, Chicago <strong>and</strong> only during the first year of enrollment. <strong>Student</strong>s must complete a<br />
Transfer Request Form <strong>and</strong> supply the syllabus, transcript, <strong>and</strong> any other relevant material for faculty review. Courses that overlap<br />
80% with the Illinois School of Professional Psychology at <strong>Argosy</strong> <strong>University</strong>, Chicago courses will be accepted for transfer credit.<br />
Please refer to the Course Transfer Guidelines for additional information about transfer coursework <strong>and</strong> courses that are nontransferable.<br />
A maximum of 30 credit hours may be accepted for transfer credit, though the average number of transfer credits<br />
awarded is 9-12 credits.
Program Costs<br />
Description<br />
2013-2014 1 st -year Cohort Cost<br />
Tuition for full-time students (in-state) 38,346<br />
Tuition for full-time students (out-of-state) 38,346<br />
Tuition per credit hour for part-time students (if applicable ) 1162<br />
<strong>University</strong>/institution fees or costs 940<br />
Additional estimated fees or costs to students (e.g. books, travel, etc.) 1000
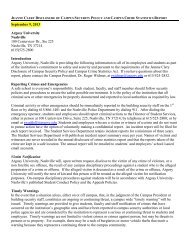
Internship Placement - Table 1<br />
Year Applied for Internship<br />
Outcome 2006- 2007<br />
2007- 2008- 2009- 2010- 2011- 2012-<br />
2008 2009 2010 2011 2012 2013<br />
N % N % N % N % N % N % N %<br />
<strong>Student</strong>s who sought or applied for internships* 74 - 77 - 77 - 74 - 77 - 66 - 53 -<br />
<strong>Student</strong>s who obtained internships 70 95 73 95 73 95 70 95 69 90 58 88 42 79<br />
<strong>Student</strong>s who obtained APA/CPA-accredited<br />
internships<br />
29 39 32 42 30 39 31 42 22 29 22 33 17 32<br />
<strong>Student</strong>s who obtained APPIC member<br />
internships that were not APA/CPA-accredited<br />
(if applicable)<br />
30 41 34 44 38 49 36 49 42 55 28 42 23 43<br />
<strong>Student</strong>s who obtained other membership<br />
organization internships (e.g. CAPIC) that were<br />
not APA/CPA-accredited (if applicable)<br />
<strong>Student</strong>s who obtained internships conforming<br />
to CDSPP guidelines that were not APA/CPAaccredited<br />
(if applicable)<br />
<strong>Student</strong>s who obtained other internships that<br />
were not APA/CPA-accredited (if applicable)<br />
0 0 0 0 0 0 0 0 0 0 0 0 0 0<br />
0 0 0 0 0 0 0 0 0 0 0 0 0 0<br />
11 15 7 9 5 6 3 4 5 6 8 12 2 4<br />
*This includes students that withdrew from the internship application process
Internship Placement - Table 2<br />
Year Applied for Internship<br />
Outcome<br />
2006- 2007- 2008- 2009- 2010- 2011- 2012-<br />
2007 2008 2009 2010 2011 2012 2013<br />
N % N % N % N % N % N % N %<br />
<strong>Student</strong>s who obtained internships 70 95 73 95 73 95 70 95 69 90 58 88 42 79<br />
<strong>Student</strong>s who obtained paid internships 60 86 67 92 70 96 66 94 68 99 54 93 42 79<br />
<strong>Student</strong>s who obtained half-time internships* (if<br />
applicable)<br />
0 0 0 0 0 0 0 0 0 0 0 0 0 0<br />
*Should only include students that applied for internship <strong>and</strong> are included in the number that "sought or applied for internship" from “Internship Placement -<br />
Table 1” for each year.
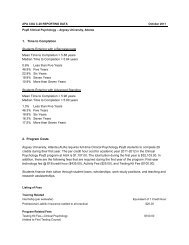
Attrition<br />
Variable<br />
<strong>Student</strong>s for whom this is the<br />
year of first enrollment (i.e.<br />
new students)<br />
<strong>Student</strong>s whose doctoral<br />
degrees were conferred on their<br />
transcripts<br />
<strong>Student</strong>s still enrolled in<br />
program<br />
<strong>Student</strong>s no longer enrolled for<br />
any reason other than conferral<br />
of doctoral degree<br />
Year of First Enrollment<br />
2006- 2007- 2008- 2009- 2010- 2011- 2012-<br />
2007 2008 2009 2010 2011 2012 2013<br />
N % N % N % N % N % N % N %<br />
111 - 90 - 82 - 76 - 51 - 46 - 20 -<br />
60 54 50 56 23 28 7 9 0 0 0 0 0 0<br />
21 19 15 17 45 55 51 67 41 80 38 83 20 100<br />
30 27 25 28 14 17 18 24 10 20 8 17 0 0
Licensure<br />
Outcome 2003-2004 to 2010-2011<br />
Total number of students with doctoral degrees conferred on transcript in<br />
time period<br />
552<br />
Number of students with doctoral degrees conferred on transcripts who<br />
became licensed doctoral psychologists in time period<br />
429<br />
Licensure percentage 78%