
Create successful ePaper yourself
Turn your PDF publications into a flip-book with our unique Google optimized e-Paper software.
<strong>Mig</strong>-<strong>21</strong>-FM-Identification-Rev. 14<br />
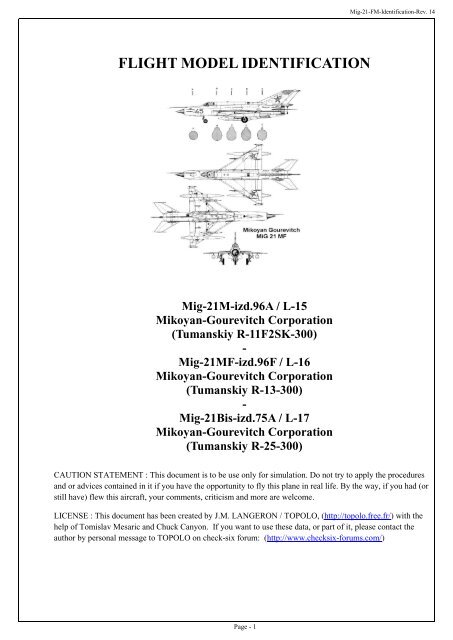
FLIGHT MODEL IDENTIFICATION<br />
<strong>Mig</strong>-<strong>21</strong>M-izd.96A / L-15<br />
Mikoyan-Gourevitch Corporation<br />
(Tumanskiy R-11F2SK-300)<br />
-<br />
<strong>Mig</strong>-<strong>21</strong>MF-izd.96F / L-16<br />
Mikoyan-Gourevitch Corporation<br />
(Tumanskiy R-13-300)<br />
-<br />
<strong>Mig</strong>-<strong>21</strong>Bis-izd.75A / L-17<br />
Mikoyan-Gourevitch Corporation<br />
(Tumanskiy R-25-300)<br />
CAUTION STATEMENT : This document is to be use only for simulation. Do not try to apply the procedures<br />
and or advices contained in it if you have the opportunity to fly this plane in real life. By the way, if you had (or<br />
still have) flew this aircraft, your comments, criticism and more are welcome.<br />
LICENSE : This document has been created by J.M. LANGERON / TOPOLO, (http://topolo.free.fr/) with the<br />
help of Tomislav Mesaric and Chuck Canyon. If you want to use these data, or part of it, please contact the<br />
author by personal message to TOPOLO on check-<strong>six</strong> forum: (http://www.check<strong>six</strong>-forums.com/)<br />
Page - 1
<strong>Mig</strong>-<strong>21</strong>-FM-Identification-Rev. 14<br />
1. <strong>Mig</strong>-<strong>21</strong> M / iz.96A ........................................................................................................................... 3<br />
General data. ........................................................................................................................................ 3<br />
Level <strong>Flight</strong> Acceleration tables. ......................................................................................................... 4<br />
Lift laws. ............................................................................................................................................ 11<br />
Sustained load factor tables. .............................................................................................................. 14<br />
2. <strong>Mig</strong>-<strong>21</strong> bis / iz.75A. ...................................................................................................................... 17<br />
General data. ...................................................................................................................................... 17<br />
Military Thrust Law identification. ................................................................................................... 18<br />
Maximum After Burner Thrust Law identification. .......................................................................... 22<br />
Special After Burner Thrust Law identification. ............................................................................... 25<br />
Sustained load factor - validation. ..................................................................................................... 27<br />
3. <strong>Mig</strong>-<strong>21</strong> MF / iz.96F ....................................................................................................................... 33<br />
Thrust Law validation. ...................................................................................................................... 34<br />
4. Annexes. ........................................................................................................................................ 37<br />
Standard Atmosphere and Corrected Air Speed (CAS). ................................................................... 37<br />
Load factor limits (Ng)...................................................................................................................... 38<br />
5. Change Log. .................................................................................................................................. 40<br />
Page - 2
<strong>Mig</strong>-<strong>21</strong>-FM-Identification-Rev. 14<br />
1. <strong>Mig</strong>-<strong>21</strong> M / iz.96A<br />
General data.<br />
Empty weight (including pilot, no pylon, no<br />
gun ammo) : 12,715 lbs / 5,760 kg<br />
Reference Area : 247.57 sq.ft / 23.0 m 2<br />
Internal fuel : 2,600 l @ 0.83kg/l<br />
: 2,158 Kg / 4,763 lbs<br />
Speed limitations:<br />
Speed limited to (first reached)<br />
- 1,300 km/h (702 Kts) IAS<br />
- Mach 2.1<br />
Load factor limitations:<br />
Load Factor (Ng) limitation depend on<br />
external loads, Mach number and internal fuel<br />
weight.<br />
They are assumed to be the same for <strong>Mig</strong>-<br />
<strong>21</strong>M/iz.96A and <strong>Mig</strong>-<strong>21</strong>MF/iz.96F. (refer to<br />
appendix)<br />
Mach number < 0.8<br />
- Clean or 2 R-3S<br />
o Fuel < 1,200 l : 8.5g<br />
o Fuel < 1,600 l : 8g<br />
o Fuel > 1,600 l : 7g<br />
- 4 R-3S : 7g<br />
- External tank(s) : 5g<br />
- Rocket pods : 5g<br />
- Bombs : 4g<br />
Mach number > 0.8<br />
- Clean or 2 R-3S<br />
o Fuel < 1,200 l : 7g<br />
o Fuel > 1,200 l : 6g<br />
- 4 R-3S : 6g<br />
- External tank(s) : 5g<br />
- Rocket pods : 5g<br />
- Bombs : 4g<br />
Configuration definition.<br />
Combat configuration “A”<br />
Aircraft loaded with 50% of usable internal<br />
fuel, Center Line pylon (but no CL Tank), 2 R-<br />
3S missiles with their pylon and launching<br />
rails under external wing stations.<br />
- Aircraft (zero usable fuel) : 5,760 kg<br />
- 200 gun ammo (Gsh 23) : 75 kg<br />
- 1 Center line pylon : 24 kg<br />
- 2 Under-wing pylon : 45 kg<br />
- Equipped zero usable fuel : 5,904 kg<br />
- 50% usable internal fuel : 1,005 kg<br />
(2,<strong>21</strong>9 lbs @0.83 g/cm 3 )<br />
- Clean Combat Weight : 6,909 kg<br />
- 2 APU-3S rails for R-3S : 41 kg<br />
- 2 Missile R-3S : 150 kg<br />
- Conf. “A” Combat weight : 7,100 kg<br />
This defines a gross weight of 7,100 kg<br />
(15,673 lbs) and a Drag Index of 12.<br />
Total fuel volume approximated to 1,300l<br />
Load factor limitation set to :<br />
- 8.0 (mach < 0.8)<br />
- 6.0 (mach > 0.8)<br />
Combat configuration “B”:<br />
Aircraft loaded with 50% of internal fuel,<br />
Center Line pylon (but no CL Tank), 4 R-3S<br />
missiles with their pylon and launching rails<br />
under wing (internal and external).<br />
- Aircraft (zero usable fuel) : 5,760 kg<br />
- 200 gun ammo (Gsh 23) : 75 kg<br />
- 1 Center line pylon : 24 kg<br />
- 2 Under-wing pylon : 45 kg<br />
- Equipped zero usable fuel : 5,904 kg<br />
- 50% usable internal fuel : 1,005 kg<br />
(2,<strong>21</strong>9 lbs @0.83 g/cm 3 )<br />
- Clean Combat Weight : 6,909 kg<br />
- 2 additional wing pylons : 45 kg<br />
- 4 APU-3S rails for R-3S : 82 kg<br />
- 4 Missile R-3S : 300 kg<br />
- Conf. “B” Combat weight :7,336 kg<br />
This defines a gross weight of 16,194 lbs /<br />
7,336 kg and a Drag Index of 13.<br />
Total fuel volume approximated to 1,300l<br />
Load factor limitation set to :<br />
- 7.0 (mach < 0.8)<br />
- 6.0 (mach > 0.8)<br />
Page - 3
<strong>Mig</strong>-<strong>21</strong>-FM-Identification-Rev. 14<br />
Level <strong>Flight</strong> Acceleration tables.<br />
The flight model identification start by level flight acceleration analysis, because it allows to define<br />
the relation between the engine thrust law (installed thrust) and the null lift drag coefficient (even at<br />
low speed, level flight acceleration involve low incidence profile where drag is very close to null lift<br />
drag)<br />
The acceleration performance are given in the L-15 Manual by graphics, one page per altitude, where<br />
curves give the time needed to reach a given Indicated Air Speed (in Km/h) form an initial one. The<br />
curves display the variation of this time depending on the Drag Index, the solid one is related to<br />
standard atmosphere (ISA), the dotted one to ISA+10°C.<br />
Let’s start by the figures extracted from L-15 flight manual for Full A/B at 500m (1,640 ft).<br />
m<br />
ft<br />
Alt 500 1640<br />
Full A/B<br />
Vcas Vcas<br />
(Km/h) (Kts)<br />
Mach t-isa (s) t+10 (s)<br />
400 <strong>21</strong>6 0.336 0.00 0.00<br />
450 243 0.378 5.20 5.50<br />
500 270 0.420 9.50 10.50<br />
550 297 0.461 13.50 15.00<br />
600 324 0.503 18.00 19.50<br />
650 351 0.545 <strong>21</strong>.50 23.00<br />
700 378 0.587 25.50 27.50<br />
750 405 0.629 28.50 31.50<br />
800 432 0.671 32.50 35.00<br />
850 459 0.713 36.50 39.00<br />
900 486 0.755 41.00 43.00<br />
950 513 0.797 45.00 48.00<br />
1000 540 0.839 50.00 53.50<br />
1050 567 0.881 56.00 65.00<br />
Then the one related to 3,000m (9,843 ft).<br />
Figure 1<br />
m<br />
ft<br />
Alt 3000 9843<br />
Full A/B<br />
Vcas Vcas<br />
(Km/h) (Kts)<br />
Mach t-isa (s) t+10 (s)<br />
400 <strong>21</strong>6 0.39 0.0 0.0<br />
450 243 0.44 5.3 5.6<br />
500 270 0.49 10.9 11.7<br />
550 297 0.54 15.7 17.0<br />
600 324 0.59 20.7 22.0<br />
650 351 0.63 25.3 26.9<br />
700 378 0.68 29.2 30.9<br />
750 405 0.73 33.3 35.2<br />
800 432 0.78 37.7 40.4<br />
850 459 0.83 42.4 45.4<br />
900 486 0.87 47.0 50.8<br />
950 513 0.92 52.7 56.9<br />
1000 540 0.97 64.6 73.3<br />
1050 567 1.02 75.0 75.0<br />
Figure 2<br />
The one related to 5,000m (16,404 ft).<br />
Figure 3<br />
m<br />
ft<br />
Alt 5,000 16,404<br />
Full A/B<br />
Vcas Vcas<br />
(Km/h) (Kts)<br />
Mach t-isa (s) t+10 (s)<br />
400 <strong>21</strong>6 0.442 0 0<br />
450 243 0.497 7 9<br />
500 270 0.548 13 14<br />
550 297 0.600 18 20<br />
600 324 0.651 24 26<br />
650 351 0.702 29 30<br />
700 378 0.754 34 36<br />
750 405 0.805 39 41<br />
800 432 0.856 43 46<br />
850 459 0.908 48 51<br />
900 486 0.959 56 60<br />
950 513 1.013 65 69<br />
1000 540 1.071 79 90<br />
1050 567 1.127 115 150<br />
Page - 4
<strong>Mig</strong>-<strong>21</strong>-FM-Identification-Rev. 14<br />
The one related to 7,000m (22,966 ft).<br />
And last, the one related to 10,000m (32,808ft)<br />
.<br />
Figure 4<br />
Figure 5<br />
m<br />
ft<br />
Alt 7,000 22,966<br />
Full A/B<br />
Vcas Vcas<br />
(Km/h) (Kts)<br />
Mach t-isa (s) t+10 (s)<br />
400 <strong>21</strong>6 0.502 0 0<br />
450 243 0.559 9 10<br />
500 270 0.617 17 18<br />
550 297 0.675 25 27<br />
600 324 0.733 34 36<br />
650 351 0.791 41 44<br />
700 378 0.849 49 51<br />
750 405 0.907 54 58<br />
800 432 0.965 62 66<br />
850 459 1.027 69 73<br />
900 486 1.092 77 84<br />
950 513 1.159 90 98<br />
1000 540 1.226 105 112<br />
1050 567 1.287 122 133<br />
1100 594 1.343 146 175<br />
1150 6<strong>21</strong> 1.399 193<br />
m<br />
ft<br />
Alt 10,000 32,808<br />
Full A/B<br />
Vcas Vcas<br />
(Km/h) (Kts)<br />
Mach t-isa (s) t+10 (s)<br />
600 324 0.888 0 0<br />
650 351 0.959 17 20<br />
700 378 1.031 28 33<br />
750 405 1.111 40 46<br />
800 432 1.189 55 63<br />
850 459 1.267 72 80<br />
900 486 1.335 87 96<br />
950 513 1.404 103 113<br />
1000 540 1.472 119 128<br />
1050 567 1.540 138 150<br />
1100 594 1.608 165 188<br />
1150 6<strong>21</strong> 1.676<br />
1200 648 1.743<br />
1250 675 1.811<br />
1300 702 1.879<br />
1350 729 1.946<br />
I do assume that all figures are related to a unique gross weight that I do estimate to 8,000Kg<br />
First task is to translate the figures in numerical values for the chose aircraft configuration (drag index<br />
of 12 corresponding to two IR missiles), this will gave the acceleration path as mach number function<br />
of the time.<br />
For each latitude this give us two lists (one for ISA, the second for ISA+10°C) of (time, True Air<br />
Speed) couple: , between two nodes, true air speed variation is<br />
assume to be linear :<br />
, this linearity implies<br />
.<br />
Using the relation between mass (M), acceleration ( = ) and forces (Ft) :<br />
In expressing the Resulting forces as the difference between the actual Thrust and the Drag forces (the<br />
level flight hypothesis give us that the acceleration vector is along the horizontal, so weight<br />
component is null),<br />
Page - 5
<strong>Mig</strong>-<strong>21</strong>-FM-Identification-Rev. 14<br />
If we assume that incidence angle is so small that we can also consider Thrust being along horizontal<br />
(sin(AoA) = 1.0), formula become:<br />
There is also a relation between acceleration and Extra Specific Power (or instantaneous climb rate)<br />
(V true air speed in m/s, Ps and Vz in m/s, g = 9.81 m/s 2 ), or<br />
that give the global equation system<br />
(3.3)<br />
Page - 6
Mach Number<br />
Mach Number<br />
Mach Number<br />
<strong>Mig</strong>-<strong>21</strong>-FM-Identification-Rev. 14<br />
For each altitude, we can first build the<br />
curve:<br />
table in fitting the Mach(t) interpolated<br />
1.000<br />
67<br />
0.95<br />
0.900<br />
51.5<br />
0.85<br />
40.5<br />
0.800<br />
0.75<br />
30.5<br />
0.700<br />
0.65<br />
22<br />
0.600<br />
0.55<br />
12.5<br />
0.500<br />
0.45<br />
2<br />
0.400<br />
0.35<br />
0.300<br />
0.200<br />
0.100<br />
0.000<br />
0.00 10.00 20.00 30.00 40.00 50.00 60.00 70.00 80.00<br />
Time (s)<br />
Extracted<br />
Sampled<br />
Mach<br />
V(TAS) dV/dt Ps Ps<br />
m/s (m/s**2) (m/s) (ft/s)<br />
0.40 135 3.22 44 146<br />
0.50 169 3.56 61 202<br />
0.60 203 3.98 82 270<br />
0.70 237 3.38 82 268<br />
0.80 271 3.08 85 278<br />
0.90 305 2.18 68 222<br />
Fig 6.1 (altitude 500m / 1,640ft ; Gross weight 8,000kg / 17,660 lbs ; Drag Index 12)<br />
1.10<br />
82.5<br />
1.05<br />
58.5<br />
1.00<br />
0.95<br />
44.5<br />
0.90<br />
0.85<br />
35<br />
0.80<br />
0.75<br />
26.5<br />
0.70<br />
0.65<br />
17<br />
0.60<br />
0.55<br />
6.5<br />
0.50<br />
0.45<br />
0.40<br />
0.30<br />
0.20<br />
0.10<br />
0.00<br />
0 10 20 30 40 50 60 70 80 90<br />
Time (s)<br />
Extracted<br />
Sampled<br />
Mach<br />
V(TAS) dV/dt Ps Ps<br />
m/s (m/s**2) (m/s) (ft/s)<br />
0.40 131 2.99 40 131<br />
0.50 164 3.13 52 172<br />
0.60 197 3.46 70 228<br />
0.70 230 3.87 91 297<br />
0.80 263 3.46 93 304<br />
0.90 296 2.35 71 232<br />
1.00 329 1.37 46 150<br />
Fig 6.2 (altitude 3,000m / 9,843ft ; Gross weight 8,000kg / 17,660 lbs ; Drag Index 12)<br />
1.200<br />
129<br />
1.15<br />
73<br />
1.100<br />
1.05<br />
55<br />
1.000<br />
0.95<br />
43<br />
0.900<br />
0.85<br />
33.5<br />
0.800<br />
0.75<br />
24<br />
0.700<br />
0.65<br />
13<br />
0.600<br />
0.55<br />
1<br />
0.500 0.45<br />
0.400<br />
0.300<br />
0.200<br />
0.100<br />
0.000<br />
0 10 20 30 40 50 60 70 80 90 100 110 120 130 140<br />
Time (s)<br />
Extracted<br />
Sampled<br />
Mach<br />
V(TAS) dV/dt Ps Ps<br />
m/s (m/s**2) (m/s) (ft/s)<br />
0.40 128<br />
0.50 160 2.67 44 143<br />
0.60 192 2.91 57 187<br />
0.70 224 3.37 77 253<br />
0.80 256 3.37 88 289<br />
0.90 288 2.67 79 258<br />
1.00 3<strong>21</strong> 1.78 58 191<br />
1.10 353 0.57 <strong>21</strong> 67<br />
Fig 6.3 (altitude 5,000m / 16,404ft ; Gross weight 8,000kg / 17,660 lbs ; Drag Index 12)<br />
Page - 7
Mach Number<br />
Mach Number<br />
<strong>Mig</strong>-<strong>21</strong>-FM-Identification-Rev. 14<br />
1.500<br />
240<br />
1.45<br />
150<br />
1.400<br />
1.35<br />
111<br />
1.300<br />
1.25<br />
89<br />
1.200<br />
1.15<br />
72<br />
1.100<br />
1.05<br />
60<br />
1.000<br />
0.95<br />
49<br />
0.900<br />
0.85<br />
36<br />
0.800<br />
0.75<br />
22<br />
0.700<br />
0.65<br />
7.5<br />
0.600 0.55<br />
0.500<br />
0.400<br />
0.300<br />
0.200<br />
0.100<br />
0.000<br />
0 10 20 30 40 50 60 70 80 90 100 110 120 130 140 150 160 170 180 190 200 <strong>21</strong>0 220 230 240 250 260<br />
Time (s)<br />
Extracted<br />
Sampled<br />
Mach<br />
V(TAS) dV/dt Ps Ps<br />
m/s (m/s**2) (m/s) (ft/s)<br />
0.50 156 1.89 30 99<br />
0.60 187 2.15 41 135<br />
0.70 <strong>21</strong>9 2.23 50 163<br />
0.80 250 2.40 61 201<br />
0.90 281 2.84 81 267<br />
1.00 312 2.60 83 272<br />
1.10 343 1.84 64 <strong>21</strong>1<br />
1.20 375 1.42 54 178<br />
1.30 406 0.80 33 109<br />
Fig 6.4 (altitude 7,000m /22,966ft ; Gross weight 8,000kg / 17,660 lbs ; Drag Index 12)<br />
1.700<br />
182<br />
140<br />
1.65<br />
1.600<br />
1.55<br />
114<br />
1.500<br />
1.45<br />
90<br />
1.400<br />
1.35<br />
68<br />
1.300<br />
1.25<br />
48<br />
1.200<br />
1.15<br />
31<br />
1.100<br />
1.05<br />
15<br />
1.000 0.95<br />
0.900<br />
0.800<br />
0.700<br />
0.600<br />
0.500<br />
0.400<br />
0.300<br />
0.200<br />
0.100<br />
0.000<br />
0 10 20 30 40 50 60 70 80 90 100 110 120 130 140 150 160 170 180 190 200<br />
Time (s)<br />
Extracted<br />
Sampled<br />
Mach<br />
V(TAS) dV/dt Ps Ps<br />
m/s (m/s**2) (m/s) (ft/s)<br />
0.90 270 1.20 33 108<br />
1.00 299 1.87 57 187<br />
1.10 329 1.76 59 194<br />
1.20 359 1.50 55 180<br />
1.30 389 1.36 54 177<br />
1.40 419 1.25 53 175<br />
1.50 449 1.15 53 173<br />
1.60 479 0.71 35 114<br />
Fig 6.5 (altitude 10,000m / 32,808ft ; Gross weight 8,000kg / 17,660 lbs ; Drag Index 12)<br />
The thrust law (here with Full After Burner applied) is modeled by a function of the altitude and Mach<br />
number .<br />
As a first approximation we can consider the Drag coefficient being equal to the Null-Lift drag<br />
coefficient (level flight acceleration involve low or very low lift coefficient values).<br />
The Null-Lift drag Coefficient vary only with the Mach number, so it is modeled by the following<br />
function :<br />
. In expressing the Mach number from the True Air Speed and the Standard<br />
Atmosphere sound speed<br />
thrust law:<br />
we get the following expression for the<br />
Page - 8
<strong>Mig</strong>-<strong>21</strong>-FM-Identification-Rev. 14<br />
If we want to avoid to approximate drag coefficient by only null-lift one, we may have to take into<br />
account the induced drag (induced by lift) in defining the Drag coefficient by<br />
This evaluation of the Drag coefficient (with a k assumed being constant) is quite accurate for low lift<br />
and low incidence value. It can be determined by small variation of the regular formula related to<br />
elliptic wing ( where is the aspect ratio and e is the wing efficiency factor. The<br />
aspect ratio is computed from l (the wing span) and S the Reference area. (The elliptic wing formula<br />
assume e equal to 1.00)<br />
For the <strong>Mig</strong>-<strong>21</strong> (all version) with a Reference area of 23m 2 and a wing span of 7.15m, λ=2.225 the k<br />
coefficient should be 0.143 for a wing efficiency of 1.00 but this will lead to a much too high Lift to<br />
Drag ratio.<br />
Based on the assumption of a maximum Lift to Drag ratio between 7 and 8 (common for the <strong>Mig</strong>-<strong>21</strong><br />
generation delta wing aircraft), I’ve chosen a value of 0.<strong>21</strong> for k at low incidence, corresponding to a<br />
wing efficiency coefficient (e) equal to 0.68.<br />
.<br />
Based on these hypothesis, for all value of Mach number inside the list<br />
computation is done as follow<br />
the thrust<br />
(5.2)<br />
0.0500<br />
0.0450<br />
0.0400<br />
0.0350<br />
0.0300<br />
0.0250<br />
0.0200<br />
0.0150<br />
0.0100<br />
0.0050<br />
0.0000<br />
0.00 0.20 0.40 0.60 0.80 1.00 1.20 1.40 1.60 1.80 2.00 2.20 2.40 2.60<br />
In order to compute the thrust, it is also needed to<br />
forecast a null-lift drag coefficient law. I’ve used the<br />
one described on the left:<br />
Subsonic (M
Time (s)<br />
Time (s)<br />
<strong>Mig</strong>-<strong>21</strong>-FM-Identification-Rev. 14<br />
The diagrams are (t,Mach), i.e. time requested to reach a given mach number.<br />
The continuous black curves are computed from the flight model described here and standard<br />
atmosphere (ISA).<br />
The heavy colored segments delimit the time required to reach a given mach number in ISA and<br />
ISA+10°C condition in the L-15/<strong>Mig</strong>-<strong>21</strong>M manual.<br />
The length of the segment also describes the potential dispersion of the measures, and consequently<br />
the admissible error in forecast.<br />
All data are related to a configuration where gross weight is 8,000 kg and Drag index is 12 (2 K-13<br />
missiles):<br />
180<br />
1,640<br />
Acceleration (Max A/B Thrust)<br />
ISA Conditions<br />
165<br />
150<br />
135<br />
120<br />
105<br />
9,843<br />
16,404<br />
L-15 Manual<br />
500m<br />
L-15 Manual<br />
3,000m<br />
L-15 Manual<br />
5,000m<br />
ISA + 10°C<br />
ISA<br />
90<br />
75<br />
60<br />
45<br />
30<br />
15<br />
0<br />
0.30 0.40 0.50 0.60 0.70 Acceleration 0.80 0.90(Max 1.00 A/B Thrust) 1.10 1.20 1.30 1.40 1.50 1.60<br />
ISA Conditions<br />
Mach<br />
180<br />
165<br />
150<br />
135<br />
120<br />
105<br />
22,966<br />
32,808<br />
39,370<br />
L-15 Manual<br />
7,000m<br />
L-15 Manual<br />
10,000m<br />
90<br />
75<br />
60<br />
45<br />
30<br />
15<br />
0<br />
0.30 0.40 0.50 0.60 0.70 0.80 0.90 1.00 1.10 1.20 1.30 1.40 1.50 1.60 1.70 1.80 1.90 2.00 2.10 2.20<br />
Mach<br />
Page - 10
<strong>Mig</strong>-<strong>21</strong>-FM-Identification-Rev. 14<br />
Lift laws.<br />
This section deals with the definition of the maximum lift, maximum lift can be reached by reaching<br />
the incidence value that give the maximum lift coefficient, or by reaching the maximum possible<br />
incidence due to the lack of efficiency of the pitch command.<br />
Our first step will be to define the Lift coefficient law along incidence angle.<br />
Figure 7<br />
The high subsonic (M=0.7) lift coefficient curve on the<br />
following figure (supposed coming from <strong>Mig</strong>-<strong>21</strong>bis /<br />
L-17 Manual) show that:<br />
C z is null for AoA=0 deg<br />
C z variation is linear from 0 to 16 deg<br />
Maximum value reached around AoA=35deg<br />
But this curve should not be considered as accurate in term of value, in order to determine C z values<br />
along AoA, I do use the next figure (8).<br />
The variation of the maximum C z value along mach number is described by the following figure (once<br />
again extracted from the <strong>Mig</strong>-<strong>21</strong>bis/L17 manual).<br />
The diagram mix the limitation of incidence (stab efficiency) and variation of the C z-max .<br />
I have redrawn the green and pink curve to represent the C z values for AoA=33 and AoA=28 along<br />
Mach number.<br />
Mach Cz(33) Cz(28)<br />
0.2 0.812 0.698<br />
0.4 0.812 0.698<br />
0.6 0.810 0.698<br />
0.8 0.846 0.736<br />
1.0 0.894 0.759<br />
1.2 0.826 0.696<br />
1.4 0.777 0.658<br />
1.6 0.759 0.648<br />
1.8 0.759 0.648<br />
Figure 8<br />
The figure is translated in values described in the following table. We can see that the ratio between<br />
C z (33) and C z (28) is quite constant and equal to 85%.<br />
If we compare fig.7 and fig.8, we can see that Cz values for M=0.7 are not the same: Cz(33) = 0.94 in<br />
fig.7 and 0.83 in fig.8, Cz(28) = 0.89 in fig.7 and 0.72 in fig.8.<br />
Page - 11
Cz limit = Stab<br />
efficiency<br />
AoA Max < 33<br />
Cz limit = Stall<br />
AoA_Stall > 33<br />
<strong>Mig</strong>-<strong>21</strong>-FM-Identification-Rev. 14<br />
I’ve chose to follow the values extracted from the fig.8 related to “big arm” curve to build the Cz laws<br />
of the flight model.<br />
There is no evidence that the α UUA is true incidence angle, or just incidence index as suggested in<br />
“MAKING THE BEST OF MiG-<strong>21</strong>” article, but in the rest of this document I do suppose the values<br />
are true incidence angle between the speed vector and the x plane axis (itself equal to the thrust vector)<br />
The analysis of the fig.8 also demonstrates that maximum available lift cannot be modeled by a unique<br />
incidence limit.<br />
We need here to distinguish two separates mach number ranges: under M0.95, maximum lift is<br />
reached for incidence values greater than 33 degrees, over M0.95 maximum lift is reached for<br />
incidence values lower than 33 degrees due to lack of pitch command efficiency.<br />
Comment : I do not have any evidence that the fig.8 value do or do not take into account the<br />
“swimming flap” device introduced in late <strong>Mig</strong>-<strong>21</strong>PFM, but this figures seems to be related to a MIG-<br />
<strong>21</strong>bis/iz.75 that does have it. This device, when activated, allows “automatic” flaps deployment and<br />
retract, between 0 and 25 degrees at low speed, the flaps angle is limited by dynamic pressure when<br />
speed increase, in a quite simple but pragmatic way. But this assumption seems reasonable when we<br />
see Cl value growing up to 1.3 for low mach. (We are not speaking here of the “landing” flaps system,<br />
that use air flow extracted from engine to blow flaps, identified as SPS system).<br />
Even if I’ve no figure describing <strong>Mig</strong>-<strong>21</strong> supersonic lift curve, I keep for mach number over 1.0, a<br />
C z (AoA,Mach) law defined between 0 and 33 degrees with a maximum at 33 and a linear portion<br />
between 0 and 15 degrees.<br />
For mach number under 0.9, I have built law on the basis of the values read from the figure for<br />
AoA=28 and AoA=33, and a maximum C z value, but for an unknown incidence.<br />
This table gives a possible set of values satisfying these<br />
criteria and the figure bellow displays graphically C z main<br />
values extracted from the L-17 manual (big arm curve):<br />
1.4000<br />
1.2000<br />
1.0000<br />
0.8000<br />
0.6000<br />
0.4000<br />
0.2000<br />
0.0000<br />
Max CL (Mach)<br />
0.00 0.50 1.00 1.50 2.00 2.50<br />
Figure 9<br />
Then we can go to the second step: identification of the incidence limitation along Mach number.<br />
In first approximation the (Ng,Mach) reachable domain is limited by<br />
Cz Max<br />
Cz(AoA=33)<br />
Cz(AoA=28)<br />
Mach Max Cz<br />
AoA for<br />
CzMax<br />
0.2 1.302 57.00<br />
0.3 1.207 57.00<br />
0.4 1.093 52.00<br />
0.5 1.018 47.00<br />
0.6 0.964 44.00<br />
0.7 0.931 39.00<br />
0.8 0.911 38.00<br />
0.9 0.899 35.00<br />
1.0 0.894 33.00<br />
1.1 0.841 31.14<br />
1.2 0.650 <strong>21</strong>.96<br />
1.3 0.524 17.66<br />
1.4 0.440 14.86<br />
1.5 0.393 13.43<br />
1.6 0.365 12.62<br />
1.7 0.352 12.17<br />
1.8 0.344 11.90<br />
Page - 12
<strong>Mig</strong>-<strong>21</strong>-FM-Identification-Rev. 14<br />
- Structural limit load factor (7G under Mach 0.8, 6G over M0.8).<br />
- Maximal value of incidence angle that prevent from stall (maximum lift or pitch instability),<br />
- Maximum reachable incidence due du pitch command efficiency.<br />
I’ve chosen to represent the two last criteria by a unique Incidence limit law (Max_AoA(mach))<br />
described by the following table:<br />
Mach 0.00 0.10 0.20 0.30 0.40 0.50 0.60 0.70 0.80 0.90 1.00 1.10 1.20 1.30 1.40 1.50 1.60 1.70 1.80 1.90 2.00<br />
Max_AoA (deg) 57 57 57 57 52 47 44 39 38 35 33 31 22 18 15 13 13 12 12 12 12<br />
In using such criteria, it is possible to compute, for a given gross weight and altitude, the relation<br />
between the Mach number and maximum reachable load factor (independently from structural<br />
limitation).<br />
These curves (max Ng along Mach) are part of the L-17/<strong>Mig</strong>-<strong>21</strong>bis manual, the following figure<br />
compare the colored curves (computed from the fig.9 values), but the manual’s figure assume an<br />
incidence never exceeding 28 degrees (operational limit) so they fit what can be computed from fig.9<br />
only for Mach number over 1.15.<br />
It seems the incidence indicator<br />
display a Yellow-Black between to<br />
[<strong>21</strong>; 28] degrees and a Red-Black<br />
between 28 and 35 degrees, the red<br />
(forbidden) area is over this value I<br />
assume being the operational limit.<br />
This last assumption clearly does<br />
not help to choose how the<br />
performance charts (especially<br />
Energy Mach diagrams that contain<br />
the maximum reachable load factor<br />
and turn rates) should be build.<br />
Should I take into account the<br />
maximum available lift in all cases,<br />
or should I take into account the<br />
incidence limitation of 28 degrees. It seems than the manual I’ve been able to read limit the flight<br />
domain by a maximum incidence value of 28 or 33, but as I try to figure out the maximum capabilities<br />
of the aircraft and not its documented operational usage, I’ve computed all turn performance charts<br />
with the maximum available lift for all cases, with a dedicated curve corresponding to an incidence<br />
limit of 28 degrees.<br />
Page - 13
<strong>Mig</strong>-<strong>21</strong>-FM-Identification-Rev. 14<br />
Sustained load factor tables.<br />
Once thrust and null-lift drag law have been approximated as described previously, the next step is to<br />
determine Lift and Drag coefficient values for higher incidence values.<br />
The aim of the analysis of the sustained load factor table is to define the Drag coefficient for incidence<br />
values higher than the one deduced from level flight acceleration.<br />
First of all, figures from the manual are analyzed in order translate them in tables giving the load<br />
factor sustained (Extra Specific Power = 0) with full after burner for a given aircraft configuration, a<br />
given altitude and a give mach number.<br />
The aircraft configuration is assumed to be the same as previously: gross weight of 8,000 kg , drag<br />
index of 12 (two IR missile).<br />
For each value of Altitude, Mach number and load factor, the equation system describing the equality<br />
of Lift and Apparent Weight on one side and Thrust and Drag on the other side has to be solved to find<br />
the corresponding value of the Drag coefficient:<br />
(6.1)<br />
This simplified set of equation can be solved analytically, but it is its only advantage as it assume the<br />
thrust force is applied along the speed vector, and this approximation can only be accepted only for<br />
very small incidence angle (up to 5 degrees) that are not the one corresponding the flight conditions<br />
such as the one described in “sustained load factor diagram” analyzed here.<br />
So I chose to solve numerically the more precise equations set:<br />
This allows the computation, for all points extracted from the figures to compute the value of the k<br />
coefficient (defined by formula (5.1) here).<br />
(6.4)<br />
Page - 14
<strong>Mig</strong>-<strong>21</strong>-FM-Identification-Rev. 14<br />
The k coefficient depending on wing efficiency is not constant along the complete incidence range, but<br />
if I do assume e is quite constant up to the maximum incidence covered by sustained load factor<br />
graphics, I can focus my effort in computing an average value. As forecast previously, the average<br />
value of k that satisfy the previous equation is 0.<strong>21</strong>.for all incidence value in [0;23]. This allow to<br />
build the Drag coefficient laws as:<br />
For higher incidence (and lift) I’ve chosen to follow the drag coefficient formula described in<br />
“AIRCRAFT PERFORMANCE FLIGHT TESTING” by Wayne M. OLSON (AFFTC-TIH-99-01)<br />
section 5.7, page 45, equation 5.19<br />
So over 23 deg or a lift coefficient value of 0.6, the decreasing value of e force to adopt the following<br />
lift formula:<br />
With numerical value determined by acceleration table we get the k 1 value (0.<strong>21</strong>). Analyzing<br />
sustained load factor diagram and solve, for each speed values of each table, the equation set (6.3) here<br />
drive us to determine optimum values of k 2 and C z1<br />
The following figures and table show sustained load factor read from L-15 manual compared with the<br />
one computed with the previous Drag coefficient law.<br />
Figure 10<br />
Vcas<br />
(Km/h)<br />
Vcas<br />
(Kts)<br />
Mach<br />
Sustained<br />
Ng<br />
(read)<br />
Sustained<br />
Ng<br />
(computed)<br />
Error<br />
500 270 0.419 2.55 2.59 2%<br />
550 297 0.461 2.81 2.88 2%<br />
600 324 0.503 3.10 3.14 1%<br />
650 351 0.545 3.37 3.39 1%<br />
700 378 0.587 3.63 3.62 0%<br />
750 405 0.629 3.81 3.85 1%<br />
800 432 0.671 4.02 4.07 1%<br />
850 459 0.713 4.20 4.26 1%<br />
900 486 0.755 4.30 4.41 2%<br />
950 513 0.797 4.42 4.53 3%<br />
1000 540 0.839 4.54 4.47 -1%<br />
Page - 15
<strong>Mig</strong>-<strong>21</strong>-FM-Identification-Rev. 14<br />
Figure 11<br />
Vcas<br />
(Km/h)<br />
Vcas<br />
(Kts)<br />
Mach<br />
Sustained<br />
Ng<br />
Sustained<br />
Ng<br />
(computed)<br />
Error<br />
500 270 0.489 2.46 2.58 5%<br />
550 297 0.538 2.74 2.86 4%<br />
600 324 0.587 3.02 3.12 3%<br />
650 351 0.634 3.29 3.35 2%<br />
700 378 0.682 3.53 3.58 2%<br />
750 405 0.730 3.76 3.78 1%<br />
800 432 0.778 3.90 3.95 1%<br />
850 459 0.826 4.06 4.05 0%<br />
900 486 0.874 4.15 4.02 -3%<br />
950 513 0.922 4.23 3.74 -11%<br />
Figure 12<br />
Vcas<br />
(Km/h)<br />
Vcas<br />
(Kts)<br />
Mach<br />
Sustained<br />
Ng<br />
Sustained<br />
Ng<br />
(computed)<br />
Error<br />
500 270 0.548 2.41 2.44 1%<br />
550 297 0.600 2.65 2.69 1%<br />
600 324 0.651 2.91 2.91 0%<br />
650 351 0.702 3.14 3.13 0%<br />
700 378 0.754 3.36 3.35 0%<br />
750 405 0.805 3.56 3.56 0%<br />
800 432 0.856 3.73 3.67 -2%<br />
Page - 16
<strong>Mig</strong>-<strong>21</strong>-FM-Identification-Rev. 14<br />
2. <strong>Mig</strong>-<strong>21</strong> bis / iz.75A.<br />
General data.<br />
The L-17 is assumed to be a <strong>Mig</strong>-<strong>21</strong>bis /iz.75A<br />
with strengthened airframe.<br />
The flight model of the <strong>Mig</strong>-<strong>21</strong>bis is built from<br />
the one of the <strong>Mig</strong>-<strong>21</strong>M.<br />
The hypotheses are the following:<br />
- Same aerodynamics : CL(Mach ,AoA) and<br />
CD(Mach, AoA) laws (we will see later on that<br />
this assumption cannot be kept exactly)<br />
- Internal fuel capacity set to 2,750 l (2,200 kg /<br />
4,857 lbs @ 0.83 kg/l, but only 2,120 kg /<br />
4,680 lbs usable)<br />
- Empty weight set to 6,003 Kg / 13,251 lbs<br />
(including pilot and non usable fuel).<br />
- Engine changed from Tumanskiy R-11F2SK-<br />
300 to R-25-300<br />
o Military Thrust set to 40.20kN<br />
o Full After-Burner set to 69.65kN<br />
o Special After-Burner Regime (under<br />
4,000m /13,123 ft) set to 97.20kN<br />
Speed limitations:<br />
Speed limited to (first reached)<br />
- 1,300 km/h (702 Kts) IAS<br />
- Mach 2.05<br />
Load factor limitations:<br />
Load Factor (Ng) limitation depend on<br />
external loads, Mach number and internal fuel<br />
weight.<br />
They have been defined in reference to the<br />
table in appendix.<br />
Mach number < 0.8<br />
- Clean or 2 R-3S or R-60<br />
o Fuel < 900 l : 8.5g<br />
o Fuel < 4,100 l : 8g<br />
- 4 R-3S / R-60 : 7g<br />
- External tank(s) : 5g<br />
- Rocket pods : 5g<br />
- Bombs : 4g<br />
Mach number > 0.8<br />
- Clean or 2 R-3S<br />
o Fuel < 900 l : 7g<br />
o Fuel > 900 l : 6g<br />
- 4 R-3S : 6g<br />
- External tank(s) : 5g<br />
- Rocket pods : 5g<br />
- Bombs : 4g<br />
Configuration definition.<br />
Combat configuration “A”<br />
Aircraft loaded with 50% of usable internal<br />
fuel, Center Line pylon (but no CL Tank), 2 R-<br />
60 missiles with their pylon and launching rails<br />
under external wing stations.<br />
- Aircraft (zero usable fuel) : 6,003 kg<br />
- 200 gun ammo (Gsh 23) : 95 kg<br />
- 1 Center line pylon : 24 kg<br />
- 2 Under-wing pylon : 50 kg<br />
- Equipped zero usable fuel : 6,172 kg<br />
- 50% usable internal fuel : 1,060 kg<br />
@0.80 g/cm 3<br />
- Clean Combat Weight : 7,232 kg<br />
- 2 APU-60IM rails for R-60 : 70 kg<br />
- 2 Missile R-60 : 90 kg<br />
- Conf. “A” Combat weight : 7,392 kg<br />
This defines a gross weight of 7,392 kg<br />
(16,318 lbs) and a Drag Index of 11.<br />
Total fuel volume approximated to 1,375l<br />
Load factor limitation set to :<br />
- 8.0 (mach < 0.8)<br />
- 6.0 (mach > 0.8)<br />
Combat configuration “B”:<br />
Aircraft loaded with 50% of internal fuel,<br />
Center Line pylon (but no CL Tank), 2 R-60<br />
missiles with their pylon and launching rails<br />
under external wing station, plus two R-13M<br />
with their pylon and launching rails under<br />
internal wing stations.<br />
- Aircraft (zero usable fuel) : 6,003 kg<br />
- 200 gun ammo (Gsh 23) : 95 kg<br />
Page - 17
<strong>Mig</strong>-<strong>21</strong>-FM-Identification-Rev. 14<br />
- 1 Center line pylon : 24 kg<br />
- 2 Under-wing pylon : 50 kg<br />
- Equipped zero usable fuel : 6,172 kg<br />
- 50% usable internal fuel : 1,060 kg<br />
@0.83 g/cm 3<br />
- Clean Combat Weight : 7,232 kg<br />
- 2 APU-60IM rails for R-60 : 70 kg<br />
- 2 Missile R-60 : 90 kg<br />
- 2 additional wing pylons : 50 kg<br />
- 2 APU-13 rails for R-13M : 60 kg<br />
- 2 Missile R-13M : 184 kg<br />
- Conf. “B” Combat weight :7,686 kg<br />
This defines a gross weight of 16,967 lbs /<br />
7,986 kg and a Drag Index of 12.<br />
Total fuel volume approximated to 1,300l<br />
Load factor limitation set to :<br />
- 7.0 (mach < 0.8)<br />
- 6.0 (mach > 0.8)<br />
Military Thrust Law identification.<br />
The method to be used will be the same as the one described in <strong>Mig</strong>-<strong>21</strong>M section:<br />
- For each altitude (1,000m; 3,000m…)<br />
- Extract from L-17 manual figures the time required to accelerate from initial speed (usually<br />
400 km/h IAS) to 500, 550… km/h (values extracted for drag index of 11, figure assume being<br />
related to a gross weight of 8,000kg / 17,659 lbs<br />
- Translate IAS speed in km/h into mach number<br />
- Interpolate the obtained curve by a poly-line defined by (mach, time) couple where mach<br />
number values are 0.35, 0.45…<br />
- From time needed to go from M0.35 to 0.45, evaluate dV/dt (acceleration) at mach = 0.4<br />
- Then compute required thrust by:<br />
- Continue with M=0.45 and M=0.55 values to compute thrust for M=0.5…<br />
Page - 18
Mach Number<br />
Mach Number<br />
<strong>Mig</strong>-<strong>21</strong>-FM-Identification-Rev. 14<br />
Altitude of 500m / 1,640ft.<br />
1.000<br />
0.900<br />
105<br />
0.85<br />
0.800<br />
73<br />
0.75<br />
0.700<br />
54<br />
0.65<br />
0.600<br />
37<br />
0.55<br />
20.5<br />
0.500<br />
0.45<br />
3<br />
0.400<br />
0.35<br />
0.300<br />
0.200<br />
0.100<br />
0.000<br />
0.00 10.00 20.00 30.00 40.00 50.00 60.00 70.00 80.00 90.00 100.00 110.00 120.00 130.00<br />
Time (s)<br />
Extracted<br />
Sampled<br />
Mach<br />
V(TAS) dV/dt Ps Ps Thrust<br />
m/s (m/s**2) (m/s) (ft/s) (lbs)<br />
0.40 135 1.93 27 88 5,918<br />
0.50 169 2.05 35 116 6,349<br />
0.60 203 1.99 41 135 6,865<br />
0.70 237 1.78 43 141 7,311<br />
0.80 271 1.06 29 96 7,425<br />
Altitude of 3,000m / 9,843ft<br />
1.000<br />
0.900<br />
108<br />
0.85<br />
0.800<br />
81<br />
0.75<br />
0.700<br />
57.5<br />
0.65<br />
0.600<br />
35<br />
0.55<br />
13<br />
0.500<br />
0.45<br />
0.400<br />
0.300<br />
0.200<br />
0.100<br />
0.000<br />
0.00 10.00 20.00 30.00 40.00 50.00 60.00 70.00 80.00 90.00 100.00 110.00 120.00 130.00<br />
Time (s)<br />
Extracted<br />
Sampled<br />
Mach<br />
V(TAS) dV/dt Ps Ps Thrust<br />
m/s (m/s**2) (m/s) (ft/s) (lbs)<br />
0.40 131 1.49 20 66 5,152<br />
0.50 164 1.49 25 82 5,133<br />
0.60 197 1.46 29 96 5,343<br />
0.70 230 1.40 33 108 5,794<br />
0.80 263 1.22 33 107 6,369<br />
Page - 19
Mach Number<br />
Mach Number<br />
<strong>Mig</strong>-<strong>21</strong>-FM-Identification-Rev. 14<br />
Altitude of 5,000m / 16,404ft<br />
1.000<br />
165<br />
0.95<br />
0.900<br />
127<br />
0.85<br />
0.800<br />
93<br />
0.75<br />
0.700<br />
62<br />
0.65<br />
0.600<br />
34<br />
0.55<br />
2<br />
0.500<br />
0.45<br />
0.400<br />
0.300<br />
0.200<br />
0.100<br />
0.000<br />
0.00 10.00 20.00 30.00 40.00 50.00 60.00 70.00 80.00 90.00 100.00 110.00 120.00 130.00 140.00 150.00 160.00 170.00 180.00<br />
Time (s)<br />
Extracted<br />
Sampled<br />
Mach<br />
V(TAS) dV/dt Ps Ps Thrust<br />
m/s (m/s**2) (m/s) (ft/s) (lbs)<br />
0.40 128 0.94 12 40 4,186<br />
0.50 160 1.00 16 54 4,186<br />
0.60 192 1.14 22 74 4,557<br />
0.70 224 1.03 24 78 4,654<br />
0.80 256 0.94 25 81 5,126<br />
0.90 288 0.84 25 81 6,346<br />
In this case, thrust computed for M=0.4 and 0.9 (first and last value) are questionable, because it is<br />
quite difficult to estimate the local acceleration before M0.4 and after M0.9<br />
Altitude of 7,000m / 22,966ft<br />
1.000<br />
0.900<br />
180<br />
0.85<br />
0.800<br />
134<br />
0.75<br />
0.700<br />
86<br />
0.65<br />
0.600<br />
38<br />
0.55<br />
0.500<br />
0.400<br />
Extracted<br />
Sampled<br />
0.300<br />
0.200<br />
0.100<br />
0.000<br />
0.00 10.00 20.00 30.00 40.00 50.00 60.00 70.00 80.00 90.00 100.00 110.00 120.00 130.00 140.00 150.00 160.00 170.00 180.00 190.00<br />
Time (s)<br />
Mach<br />
V(TAS) dV/dt Ps Ps Thrust<br />
m/s (m/s**2) (m/s) (ft/s) (lbs)<br />
0.50 156 0.38 6 20 3,248<br />
0.60 187 0.65 12 41 3,558<br />
0.70 <strong>21</strong>9 0.65 14 48 3,683<br />
0.80 250 0.68 17 57 4,125<br />
Page - 20
Time (s)<br />
<strong>Mig</strong>-<strong>21</strong>-FM-Identification-Rev. 14<br />
The comparison between the computed data and the one extracted from the L-17 manual is<br />
summarized by the following figure: the computed values are displayed as B&W curves, the values<br />
extracted from manual are displayed as big colored dots.<br />
180<br />
165<br />
150<br />
135<br />
120<br />
105<br />
Level flight Acceleration<br />
1,640<br />
9,843<br />
16,404<br />
22,966<br />
RL 500m<br />
RL 3,000m<br />
RL 5,000m<br />
RL 7,000m<br />
90<br />
75<br />
60<br />
45<br />
30<br />
15<br />
0<br />
0.30 0.40 0.50 0.60 0.70 0.80 0.90 1.00 1.10 1.20 1.30 1.40 1.50 1.60<br />
Mach<br />
Figure 13<br />
Page - <strong>21</strong>
Mach Number<br />
Mach Number<br />
<strong>Mig</strong>-<strong>21</strong>-FM-Identification-Rev. 14<br />
Maximum After Burner Thrust Law identification.<br />
The same procedure will be applied using maximum after burner manual figures, but we have to<br />
consider to following obvious error in all these figures: initial speed is said 550km/h (indicated) when<br />
the first curve indicated the time required to reach 550 km/h, so I have to consider that initial speed is,<br />
in fact, 500 km/h indicated:<br />
Altitude of 1,000m / 3,281ft<br />
1.200<br />
86<br />
1.15<br />
1.100<br />
55<br />
1.05<br />
1.000<br />
41<br />
0.95<br />
29<br />
0.900<br />
0.85<br />
22<br />
0.800<br />
0.75<br />
15<br />
0.700<br />
0.65<br />
8<br />
0.600<br />
0.55<br />
1 0.500<br />
0.45<br />
0.400<br />
0.300<br />
0.00 10.00 20.00 30.00 40.00 50.00 60.00 70.00 80.00 90.00 100.00<br />
Time (s)<br />
Extracted<br />
Sampled<br />
Mach<br />
V(TAS) dV/dt Ps Ps Thrust<br />
m/s (m/s**2) (m/s) (ft/s) (lbs)<br />
0.40 135 5.61 77 252 5,743<br />
0.50 168 4.81 82 270 11,822<br />
0.60 202 4.81 99 324 12,141<br />
0.70 235 4.81 115 379 12,589<br />
0.80 269 4.81 132 433 13,531<br />
0.90 303 2.80 87 284 13,531<br />
1.00 336 2.40 82 270 16,720<br />
1.10 370 1.09 41 134 18,883<br />
Altitude of 3,000m / 9,843ft<br />
1.300<br />
103<br />
1.25<br />
1.200<br />
65<br />
1.15<br />
1.100<br />
44.5<br />
1.05<br />
32<br />
1.000<br />
0.95<br />
25<br />
0.900<br />
0.85<br />
18.5<br />
0.800<br />
0.75<br />
11<br />
0.700<br />
0.65<br />
4<br />
0.600<br />
0.55<br />
0.500<br />
0.400<br />
0.00 10.00 20.00 30.00 40.00 50.00 60.00 70.00 80.00 90.00 100.00 110.00<br />
Time (s)<br />
Extracted<br />
Sampled<br />
Mach<br />
V(TAS) dV/dt Ps Ps Thrust<br />
m/s (m/s**2) (m/s) (ft/s) (lbs)<br />
0.50 164 4.69 79 258 10,812<br />
0.60 197 4.69 94 309 11,113<br />
0.70 230 4.38 103 337 11,127<br />
0.80 263 5.06 135 444 13,296<br />
0.90 296 4.69 141 464 14,551<br />
1.00 329 2.63 88 289 15,174<br />
1.10 361 1.60 59 194 16,634<br />
1.20 394 0.86 35 114 17,065<br />
Page - 22
Mach Number<br />
Mach Number<br />
<strong>Mig</strong>-<strong>21</strong>-FM-Identification-Rev. 14<br />
Altitude of 5,000m / 16,404ft<br />
1.500<br />
145<br />
1.45<br />
1.400<br />
108<br />
1.35<br />
1.300<br />
83<br />
1.25<br />
64<br />
1.200<br />
1.15<br />
51<br />
1.100<br />
1.05<br />
37.5<br />
1.000<br />
0.95<br />
28<br />
0.900<br />
0.85<br />
19<br />
0.800<br />
0.75<br />
9.5<br />
0.700<br />
0.65<br />
0<br />
0.600<br />
0.55<br />
0.500<br />
0.400<br />
0.00 10.00 20.00 30.00 40.00 50.00 60.00 70.00 80.00 90.00 100.00 110.00 120.00 130.00 140.00 150.00 160.00<br />
Time (s)<br />
Extracted<br />
Sampled<br />
Mach<br />
V(TAS) dV/dt Ps Ps Thrust<br />
m/s (m/s**2) (m/s) (ft/s) (lbs)<br />
0.60 192 3.37 66 <strong>21</strong>7 8,823<br />
0.70 224 3.37 77 253 8,956<br />
0.80 256 3.56 93 305 9,874<br />
0.90 288 3.37 99 325 10,926<br />
1.00 3<strong>21</strong> 2.37 78 255 12,432<br />
1.10 353 2.47 89 291 14,652<br />
1.20 385 1.69 66 <strong>21</strong>7 15,115<br />
1.30 417 1.28 54 179 16,140<br />
1.40 449 0.87 40 130 17,145<br />
Altitude of 7,000m / 22,966ft<br />
1.700<br />
175<br />
1.600<br />
1.55<br />
134<br />
1.500<br />
1.45<br />
103<br />
1.400<br />
1.35<br />
82<br />
1.300<br />
1.25<br />
63<br />
1.200<br />
1.15<br />
49<br />
1.100<br />
1.05<br />
35.5<br />
1.000<br />
0.95<br />
24.5<br />
0.900<br />
0.85<br />
14<br />
0.800 0.75<br />
4<br />
0.700 0.65<br />
0.600<br />
0.500<br />
0.400<br />
0.00 10.00 20.00 30.00 40.00 50.00 60.00 70.00 80.00 90.00 100.00110.00120.00130.00140.00150.00160.00170.00180.00190.00200.00<br />
Time (s)<br />
Extracted<br />
Sampled<br />
Mach<br />
V(TAS) dV/dt Ps Ps Thrust<br />
m/s (m/s**2) (m/s) (ft/s) (lbs)<br />
0.60 187 2.60 50 163 7,029<br />
0.70 <strong>21</strong>9 3.12 70 228 8,128<br />
0.80 250 2.97 76 248 8,<strong>21</strong>2<br />
0.90 281 2.84 81 267 8,993<br />
1.00 312 2.31 74 242 10,569<br />
1.10 343 2.23 78 256 12,347<br />
1.20 375 1.64 63 206 12,347<br />
1.30 406 1.49 62 202 13,238<br />
1.40 437 1.01 45 147 13,772<br />
1.50 468 0.76 36 119 15,012<br />
1.60 500 0.42 <strong>21</strong> 70 16,057<br />
The comparison between the computed data and the one extracted from the L-17 manual is<br />
summarized by the following figure: the computed values are displayed as B&W curves, the values<br />
extracted from manual are displayed as big colored dots.<br />
Page - 23
Time (s)<br />
<strong>Mig</strong>-<strong>21</strong>-FM-Identification-Rev. 14<br />
180<br />
165<br />
150<br />
135<br />
120<br />
105<br />
3,281<br />
9,843<br />
16,404<br />
22,966<br />
RL 1,000m<br />
RL 3,000m<br />
RL 5,000m<br />
RL 7,000m<br />
Level <strong>Flight</strong> Acceleration<br />
90<br />
75<br />
60<br />
45<br />
30<br />
15<br />
0<br />
0.30 0.40 0.50 0.60 0.70 0.80 0.90 1.00 1.10 1.20 1.30 1.40 1.50 1.60<br />
Mach<br />
Fig.14<br />
Page - 24
Mach Number<br />
<strong>Mig</strong>-<strong>21</strong>-FM-Identification-Rev. 14<br />
Special After Burner Thrust Law identification.<br />
The Special regime is available from sea-level to 4,000m (13,123 ft), and L-17 Performance manual<br />
give Level flight acceleration schedule at 1000 and 3000m, and Sustained Load Factor at 1,000, 2,000<br />
and 3,000m.<br />
I shall start by defining Thrust curve at 3,000m (thrust in lbs for each mach number value) using level<br />
flight acceleration schedule, then do the same with manual figure related to 1,000m.<br />
Altitude of 3,000m / 9,843ft<br />
1.300<br />
74<br />
1.25<br />
1.200<br />
55<br />
1.15<br />
1.100<br />
43<br />
1.05<br />
33<br />
1.000<br />
0.95<br />
26<br />
0.900<br />
0.85<br />
19<br />
0.800<br />
0.75<br />
12<br />
0.700<br />
0.65<br />
5<br />
0.600<br />
0.55<br />
0.500<br />
0.400<br />
0.300<br />
0.00 10.00 20.00 30.00 40.00 50.00 60.00 70.00 80.00 90.00 100.00<br />
Time (s)<br />
Extracted<br />
Sampled<br />
Mach<br />
V(TAS) dV/dt Ps Ps Thrust<br />
m/s (m/s**2) (m/s) (ft/s) (lbs)<br />
0.50 164 4.11 69 226 10,811<br />
0.60 197 4.69 94 309 11,114<br />
0.70 230 4.69 110 361 11,124<br />
0.80 263 4.69 126 413 13,284<br />
0.90 296 4.69 141 464 14,576<br />
1.00 329 3.29 110 361 16,387<br />
1.10 361 2.74 101 331 18,266<br />
1.20 394 1.73 70 228 18,266<br />
At this altitude, one can note that there is no significant difference between “maximum after burner”<br />
and “Special Regime” for mach number lower than 0.9.<br />
Altitude of 1,000m / 3,281ft<br />
Page - 25
Time (s)<br />
Mach Number<br />
<strong>Mig</strong>-<strong>21</strong>-FM-Identification-Rev. 14<br />
1.300<br />
1.200<br />
62<br />
1.15<br />
1.100<br />
41.5<br />
1.05<br />
1.000<br />
32.5<br />
0.95<br />
25.5<br />
0.900<br />
0.85<br />
19.5<br />
0.800<br />
0.75<br />
14<br />
0.700<br />
0.65<br />
8<br />
0.600<br />
0.55<br />
1.5<br />
0.500<br />
0.45<br />
0.400<br />
0.300<br />
0.00 10.00 20.00 30.00 40.00 50.00 60.00 70.00 80.00 90.00 100.00<br />
Time (s)<br />
Extracted<br />
Sampled<br />
Mach<br />
V(TAS) dV/dt Ps Ps Thrust<br />
m/s (m/s**2) (m/s) (ft/s) (lbs)<br />
0.50 168 5.18 89 291 11,374<br />
0.60 202 5.61 115 379 13,260<br />
0.70 235 6.12 147 482 14,826<br />
0.80 269 5.61 154 505 15,544<br />
0.90 303 4.81 148 487 16,311<br />
1.00 336 3.74 128 4<strong>21</strong> 19,915<br />
1.10 370 1.64 62 203 20,529<br />
The comparison between the computed data and the one extracted from the L-17 manual is<br />
summarized by the following figure: the computed values are displayed as B&W curves, the values<br />
extracted from manual are displayed as big dots.<br />
180<br />
165<br />
150<br />
135<br />
3,281<br />
9,843<br />
RL 1,000m<br />
Level <strong>Flight</strong> Acceleration<br />
120<br />
RL 3,000m<br />
105<br />
90<br />
75<br />
60<br />
45<br />
30<br />
15<br />
0<br />
0.30 0.40 0.50 0.60 0.70 0.80 0.90 1.00 1.10 1.20 1.30 1.40 1.50 1.60<br />
Mach<br />
Fig.15<br />
Page - 26
<strong>Mig</strong>-<strong>21</strong>-FM-Identification-Rev. 14<br />
Sustained load factor - validation.<br />
This section of the analysis is to recalibrate the drag versus lift law, starting from the one that has been<br />
defined for <strong>Mig</strong>-<strong>21</strong>M / L-15.<br />
If the coefficient (0.<strong>21</strong> and 0.5) can be kept, sustained load factor computed from thrust curves<br />
identified in previous section will fit accurately the values extracted from <strong>Mig</strong>-<strong>21</strong>bis / L-17 Manual.<br />
An error of less than 5% over the complete range is to be accepted, if more, the Drag versus lift law<br />
has to be revisited.<br />
First computation shows error of more than 15% in high AoA condition, forcing to redefined optimum<br />
values for the Drag laws as follow:<br />
Maximum After-Burner Power, Altitude of 1,000m<br />
Vcas<br />
(Km/h)<br />
Vcas<br />
(Kts)<br />
Mach<br />
Sustained<br />
Ng<br />
(read)<br />
Sustained<br />
Ng<br />
(computed)<br />
Error<br />
500 270 0.430 2.47 2.67 8%<br />
550 297 0.474 2.89 2.98 3%<br />
600 324 0.517 3.23 3.31 3%<br />
650 351 0.560 3.54 3.64 3%<br />
700 378 0.603 3.88 3.97 2%<br />
750 405 0.646 4.15 4.25 2%<br />
800 432 0.689 4.47 4.50 0%<br />
850 459 0.732 4.79 4.73 -1%<br />
900 486 0.775 5.01 4.96 -1%<br />
950 513 0.818 5.40 5.07 -6%<br />
Page - 27
<strong>Mig</strong>-<strong>21</strong>-FM-Identification-Rev. 14<br />
Maximum After-Burner Power, Altitude of 3,000m<br />
Vcas<br />
(Km/h)<br />
Vcas<br />
(Kts)<br />
Mach<br />
Sustained<br />
Ng<br />
(read)<br />
Sustained<br />
Ng<br />
(computed)<br />
Error<br />
500 270 0.489 2.33 2.64 13%<br />
550 297 0.538 2.70 2.95 9%<br />
600 324 0.587 2.97 3.25 9%<br />
650 351 0.634 3.23 3.53 9%<br />
700 378 0.682 3.50 3.78 8%<br />
750 405 0.730 3.80 4.11 8%<br />
800 432 0.778 4.12 4.52 10%<br />
850 459 0.826 4.41 4.74 7%<br />
900 486 0.874 4.61 4.74 3%<br />
The error relative values are greater for 3,000m/9,843ft than for other altitude, I have no idea why. For<br />
other altitudes (1,000m and 5,000m), thrust law deduced from level flight acceleration combined with<br />
a unique aerodynamic model (independent from altitude) give the same range of values for relative<br />
error.<br />
Please note also that, even in the worst case, sustained load factor error remain less than 0.31G<br />
Let’s try to analyze the solving of one of this configuration (Vcas=650Km/h)<br />
We start from thrust definition by level flight acceleration at 3,000m, assuming that a Vcas of<br />
650Km/h is equivalent to a mach number of 0.634 (ISA at 9,843ft), we will use section b) data (raw)<br />
and the values after curve smoothing (fig.15),:<br />
Mach number Raw Ps Raw Thrust Smoothed Ps Smoothed Thrust<br />
0.600 309 ft/s 11,113 lbs 306 ft/s 11,114 lbs<br />
0.634 317 ft/s 11,118 lbs<br />
0.700 337 ft/s 11,127 lbs 334 ft/s 11,124 lbs<br />
The smoothed thrust values are computed in solving equation (3.3) for Mach=0.634 and Ps=317 ft/s<br />
Page - 28
<strong>Mig</strong>-<strong>21</strong>-FM-Identification-Rev. 14<br />
(3.3)<br />
Where:<br />
- g = 9.81 m/s 2<br />
- Ps = 317 ft/s (96.62 m/s)<br />
- M = 17,659 lbs (8,000 Kg)<br />
- A(z=3,000m) = 1,078 ft/s (328.58 m/s)<br />
- (z=3,000m) = 0.001764522 slug/ft 3<br />
- S = 247.57 sqr.ft (23 m 2 )<br />
- Cz is linear vs AoA between<br />
o C z (M=0.6, AoA=0) = 0 and C z (M=0.6, AoA=28) = 0.698<br />
o C z (M=0.7, AoA=0) = 0 and C z (M=0.7, AoA=28) = 0.717<br />
- Cx = (C x0 + 0.23*C z 2 ) + 0.002 for C z < 0.5<br />
- Cx = (C x0 + 0.23*C z 2 + 0.8*( C z -0.5) 2 ) + 0.002 for C z > 0.5<br />
o C x0 = 0.0200 (for Drag Index of 10)<br />
o the 0.002 extra points being related to the Drag index of 12<br />
At Mach=0.634, the solution is:<br />
- AoA = 6.4 deg<br />
- C x = 0.02799<br />
- C z = 0.16094<br />
- Thrust = 11,118 lbs<br />
Then we will solve:<br />
If we fix Ng=3.23, the solution is:<br />
- AoA = 20.9 deg<br />
- C x = 0.086299<br />
- C z = 0.526081<br />
- Thrust = 9,428 lbs<br />
If we fix Thrust = 11,118 lbs, the solution is:<br />
- AoA = 22.62 deg<br />
- C x = 0.100578723<br />
- C z = 0.569262599<br />
- Ng = 3.53<br />
So the difference of 9% in sustained load factor is equivalent to a thrust difference of 15.2%<br />
Page - 29
<strong>Mig</strong>-<strong>21</strong>-FM-Identification-Rev. 14<br />
Now compare this analysis with one where the difference between the value read in the manual and<br />
the one predict by the model is very low: let’s chose 750 Km/h (IAS) at 1,000m (Mach 0.646)<br />
The level flight acceleration curve analysis requires an Excess Specific Power of 357 ft/s giving a<br />
thrust of 12,437 lbs.<br />
The flight model (with the hypotheses used for our 3,000m computation) and this thrust value give:<br />
- AoA = 20.6 deg<br />
- C x = 0.084714<br />
- C z = 0.51998<br />
- Ng = 3.25 (+2%)<br />
The sustained load factor is said (in manual) to be 4.15g that can be reached (with the hypotheses used<br />
for our 3,000m computation) with:<br />
- AoA = 20.16 deg<br />
- C x = 0.081746<br />
- C z = 0.50883<br />
- Thrust = 11,844 lbs (-3.5%)<br />
We can see that the flight model is valid (2%) for mach number close to 0.640 and AoA close to <strong>21</strong><br />
deg at 1,000m but less accurate at 3,000m (9%)<br />
Maximum After-Burner Power, Altitude of 5,000m<br />
Vcas<br />
(Km/h)<br />
Vcas<br />
(Kts)<br />
Mach<br />
Sustained<br />
Ng<br />
(read)<br />
Sustained<br />
Ng<br />
(computed)<br />
Error<br />
500 270 0.548 2.22 2.36 6%<br />
550 297 0.600 2.47 2.61 5%<br />
600 324 0.651 2.73 2.85 4%<br />
650 351 0.702 2.97 3.07 4%<br />
700 378 0.754 3.19 3.34 5%<br />
750 405 0.805 3.48 3.58 3%<br />
800 432 0.856 3.72 3.74 1%<br />
850 459 0.908 3.85 3.82 -1%<br />
Page - 30
<strong>Mig</strong>-<strong>21</strong>-FM-Identification-Rev. 14<br />
Special After-Burner Power, Altitude of 1,000m<br />
Vcas<br />
(Km/h)<br />
Vcas<br />
(Kts)<br />
Mach<br />
Sustained<br />
Ng<br />
(read)<br />
Sustained<br />
Ng<br />
(computed)<br />
Error<br />
550 297 0.474 3.09 2.98 -4%<br />
600 324 0.517 3.36 3.33 -1%<br />
650 351 0.560 3.64 3.75 3%<br />
700 378 0.603 3.92 4.16 6%<br />
750 405 0.646 4.27 4.57 7%<br />
800 432 0.689 4.56 4.97 9%<br />
850 459 0.732 4.93 5.28 7%<br />
900 486 0.775 5.25 5.53 5%<br />
950 513 0.818 5.70 5.71 0%<br />
1000 540 0.861 5.79 5.79 0%<br />
Special After-Burner Power, Altitude of 2,000m<br />
Vcas<br />
Vcas<br />
Mach<br />
Sustained<br />
Ng<br />
(read)<br />
Sustained<br />
Ng<br />
(computed)<br />
Error<br />
(Km/h) (Kts)<br />
550 297 0.502 2.84 2.96 4%<br />
600 324 0.548 3.03 3.32 9%<br />
650 351 0.594 3.41 3.68 8%<br />
700 378 0.639 3.71 4.03 8%<br />
750 405 0.685 3.93 4.36 11%<br />
800 432 0.731 4.28 4.69 10%<br />
850 459 0.776 4.63 5.02 8%<br />
900 486 0.822 5.05 5.26 4%<br />
950 513 0.867 5.15 5.39 5%<br />
1000 540 0.912 5.23 5.44 4%<br />
Page - 31
<strong>Mig</strong>-<strong>21</strong>-FM-Identification-Rev. 14<br />
For this altitude only, I got an error between values extracted from manual and the one computed, this<br />
can be explained because the model I built do not have a thrust law for 2,000m, but only a linear<br />
interpolation between sea-level and 3,000m, where real life thrust variation upon altitude seems not<br />
being really linear.<br />
Special After-Burner Power, Altitude of 3,000m<br />
Vcas<br />
(Km/h)<br />
Vcas<br />
(Kts)<br />
Mach<br />
Sustained<br />
Ng<br />
(read)<br />
Sustained<br />
Ng<br />
(computed)<br />
Error<br />
550 297 0.538 2.79 2.95 6%<br />
600 324 0.587 3.06 3.25 6%<br />
650 351 0.634 3.26 3.53 8%<br />
700 378 0.682 3.58 3.78 5%<br />
750 405 0.730 3.84 4.11 7%<br />
800 432 0.778 4.<strong>21</strong> 4.52 7%<br />
850 459 0.826 4.46 4.82 8%<br />
900 486 0.874 4.70 5.01 7%<br />
950 513 0.922 4.86 5.05 4%<br />
The error values are very close to (or lower than) the one obtained for Maximum-After-Burner regime.<br />
Page - 32
<strong>Mig</strong>-<strong>21</strong>-FM-Identification-Rev. 14<br />
3. <strong>Mig</strong>-<strong>21</strong> MF / iz.96F<br />
The flight model of the <strong>Mig</strong>-<strong>21</strong>MF is built<br />
from the one of the <strong>Mig</strong>-<strong>21</strong>M and <strong>Mig</strong>-<strong>21</strong>bis<br />
due to the fact that very few performance data<br />
are available for this particular type (also<br />
identified as L-16).<br />
The basic hypotheses are the following:<br />
- Same aerodynamics as <strong>Mig</strong>-<strong>21</strong>M/iz.96A :<br />
CL(Mach ,AoA) and CD(Mach, AoA)<br />
curves<br />
- Empty weight is said (source is an ex<br />
<strong>Mig</strong>-<strong>21</strong> Cuban pilot, Cuban Air Force<br />
operating both <strong>Mig</strong>-<strong>21</strong>MF and bis) 220-<br />
240 Kg lighter than the <strong>Mig</strong>-<strong>21</strong>bis. If we<br />
take 6,003 Kg as empty weight for <strong>Mig</strong>-<br />
<strong>21</strong>bis/iz.75A, this give a <strong>Mig</strong>-<br />
<strong>21</strong>MF/iz.96F empty weight between<br />
5,763 and 5,783Kg, knowing that <strong>Mig</strong>-<br />
<strong>21</strong>M/iz.96A empty weight is 5,760Kg, we<br />
can consider that <strong>Mig</strong>-<strong>21</strong>MF/iz.96F<br />
empty weight is the same.<br />
- Engine changed to Tumanskiy R-13-300<br />
(in between R-11F2SK-300 and R-25-<br />
300)<br />
o Military Thrust from set to 39.90kN<br />
(between 38.14kN and 40.20kN)<br />
o Full After-Burner thrust set to<br />
63.70kN (between 60.05kN and<br />
69.65 kN)<br />
General data.<br />
Empty weight (including pilot, no pylon, no<br />
gun ammo) : 12,715 lbs / 5,760 kg<br />
Reference Area : 247.57 sq.ft / 23.0 m 2<br />
Internal fuel : 2,600 l @ 0.83kg/l<br />
: 2,158 Kg / 4,763 lbs<br />
Speed limitations:<br />
Speed limited to (first reached)<br />
- 1,300 km/h (702 Kts) IAS<br />
- Mach 2.1<br />
Load factor limitations:<br />
Load Factor (Ng) limitation depend on<br />
external loads, Mach number and internal fuel<br />
weight.<br />
They are assumed to be the same for <strong>Mig</strong>-<br />
<strong>21</strong>M/iz.96A and <strong>Mig</strong>-<strong>21</strong>MF/iz.96F. (refer to<br />
appendix)<br />
Mach number < 0.8<br />
- Clean or 2 R-3S<br />
o Fuel < 1,200 l : 8.5g<br />
o Fuel < 1,600 l : 8g<br />
o Fuel > 1,600 l : 7g<br />
- 4 R-3S : 7g<br />
- External tank(s) : 5g<br />
- Rocket pods : 5g<br />
- Bombs : 4g<br />
Mach number > 0.8<br />
- Clean or 2 R-3S<br />
o Fuel < 1,200 l : 7g<br />
o Fuel > 1,200 l : 6g<br />
- 4 R-3S : 6g<br />
- External tank(s) : 5g<br />
- Rocket pods : 5g<br />
- Bombs : 4g<br />
Configuration definition.<br />
Combat configuration “A”<br />
Aircraft loaded with 50% of usable internal<br />
fuel, Center Line pylon (but no CL Tank), 2 R-<br />
3S missiles with their pylon and launching<br />
rails under external wing stations.<br />
- Aircraft (zero usable fuel) : 5,760 kg<br />
- 200 gun ammo (Gsh 23) : 75 kg<br />
- 1 Center line pylon : 24 kg<br />
- 2 Under-wing pylon : 45 kg<br />
- Equipped zero usable fuel : 5,904 kg<br />
- 50% usable internal fuel : 1,005 kg<br />
(2,<strong>21</strong>9 lbs @0.83 g/cm 3 )<br />
- Clean Combat Weight : 6,909 kg<br />
- 2 APU-3S rails for R-3S : 41 kg<br />
- 2 Missile R-3S : 150 kg<br />
- Conf. “A” Combat weight : 7,100 kg<br />
This defines a gross weight of 7,100 kg<br />
(15,673 lbs) and a Drag Index of 12.<br />
Page - 33
<strong>Mig</strong>-<strong>21</strong>-FM-Identification-Rev. 14<br />
Total fuel volume approximated to 1,300l<br />
Load factor limitation set to :<br />
- 8.0 (mach < 0.8)<br />
- 6.0 (mach > 0.8)<br />
Combat configuration “B”:<br />
Aircraft loaded with 50% of internal fuel,<br />
Center Line pylon (but no CL Tank), 4 R-3S<br />
missiles with their pylon and launching rails<br />
under wing (internal and external).<br />
- Aircraft (zero usable fuel) : 5,760 kg<br />
- 200 gun ammo (Gsh 23) : 75 kg<br />
- 1 Center line pylon : 24 kg<br />
- 2 Under-wing pylon : 45 kg<br />
- Equipped zero usable fuel : 5,904 kg<br />
- 50% usable internal fuel : 1,005 kg<br />
(2,<strong>21</strong>9 lbs @0.83 g/cm 3 )<br />
- Clean Combat Weight : 6,909 kg<br />
- 2 additional wing pylons : 45 kg<br />
- 4 APU-3S rails for R-3S : 82 kg<br />
- 4 Missile R-3S : 300 kg<br />
- Conf. “B” Combat weight :7,336 kg<br />
This defines a gross weight of 16,194 lbs /<br />
7,336 kg and a Drag Index of 13.<br />
Total fuel volume approximated to 1,300l<br />
Load factor limitation set to :<br />
- 7.0 (mach < 0.8)<br />
- 6.0 (mach > 0.8)<br />
Thrust Law validation.<br />
Concerning the Military Thrust table, the values have been set using a proportional law:<br />
As there is no available data to validate this information, I decide to keep it as it is.<br />
The only available performance data available at the moment for <strong>Mig</strong>-<strong>21</strong>MF are 2 diagrams describing<br />
sustained load factor and instantaneous climb rate (extra specific power) at 500m along air speed (but<br />
the gross weight is unknown)<br />
I shall use these figures to calibrate Thrust curve in using a constant factor (k) defined by:<br />
It is clear that if the k factor is far away from 1.00, we would have to find an explanation.<br />
Validation by Sustained load factor fitting:<br />
The figure (Rys.11.2) gives Sustained load factor (Ng) along speed at 500m altitude. The relation<br />
between thrust and Ng is given by:<br />
Page - 34
<strong>Mig</strong>-<strong>21</strong>-FM-Identification-Rev. 14<br />
The values read from the figure are the following:<br />
If I do assume this figure is related to a clean configuration (nor payload nor pylon, giving a Drag<br />
Index of 7) with a gross weight of 6,500 kg (14,350 lbs, with around 60% of internal fuel) with<br />
Standard atmosphere (ISA) I can compare computed performance to those extracted from figure. Here<br />
are the results with a k factor set to 1.00:<br />
Mach<br />
Ng<br />
(figure)<br />
Ng<br />
(computed)<br />
Difference<br />
(%)<br />
Mach<br />
Turn Rate<br />
(figure)<br />
Turn Rate<br />
(Computed)<br />
Difference<br />
(deg/s)<br />
0.50 3.91 3.94 1% 12.56 12.66 0.10<br />
0.60 4.67 4.87 4% 12.63 13.20 0.57<br />
0.70 5.37 5.58 4% 12.52 13.03 0.51<br />
0.80 6.14 6.11 0% 12.58 12.52 -0.06<br />
0.90 6.23 5.76 -8% 11.35 10.47 -0.88<br />
1.00 4.92 3.74 -24% 8.00 5.99 -2.02<br />
Ng<br />
Turn Rate<br />
(d/s)<br />
0.50 3.91 12.56<br />
0.60 4.67 12.63<br />
0.70 5.37 12.52<br />
0.80 6.14 12.58<br />
0.90 6.23 11.35<br />
1.00 4.92 8.00<br />
Validation by Excess Specific Power.<br />
The figure (Rys.11.1) gives Excess Specific Power (Ps) at 500m altitude.<br />
The relation between Extra Specific Power and Thrust (Th) is:<br />
The figure “Rys.11.1” gives the following values:<br />
M=0.5<br />
M=0.6<br />
M=0.7<br />
M=0.8<br />
M=0.9<br />
M=1.0<br />
M=1.08<br />
Ps = 357 ft/s<br />
Ps = 437 ft/s<br />
Ps = 490 ft/s<br />
Ps = 518 ft/s<br />
Ps = 490 ft/s<br />
Ps = 263 ft/s<br />
Ps = 0 ft/s<br />
If I do apply the same validation process than I use for<br />
sustained turn rate (gross weight of 6,500 kg, clean<br />
aircraft, ISA conditions, k factor let to 1.00), I can<br />
Page - 35
<strong>Mig</strong>-<strong>21</strong>-FM-Identification-Rev. 14<br />
produce the following comparison table:<br />
Mach<br />
Ps ft/s<br />
(figure)<br />
Ps ft/s<br />
(computed)<br />
Difference<br />
(%)<br />
0.50 357 311 -13%<br />
0.60 437 380 -13%<br />
0.70 490 433 -12%<br />
0.80 518 458 -12%<br />
0.90 490 362 -26%<br />
1.00 263 132 -50%<br />
The difference of 12-13% measured from M0.5 to M0.8 is not possible to explain for me without<br />
imagining an aerodynamic behavior really far away the one of <strong>Mig</strong>-<strong>21</strong>M or <strong>Mig</strong>-<strong>21</strong>bis, so I can only<br />
have doubt about the accuracy of the figure Rys.11.1<br />
Page - 36
<strong>Mig</strong>-<strong>21</strong>-FM-Identification-Rev. 14<br />
4. Annexes.<br />
Standard Atmosphere and Corrected Air Speed (CAS).<br />
h<br />
(ft)<br />
A(z)<br />
(M=1 ft/s)<br />
rho(z)<br />
slug / ft 3 M=1<br />
(m/s TAS)<br />
0 1116.45 0.0023769 340.29<br />
5,000 1097.09 0.0020481 334.39<br />
10,000 1077.39 0.0017553 328.39<br />
15,000 1057.32 0.0014957 322.27<br />
20,000 1036.86 0.0012665 316.03<br />
25,000 1015.98 0.0010652 309.67<br />
30,000 994.67 0.0008894 303.18<br />
35,000 972.9 0.0007366 296.54<br />
40,000 968.08 0.0005851 295.07<br />
45,000 968.08 0.0004601 295.07<br />
50,000 968.08 0.0003618 295.07<br />
55,000 968.08 0.0002846 295.07<br />
60,000 968.08 0.0002238 295.07<br />
65,000 968.08 0.000176 295.07<br />
70,000 968.08 0.0001384 295.07<br />
75,000 968.08 0.0001089 295.07<br />
80,000 968.08 8.554E-05 295.07<br />
85,000 968.08 6.653E-05 295.07<br />
90,000 968.08 5.15E-05 295.07<br />
95,000 968.08 4.011E-05 295.07<br />
100,000 968.08 3.138E-05 295.07<br />
CAS<br />
(Mach / ft)<br />
0.00 0.50 1.00 1.25 1.50 2.00 3.00<br />
0 0 330 660 825 1000 1325 1975<br />
5,000 0 305 610 760 920 1225 1835<br />
10,000 0 275 555 700 840 1125 1695<br />
15,000 0 250 520 640 775 1025 1525<br />
20,000 0 230 475 585 710 950 1430<br />
25,000 0 205 430 525 640 865 1315<br />
30,000 0 185 390 475 585 790 1200<br />
35,000 0 165 350 435 525 720 1110<br />
40,000 0 145 315 400 475 650 1000<br />
45,000 0 130 280 360 440 590 890<br />
50,000 0 115 250 325 390 535 825<br />
55,000 0 105 220 285 350 475 725<br />
60,000 0 93 195 255 320 425 635<br />
65,000 0 83 174 227 285 386 565<br />
70,000 0 75 157 205 257 342 510<br />
75,000 0 66 139 182 229 304 454<br />
80,000 0 60 126 165 207 274 410<br />
85,000 0 54 114 149 186 248 370<br />
90,000 0 48 101 133 166 2<strong>21</strong> 330<br />
95,000 0 42 89 116 146 194 290<br />
100,000 0 40 83 108 136 181 270<br />
Page - 37
<strong>Mig</strong>-<strong>21</strong>-FM-Identification-Rev. 14<br />
Load factor limits (Ng).<br />
At the moment, here are the Load factor operational limits documents we have:<br />
<strong>Mig</strong>-<strong>21</strong>bis (Russian)<br />
The table on the left can be translated as follow:<br />
Maximum Indicated Air Speed : 1,300 km/h<br />
Maximum Mach number : 2.05<br />
For Mach number lower than 0.8<br />
Ng < 8.5 if Fuel less than 900 l.<br />
Ng < 8.0 if Fuel less than 4,100 l.<br />
For Mach number over 0.8<br />
Ng < 7.0 if Fuel less than 900 l.<br />
In addition, from testimony of a Cuban Air Force pilot we<br />
also have<br />
- When loaded with rocket pods or external tanks with fuel, Ng is limited to 5 (meaning that empty<br />
external tank do not limit load factor)<br />
- When loaded with bombs Ng is limited to 4.<br />
<strong>Mig</strong>-<strong>21</strong>MF/iz.96F<br />
The table on the left can be translated as follow:<br />
Altitude under 11,500 m<br />
Maximum Indicated Air Speed : 1,300 km/h<br />
Altitude over 11,500 m<br />
Maximum Mach number : 2.1<br />
For Mach number lower than 0.8<br />
Ng < 8.5 if Fuel less than 1,200 l.<br />
Ng < 8.0 if Fuel less than 1,600 l.<br />
Ng < 7.0 if Fuel more than 1,200 l or 4 R-3S. (looks like a typo error here, I believe<br />
“more than 1,600l)<br />
For Mach number over 0.8<br />
Ng < 7.0 if Fuel less than 1,200 l.<br />
Ng < 6.0 if Fuel more than 1,200 l or 4 R-3S.<br />
There are also some additional figures indicating limitations that doe not fit with the one described<br />
below:<br />
Page - 38
Page - 39<br />
<strong>Mig</strong>-<strong>21</strong>-FM-Identification-Rev. 14
<strong>Mig</strong>-<strong>21</strong>-FM-Identification-Rev. 14<br />
5. Change Log.<br />
Revision 14:<br />
- Correction of load factor limitations for all versions.<br />
- Correction of <strong>Mig</strong>-<strong>21</strong>MF Empty weight according Cuban pilot testimony.<br />
- Weight refining for MIG-<strong>21</strong>M (-7kg), MIG-<strong>21</strong>Bis (-40kg)<br />
- Load factor limits description changed, and addition of limits with 4 AA (R-3S or R-60)<br />
missiles loaded<br />
- Introduction of the “B” configurations for the 3 versions, all with 4 AA missiles.<br />
Revision 13:<br />
- Page 12: mention of the swimming flaps device and its impact on lift.<br />
- Page 29: addition of the analysis of the difference between forecast and measured value for<br />
MIG-<strong>21</strong>bis maximum sustained load factor at maximum after burner regime at 3,000m<br />
Page - 40