Workshop Proceedings - Inter Islamic Network on Space Sciences ...
Workshop Proceedings - Inter Islamic Network on Space Sciences ...
Workshop Proceedings - Inter Islamic Network on Space Sciences ...

You also want an ePaper? Increase the reach of your titles
YUMPU automatically turns print PDFs into web optimized ePapers that Google loves.
Theme 1: Country Reports<br />
This approach requires a high resoluti<strong>on</strong> satellites images<br />
Spot 5, a systematic sampling scheme as described<br />
previously.<br />
The estimati<strong>on</strong> of area cereal crop is calculated in the site<br />
by the Equati<strong>on</strong> (1) and calculated in province by the<br />
Equati<strong>on</strong> (2)<br />
Sn-1 is the estimated area in the site year (n-1)<br />
Sn the estimated area in the site year (n)<br />
obtained and expressed by the following equati<strong>on</strong>:<br />
•1 is the regressi<strong>on</strong> coefficient<br />
• is the origin value<br />
NDVI: Normalized Difference Vegetati<strong>on</strong> Index<br />
Yield : Yields of Durum Wheat, Soft Wheat and Barley<br />
This model uses different parameters by each province<br />
and for each cereal speculati<strong>on</strong>.<br />
Results<br />
Sn-1 is the estimated area in the province year (n-1)<br />
Sn is the estimated area in the province year (n)<br />
Statistical Method Using Spot Vegetati<strong>on</strong> Images<br />
This method (Fig. 4) requires the use of data extracted<br />
from the low resoluti<strong>on</strong> images spot vegetati<strong>on</strong>, and the<br />
historical data of cultivated areas by speculati<strong>on</strong> (Durum<br />
Wheat, Soft Wheat and Barley). The objective of this<br />
approach is to adjust the parameters of a statistical model<br />
using the correlati<strong>on</strong> between historical values of NDVI<br />
and historical data of cultivated area for each cereal<br />
speculati<strong>on</strong> to obtain a predicti<strong>on</strong> model described by<br />
the following equati<strong>on</strong>:<br />
In this secti<strong>on</strong> we present the results obtained for cereal<br />
area estimati<strong>on</strong> of Wheat and Barley, using three different<br />
approaches described in the methodology. The produced<br />
area estimates are evaluated by comparing the results<br />
obtained with the statistics results of the ministry of<br />
agriculture.<br />
Approach 1<br />
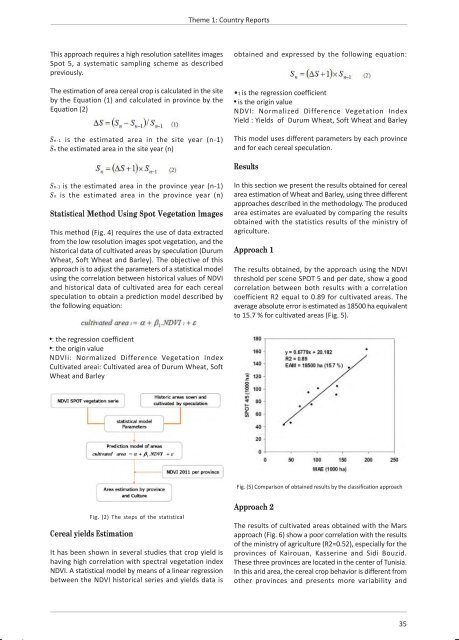
The results obtained, by the approach using the NDVI<br />
threshold per scene SPOT 5 and per date, show a good<br />
correlati<strong>on</strong> between both results with a correlati<strong>on</strong><br />
coefficient R2 equal to 0.89 for cultivated areas. The<br />
average absolute error is estimated as 18500 ha equivalent<br />
to 15.7 % for cultivated areas (Fig. 5).<br />
•: the regressi<strong>on</strong> coefficient<br />
•: the origin value<br />
NDVIi: Normalized Difference Vegetati<strong>on</strong> Index<br />
Cultivated areai: Cultivated area of Durum Wheat, Soft<br />
Wheat and Barley<br />
Fig. (5) Comparis<strong>on</strong> of obtained results by the classificati<strong>on</strong> approach<br />
Fig. (2) The steps of the statistical<br />
Cereal yields Estimati<strong>on</strong><br />
It has been shown in several studies that crop yield is<br />
having high correlati<strong>on</strong> with spectral vegetati<strong>on</strong> index<br />
NDVI. A statistical model by means of a linear regressi<strong>on</strong><br />
between the NDVI historical series and yields data is<br />
Approach 2<br />
The results of cultivated areas obtained with the Mars<br />
approach (Fig. 6) show a poor correlati<strong>on</strong> with the results<br />
of the ministry of agriculture (R2=0.52), especially for the<br />
provinces of Kairouan, Kasserine and Sidi Bouzid.<br />
These three provinces are located in the center of Tunisia.<br />
In this arid area, the cereal crop behavior is different from<br />
other provinces and presents more variability and<br />
35