Karnataka - Ministry of Environment and Forests
Karnataka - Ministry of Environment and Forests
Karnataka - Ministry of Environment and Forests

You also want an ePaper? Increase the reach of your titles
YUMPU automatically turns print PDFs into web optimized ePapers that Google loves.
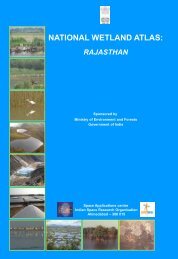
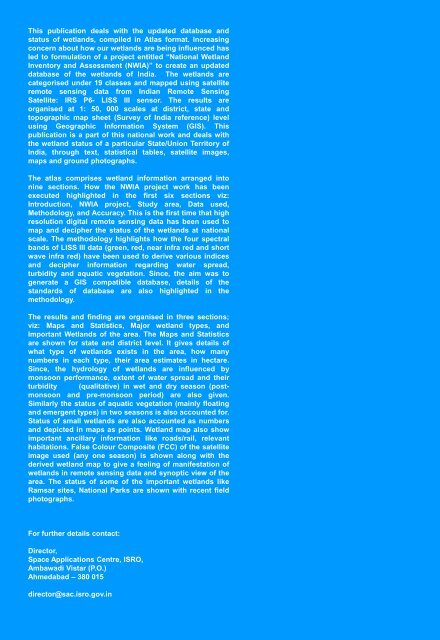
This publication deals with the updated database <strong>and</strong><br />
status <strong>of</strong> wetl<strong>and</strong>s, compiled in Atlas format. Increasing<br />
concern about how our wetl<strong>and</strong>s are being influenced has<br />
led to formulation <strong>of</strong> a project entitled “National Wetl<strong>and</strong><br />
Inventory <strong>and</strong> Assessment (NWIA)” to create an updated<br />
database <strong>of</strong> the wetl<strong>and</strong>s <strong>of</strong> India. The wetl<strong>and</strong>s are<br />
categorised under 19 classes <strong>and</strong> mapped using satellite<br />
remote sensing data from Indian Remote Sensing<br />
Satellite: IRS P6- LISS III sensor. The results are<br />
organised at 1: 50, 000 scales at district, state <strong>and</strong><br />
topographic map sheet (Survey <strong>of</strong> India reference) level<br />
using Geographic Information System (GIS). This<br />
publication is a part <strong>of</strong> this national work <strong>and</strong> deals with<br />
the wetl<strong>and</strong> status <strong>of</strong> a particular State/Union Territory <strong>of</strong><br />
India, through text, statistical tables, satellite images,<br />
maps <strong>and</strong> ground photographs.<br />
The atlas comprises wetl<strong>and</strong> information arranged into<br />
nine sections. How the NWIA project work has been<br />
executed highlighted in the first six sections viz:<br />
Introduction, NWIA project, Study area, Data used,<br />
Methodology, <strong>and</strong> Accuracy. This is the first time that high<br />
resolution digital remote sensing data has been used to<br />
map <strong>and</strong> decipher the status <strong>of</strong> the wetl<strong>and</strong>s at national<br />
scale. The methodology highlights how the four spectral<br />
b<strong>and</strong>s <strong>of</strong> LISS III data (green, red, near infra red <strong>and</strong> short<br />
wave infra red) have been used to derive various indices<br />
<strong>and</strong> decipher information regarding water spread,<br />
turbidity <strong>and</strong> aquatic vegetation. Since, the aim was to<br />
generate a GIS compatible database, details <strong>of</strong> the<br />
st<strong>and</strong>ards <strong>of</strong> database are also highlighted in the<br />
methodology.<br />
The results <strong>and</strong> finding are organised in three sections;<br />
viz: Maps <strong>and</strong> Statistics, Major wetl<strong>and</strong> types, <strong>and</strong><br />
Important Wetl<strong>and</strong>s <strong>of</strong> the area. The Maps <strong>and</strong> Statistics<br />
are shown for state <strong>and</strong> district level. It gives details <strong>of</strong><br />
what type <strong>of</strong> wetl<strong>and</strong>s exists in the area, how many<br />
numbers in each type, their area estimates in hectare.<br />
Since, the hydrology <strong>of</strong> wetl<strong>and</strong>s are influenced by<br />
monsoon performance, extent <strong>of</strong> water spread <strong>and</strong> their<br />
turbidity (qualitative) in wet <strong>and</strong> dry season (postmonsoon<br />
<strong>and</strong> pre-monsoon period) are also given.<br />
Similarly the status <strong>of</strong> aquatic vegetation (mainly floating<br />
<strong>and</strong> emergent types) in two seasons is also accounted for.<br />
Status <strong>of</strong> small wetl<strong>and</strong>s are also accounted as numbers<br />
<strong>and</strong> depicted in maps as points. Wetl<strong>and</strong> map also show<br />
important ancillary information like roads/rail, relevant<br />
habitations. False Colour Composite (FCC) <strong>of</strong> the satellite<br />
image used (any one season) is shown along with the<br />
derived wetl<strong>and</strong> map to give a feeling <strong>of</strong> manifestation <strong>of</strong><br />
wetl<strong>and</strong>s in remote sensing data <strong>and</strong> synoptic view <strong>of</strong> the<br />
area. The status <strong>of</strong> some <strong>of</strong> the important wetl<strong>and</strong>s like<br />
Ramsar sites, National Parks are shown with recent field<br />
photographs.<br />
For further details contact:<br />
Director,<br />
Space Applications Centre, ISRO,<br />
Ambawadi Vistar (P.O.)<br />
Ahmedabad – 380 015<br />
director@sac.isro.gov.in