Karnataka - Ministry of Environment and Forests
Karnataka - Ministry of Environment and Forests
Karnataka - Ministry of Environment and Forests

You also want an ePaper? Increase the reach of your titles
YUMPU automatically turns print PDFs into web optimized ePapers that Google loves.
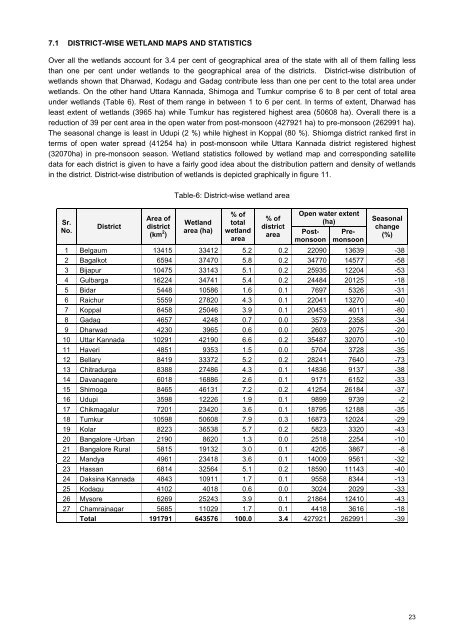
7.1 DISTRICT-WISE WETLAND MAPS AND STATISTICS<br />
Over all the wetl<strong>and</strong>s account for 3.4 per cent <strong>of</strong> geographical area <strong>of</strong> the state with all <strong>of</strong> them falling less<br />
than one per cent under wetl<strong>and</strong>s to the geographical area <strong>of</strong> the districts. District-wise distribution <strong>of</strong><br />
wetl<strong>and</strong>s shown that Dharwad, Kodagu <strong>and</strong> Gadag contribute less than one per cent to the total area under<br />
wetl<strong>and</strong>s. On the other h<strong>and</strong> Uttara Kannada, Shimoga <strong>and</strong> Tumkur comprise 6 to 8 per cent <strong>of</strong> total area<br />
under wetl<strong>and</strong>s (Table 6). Rest <strong>of</strong> them range in between 1 to 6 per cent. In terms <strong>of</strong> extent, Dharwad has<br />
least extent <strong>of</strong> wetl<strong>and</strong>s (3965 ha) while Tumkur has registered highest area (50608 ha). Overall there is a<br />
reduction <strong>of</strong> 39 per cent area in the open water from post-monsoon (427921 ha) to pre-monsoon (262991 ha).<br />
The seasonal change is least in Udupi (2 %) while highest in Koppal (80 %). Shiomga district ranked first in<br />
terms <strong>of</strong> open water spread (41254 ha) in post-monsoon while Uttara Kannada district registered highest<br />
(32070ha) in pre-monsoon season. Wetl<strong>and</strong> statistics followed by wetl<strong>and</strong> map <strong>and</strong> corresponding satellite<br />
data for each district is given to have a fairly good idea about the distribution pattern <strong>and</strong> density <strong>of</strong> wetl<strong>and</strong>s<br />
in the district. District-wise distribution <strong>of</strong> wetl<strong>and</strong>s is depicted graphically in figure 11.<br />
Table-6: District-wise wetl<strong>and</strong> area<br />
Sr.<br />
No.<br />
District<br />
Area <strong>of</strong><br />
district<br />
(km 2 )<br />
Wetl<strong>and</strong><br />
area (ha)<br />
% <strong>of</strong><br />
total<br />
wetl<strong>and</strong><br />
area<br />
% <strong>of</strong><br />
district<br />
area<br />
Open water extent<br />
(ha)<br />
Postmonsoon<br />
Premonsoon<br />
Seasonal<br />
change<br />
(%)<br />
1 Belgaum 13415 33412 5.2 0.2 22090 13639 -38<br />
2 Bagalkot 6594 37470 5.8 0.2 34770 14577 -58<br />
3 Bijapur 10475 33143 5.1 0.2 25935 12204 -53<br />
4 Gulbarga 16224 34741 5.4 0.2 24484 20125 -18<br />
5 Bidar 5448 10586 1.6 0.1 7697 5326 -31<br />
6 Raichur 5559 27820 4.3 0.1 22041 13270 -40<br />
7 Koppal 8458 25046 3.9 0.1 20453 4011 -80<br />
8 Gadag 4657 4248 0.7 0.0 3579 2358 -34<br />
9 Dharwad 4230 3965 0.6 0.0 2603 2075 -20<br />
10 Uttar Kannada 10291 42190 6.6 0.2 35487 32070 -10<br />
11 Haveri 4851 9353 1.5 0.0 5704 3728 -35<br />
12 Bellary 8419 33372 5.2 0.2 28241 7640 -73<br />
13 Chitradurga 8388 27486 4.3 0.1 14836 9137 -38<br />
14 Davanagere 6018 16886 2.6 0.1 9171 6152 -33<br />
15 Shimoga 8465 46131 7.2 0.2 41254 26184 -37<br />
16 Udupi 3598 12226 1.9 0.1 9899 9739 -2<br />
17 Chikmagalur 7201 23420 3.6 0.1 18795 12188 -35<br />
18 Tumkur 10598 50608 7.9 0.3 16873 12024 -29<br />
19 Kolar 8223 36538 5.7 0.2 5823 3320 -43<br />
20 Bangalore -Urban 2190 8620 1.3 0.0 2518 2254 -10<br />
21 Bangalore Rural 5815 19132 3.0 0.1 4205 3867 -8<br />
22 M<strong>and</strong>ya 4961 23418 3.6 0.1 14009 9561 -32<br />
23 Hassan 6814 32564 5.1 0.2 18590 11143 -40<br />
24 Daksina Kannada 4843 10911 1.7 0.1 9558 8344 -13<br />
25 Kodagu 4102 4018 0.6 0.0 3024 2029 -33<br />
26 Mysore 6269 25243 3.9 0.1 21864 12410 -43<br />
27 Chamrajnagar 5685 11029 1.7 0.1 4418 3616 -18<br />
Total 191791 643576 100.0 3.4 427921 262991 -39<br />
23