
Create successful ePaper yourself
Turn your PDF publications into a flip-book with our unique Google optimized e-Paper software.
KEY CONCEPT<br />
Physical<br />
Chemistry<br />
Fundamentals<br />
GASEOUS STATE<br />
& REAL GASES<br />
Real Gases :<br />
Deviation from Ideal Behaviour :<br />
Real gases do not obey the ideal gas laws exactly<br />
under all conditions of temperature and pressure.<br />
Experiments show that at low pressures and<br />
moderately high temperatures, gases obey the laws of<br />
Boyle, Charles and Avogadro approximately, but as<br />
the pressure is increased or the temperature is<br />
decreased, a marked departure from ideal behaviour<br />
is observed.<br />
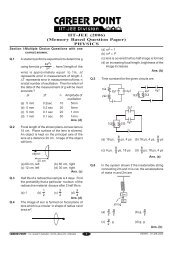
Ideal gas<br />
p<br />
V<br />
Plot of p versus V of hydrogen, as<br />
compared to that of an ideal gas<br />
The curve for the real gas has a tendency to coincide<br />
with that of an ideal gas at low pressures when the<br />
volume is large. At higher pressures, however,<br />
deviations are observed.<br />
Compressibility Factor :<br />
The deviations can be displayed more clearly, by<br />
plotting the ratio of the observed molar volume V m to<br />
the ideal molar volume V m,ideal (= RT/p) as a function<br />
of pressure at constant temperature. This ratio is<br />
called the compressibility factor Z and can be<br />
expressed as<br />
Z =<br />
V<br />
V<br />
m<br />
m,ideal<br />
p<br />
= RT<br />
Vm<br />
Plots of Compressibility Factor versus Pressure :<br />
For an ideal gas Z = 1 and is independent of pressure<br />
and temperature. For a real gas, Z = f(T, p), a<br />
function of both temperature and pressure.<br />
A graph between Z and p for some gases at 273.15 K,<br />
the pressure range in this graph is very large. It can<br />
be noted that:<br />
(1) Z is always greater than 1 for H 2 .<br />
(2) For N 2 , Z < 1 in the lower pressure range and is<br />
greater than 1 at higher pressures. It decreases with<br />
increase of pressure in the lower pressure region,<br />
passes through a minimum at some pressure and then<br />
H 2<br />
increases continuously with pressure in the higher<br />
pressure region.<br />
(3) For CO 2 , there is a large dip in the beginning. In<br />
fact, for gases which are easily liquefied, Z dips<br />
sharply below the ideal line in the low pressure<br />
region.<br />
1.0<br />
t = 0ºC<br />
H 2<br />
N 2<br />
CH 4<br />
ideal gas<br />
CO 2<br />
Z<br />
0 100 200 300<br />
p/101.325 bar<br />
Plots of Z versus p of a few gases<br />
This graph gives an impression that the nature of the<br />
deviations depend upon the nature of the gas. In fact,<br />
it is not so. The determining factor is the temperature<br />
relative to the critical temperature of the particular<br />
gas; near the critical temperature, the pV curves are<br />
like those for CO 2 , but when far away, the curves are<br />
like those for H 2 (below fig.)<br />
Z<br />
1.0<br />
T 1 >T 2 >T 3 >T 4<br />
ideal gas<br />
0 200 400 600<br />
p/101.325 kPa<br />
T 4<br />
T 3<br />
T 2<br />
Plots of Z versus p of a single gas<br />
at various temperatures<br />
Provided the pressure is of the order of 1 bar or less,<br />
and the temperature is not too near the point of<br />
liquefaction, the observed deviations from the ideal<br />
gas laws are not more than a few percent. Under<br />
these conditions, therefore, the equation pV = nRT<br />
and related expressions may be used.<br />
Van der Waals Equation of state for a Real gas<br />
Causes of Deviations from Ideal Behaviour :<br />
The ideal gas laws can be derived from the kinetic<br />
theory of gases which is based on the following two<br />
important assumptions:<br />
T 1<br />
XtraEdge for <strong>IIT</strong>-<strong>JEE</strong> 33 MAY 2010