REPORT 2010 - Telethon Speech and Hearing
REPORT 2010 - Telethon Speech and Hearing
REPORT 2010 - Telethon Speech and Hearing

You also want an ePaper? Increase the reach of your titles
YUMPU automatically turns print PDFs into web optimized ePapers that Google loves.
<strong>Telethon</strong> <strong>Speech</strong> + <strong>Hearing</strong> <strong>2010</strong> Annual Report<br />
There was a high level of agreement with the majority of<br />
the statements in the survey, which is extremely positive.<br />
In addition, this is the first year that every mean score for<br />
every item in every program has been 4-5.<br />
Responses from Chatterbox <strong>and</strong> School Support<br />
parents were similar to the high levels achieved in 2009,<br />
but there is a noticeable improvement in the rates from<br />
parents in the Talkabout program.<br />
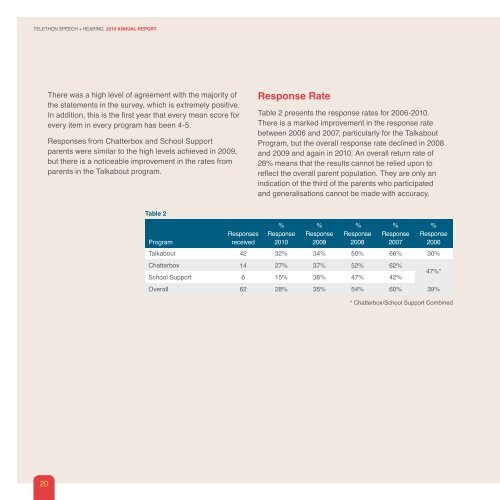
Response Rate<br />
Table 2 presents the response rates for 2006-<strong>2010</strong>.<br />
There is a marked improvement in the response rate<br />
between 2006 <strong>and</strong> 2007, particularly for the Talkabout<br />
Program, but the overall response rate declined in 2008<br />
<strong>and</strong> 2009 <strong>and</strong> again in <strong>2010</strong>. An overall return rate of<br />
28% means that the results cannot be relied upon to<br />
reflect the overall parent population. They are only an<br />
indication of the third of the parents who participated<br />
<strong>and</strong> generalisations cannot be made with accuracy.<br />
Table 2<br />
Program<br />
Responses<br />
received<br />
%<br />
Response<br />
<strong>2010</strong><br />
%<br />
Response<br />
2009<br />
%<br />
Response<br />
2008<br />
%<br />
Response<br />
2007<br />
%<br />
Response<br />
2006<br />
Talkabout 42 32% 34% 50% 66% 30%<br />
Chatterbox 14 27% 37% 52% 62%<br />
School Support 6 15% 38% 47% 42%<br />
Overall 62 28% 35% 54% 60% 39%<br />
47%*<br />
* Chatterbox/School Support Combined<br />
20