analysis of united states imports - California Wine Export Program
analysis of united states imports - California Wine Export Program
analysis of united states imports - California Wine Export Program

You also want an ePaper? Increase the reach of your titles
YUMPU automatically turns print PDFs into web optimized ePapers that Google loves.
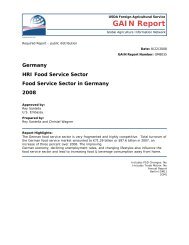
ANALYSIS OF GLOBAL WINE IMPORTS<br />
AND<br />
WINE IMPORTS IN SELECTED COUNTRIES<br />
2007<br />
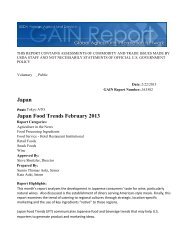
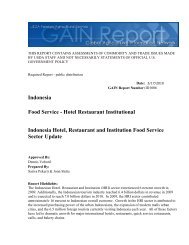
COMPARISON OF US IMPORT PRICES<br />
AND<br />
AVERAGE OF ALL IMPORT PRICES<br />
IN SELECTED COUNTRIES<br />
Belgium<br />
Canada<br />
China<br />
Denmark<br />
Finland<br />
France<br />
Germany<br />
Ireland<br />
Italy<br />
Japan<br />
Mexico<br />
Price <strong>of</strong> US Imports<br />
Price <strong>of</strong> All Imports<br />
Netherlands<br />
Norway<br />
Poland<br />
Russia<br />
South Korea<br />
Sweden<br />
Switzerland<br />
Taiwan<br />
United Kingdom<br />
0.00 1.00 2.00 3.00 4.00 5.00 6.00 7.00<br />
PRICE/LITER $<br />
CALIFORNIA WINE EXPORT PROGRAM<br />
425 Market Street, Suite 1000, San Francisco, CA 94105<br />
Tel: 415-512-0151 Fax: 415-512-8416<br />
Home Page: calwinexport.com
TABLE OF CONTENTS<br />
ANALYSIS OF GLOBAL WINE IMPORTS<br />
AND<br />
WINE IMPORTS IN SELECTED COUNTRIES<br />
2007 (1)<br />
TABLE<br />
PAGE<br />
i I. Preface<br />
Commentary<br />
ii I. Global <strong>Wine</strong> Imports<br />
iii II. <strong>Wine</strong> Imports In Twenty-Two Selected Countries<br />
vi III. US <strong>Wine</strong> Imports – 2006 & 2007<br />
1 1 United Kingdom <strong>Wine</strong> Imports<br />
2 2 Canada <strong>Wine</strong> Imports<br />
3 3 Japan <strong>Wine</strong> Imports<br />
4 4 Germany <strong>Wine</strong> Imports<br />
5 5 Italy <strong>Wine</strong> Imports<br />
6 6 Netherlands <strong>Wine</strong> Imports<br />
7 7 Switzerland <strong>Wine</strong> Imports<br />
8 8 France <strong>Wine</strong> Imports<br />
9 9 Mexico <strong>Wine</strong> Imports<br />
10 10 Denmark <strong>Wine</strong> Imports<br />
11 11 South Korea<br />
12 12 Sweden <strong>Wine</strong> Imports<br />
13 13 China <strong>Wine</strong> Imports<br />
14 14 Ireland <strong>Wine</strong> Imports<br />
15 15 Hong Kong <strong>Wine</strong> Imports<br />
16 16 Taiwan <strong>Wine</strong> Imports<br />
17 17 Singapore <strong>Wine</strong> Imports<br />
18 18 Finland <strong>Wine</strong> Imports<br />
19 19 Russia <strong>Wine</strong> Imports<br />
20 20 Norway <strong>Wine</strong> Imports<br />
21 21 Belgium <strong>Wine</strong> Imports<br />
22 22 Poland <strong>Wine</strong> Imports<br />
Appendix 1 United States <strong>Wine</strong> Imports 2006 & 2007<br />
Appendix 2 Global <strong>Wine</strong> Consumption 2006 & 2007<br />
(1)<br />
Copyright © 2008, Trade Data & Analysis, 1100 Arroyo Dr., Pebble Beach, CA 93953. World rights reserved. No<br />
part <strong>of</strong> this publication may be stored in a retrieval system, transmitted or reproduced in any way, including but not<br />
limited to photocopy, photograph, magnetic or other record, without the prior written agreement <strong>of</strong> Trade Data &<br />
Analysis. Vol. II No.1 dated May 6, 2008. Every effort is made to verify the accuracy <strong>of</strong> the report data. The user<br />
assumes responsibility for reliance upon the figures appearing in this report. Information from users who become<br />
aware <strong>of</strong> errors or who have suggestions relating to improvements <strong>of</strong> this report is welcomed.
PREFACE<br />
This report includes commentary and data related to global wine <strong>imports</strong> and the market<br />
position <strong>of</strong> wine <strong>imports</strong> from supplier countries in twenty-two (22) foreign countries. 1<br />
The twenty-two countries included in the <strong>analysis</strong> are those that have been targeted for<br />
marketing emphasis in by the <strong>California</strong> <strong>Wine</strong> <strong>Export</strong> <strong>Program</strong>. For comparison, the<br />
report includes a summary <strong>of</strong> US wine <strong>imports</strong> in the same format that is used for the<br />
targeted countries. 2<br />
The tables include data for 2006 and 2007 relating to the value, volume and value per<br />
liter for wine <strong>imports</strong> in each <strong>of</strong> the selected countries. The table for each country lists its<br />
major wine suppliers ranked for the largest to the smallest supplier. Import quantities<br />
from other countries are combined and then added to major supplier quantities to<br />
calculate total imported wine for the individual country. Total wine <strong>imports</strong> are then<br />
deducted from total wine consumption in a specific country to determine wine<br />
consumption derived from domestically produced wine. Total wine consumption is<br />
defined as the total market in this report.<br />
Each <strong>of</strong> the tables also provides a comparison <strong>of</strong> the aggregate prices <strong>of</strong> the <strong>imports</strong> from<br />
the major suppliers as well as the aggregate price for all <strong>imports</strong>. The data for each<br />
country indicates the percentage changes from 2006 to 2007 in each category <strong>of</strong> the<br />
provided data.<br />
The data included in this report represents the combined total <strong>of</strong> products included in<br />
Harmonized Tariff Schedule (HTS) categories 2204, 2005 and 2206. In this regard it<br />
should be noted that the products included in the HTS tariff codes are not the same for<br />
each country.<br />
Appendix 2 lists the estimated wine consumption (wine market) in 2006 and 2007 in each<br />
<strong>of</strong> the targeted countries. This data is an update <strong>of</strong> global wine consumption summarized<br />
in the Trade Data & Analysis “World <strong>Wine</strong> Report – 2007. 3<br />
The data and commentary are based on trade reports provided by the Global Trade<br />
Information Services (GTIS) and reports prepared by Trade Data & Analysis (TDA).<br />
There are obvious errors in reporting <strong>of</strong> value and volume <strong>of</strong> <strong>imports</strong> by Hong Kong and<br />
Singapore. These errors are being reviewed by GTIS and the importing countries.<br />
Corrections will be made future editions <strong>of</strong> this report.<br />
1 The listed countries included in this report are United Kingdom, Canada, Japan, Germany, Italy,<br />
Netherlands, Switzerland, France, Mexico, Denmark, South Korea, Sweden, China, Ireland, Hong Kong,<br />
Taiwan, Singapore, Finland, Russia, Norway, Belgium, and Poland.<br />
2 See Appendix 1.<br />
3 See Table 5.2 World <strong>Wine</strong> Consumption 2002-2006, “World <strong>Wine</strong> Report – 2007”, Trade Data &<br />
Analysis (TDA), December 31, 2007 pages 37-41 and TDA update for April 17, 2008.<br />
i
COMMENTARY<br />
I. GLOBAL WINE IMPORTS:<br />
Global wine <strong>imports</strong> in 2006 were 8.56 billion liters (951 million 9-liter cases) and are<br />
estimated to have increased to 9.00 billion liters in 2007, equal to a 1.0 billion 9-liter<br />
cases. 4<br />
The following table compares global <strong>imports</strong> with global wine consumption in 2002,<br />
2006 and 2007: 5 GLOBAL WINE CONSUMPTION AND IMPORTS<br />
2002, 2006, 2007 AND % CHANGE<br />
(LITERS 000000)<br />
% CHANGE<br />
2002 2006 2007 6 2007/2002 2007/2006<br />
Global <strong>Wine</strong> Consumption 226,179 241,553 245,600 8.6% 1.7%<br />
Global <strong>Wine</strong> Imports 69,954 85,636 90,000 28.7% 5.1%<br />
Import % <strong>of</strong> Consumption 30.9 34.7 35.4 14.6% 2.0%<br />
The preceding table indicates that wine <strong>imports</strong> are gaining an increasing percentage <strong>of</strong><br />
global wine consumption. This is the result <strong>of</strong> an increased level <strong>of</strong> wine consumption in<br />
non-wine producing countries and a decline in wine consumption in wine producing<br />
countries during the period 2002-2007.<br />
Growth <strong>of</strong> wine <strong>imports</strong>, during the period 2002-2007 has been the most significant in<br />
China (+272%); Russia (+75%); Italy (+39%); Czech Republic (+40%); United States<br />
(+34%); Canada (+24%); France (+15%); United Kingdom (+14%) and Germany (+9%).<br />
During 2002-2007 wine <strong>imports</strong> decreases were reported in several significant wine<br />
markets including Japan (-11%); Denmark (-8%); Portugal (-30%) and South Africa (-<br />
73%).<br />
4 Source: World Vineyard, Grape and <strong>Wine</strong> Report, Table 8.1, December 2007.<br />
5 Source: World Vineyard, Grape and <strong>Wine</strong> Report, Table 5.2, December 2007.<br />
6 Estimated<br />
ii
II. WINE IMPORTS IN TWENTY-TWO (22) SELECTED COUNTRIES:<br />
The 22 countries analyzed in this section <strong>of</strong> this report are those that have been<br />
emphasized for market promotion by the <strong>California</strong> <strong>Wine</strong> <strong>Export</strong> <strong>Program</strong>. 7<br />
Tables 1-22 summarize the wine import situation in each <strong>of</strong> the selected countries. Each<br />
table indicates the value, volume and value per liter <strong>of</strong> <strong>imports</strong> for 2006 and 2007 and<br />
compares the changes between the two years. The twenty-two leading import suppliers<br />
are listed for each country. The supplying countries are ranked according to the value <strong>of</strong><br />
their <strong>imports</strong> in the destination country in 2007.<br />
Each table indicates the share (%) <strong>of</strong> the value and the volume <strong>of</strong> the import market<br />
which each supplier country represents. The tables also indicate the share (%) <strong>of</strong> the<br />
volume that each country represents in the total market. The total market <strong>analysis</strong><br />
assumes that consumption is a total <strong>of</strong> <strong>imports</strong> and locally produced wine. Unfortunately,<br />
reliable data is not available on the value <strong>of</strong> the total market in any <strong>of</strong> the countries.<br />
The United Kingdom has been the largest market for US wine exports for several<br />
decades. Logistics related to US exports to the UK have changed significantly in recent<br />
years. Increased quantities <strong>of</strong> US wine are now being shipped bulk to Italy and France<br />
for processing and bottled prior to shipment to the UK. The following table summarizes<br />
the volume <strong>of</strong> US bulk table wine exports to Italy and France in 2006 and 2007:<br />
US BULK TABLE WINE EXPORTS TO FRANCE & ITALY<br />
2006 & 2007<br />
(LITERS 000)<br />
YEAR ITALY FRANCE ITALY & FRANCE<br />
2006 53,712 1,109 54,821<br />
2007 52,558 3,538 56,096<br />
In the <strong>analysis</strong> <strong>of</strong> the UK market in 2006 and 2007, bulk table wine exports to France and<br />
Italy have been added to “direct” UK <strong>imports</strong> from the US. Concurrently, wine <strong>imports</strong><br />
by the UK from Italy and France have been decreased by the same quantities that UK<br />
<strong>imports</strong> from the US have been increased.<br />
After the foregoing adjustments, US <strong>imports</strong> by the UK ranked fourth in value and the<br />
third in volume in the UK import market. In 2007, US <strong>imports</strong> represented 11.3% <strong>of</strong><br />
the UK wine market, an increase <strong>of</strong> 6.2% compared with 2006. The value per liter <strong>of</strong> all<br />
UK wine <strong>imports</strong> was $4.13 in 2007 compared with US <strong>imports</strong> at $2.63 per liter. Prices<br />
for UK wine <strong>imports</strong> from the US in 2007 declined by 3.3% compared with 2006. France<br />
7 The listed countries included in this report are United Kingdom, Canada, Japan, Germany, Italy,<br />
Netherlands, Switzerland, France, Mexico, Denmark, South Korea, Sweden, China, Ireland, Hong Kong,<br />
Taiwan, Singapore, Finland, Russia, Norway, Belgium, and Poland.<br />
iii
enjoyed a 19.5% market share in the value <strong>of</strong> UK <strong>imports</strong> followed by Australia at<br />
16.4%.<br />
In 2007, Canadian consumption <strong>of</strong> domestic wine was 25.6% <strong>of</strong> the total market. In<br />
2007, US wine <strong>imports</strong> by Canada represented 14.1% <strong>of</strong> the import market and 10.5%%<br />
<strong>of</strong> the total market.<br />
The US market position and market share in 2007 for each <strong>of</strong> the selected twenty-two<br />
(22) countries is summarized in the following table:<br />
POSITION & MARKET SHARE OF US IMPORTS<br />
IN SELECTED COUNTRIES<br />
2007<br />
US MARKET POSITION US MARKET SHARE (%)<br />
IMPORT TOTAL<br />
COUNTRY VALUE VOLUME MARKET MARKET<br />
United Kingdom 4 4 11.3 11.3<br />
Canada 4 4 14.1 10.5<br />
Japan 3 4 9.5 8.7<br />
Germany 6 6 2.8 2.1<br />
Italy 2 1 34.6 2.4<br />
Netherlands 9 9 3.4 3.3<br />
Switzerland 5 5 3.7 2.7<br />
France 7 7 1.8 0.3<br />
Mexico 4 3 23.6 7.1<br />
Denmark 11 11 3.6 3.6<br />
South Korea 4 4 14.1 13.6<br />
Sweden 11 11 1.1 1.0<br />
China 6 6 3.6 0.3<br />
Ireland 9 9 3.4 3.3<br />
Hong Kong 4 4 13.7 13.5<br />
Taiwan 3 4 9.5 7.5<br />
Singapore 5 4 2.1 2.1<br />
Finland 12 12 2.3 2.3<br />
Russia 14 16 0.3 0.1<br />
Norway 13 13 2.1 2.1<br />
Belgium 13 15 0.4 0.3<br />
Poland 13 13 0.7 0.5<br />
iv
Price comparison and <strong>analysis</strong> is difficult in the import wine sector because <strong>of</strong> product<br />
mix differences and the relative importance <strong>of</strong> bulk <strong>imports</strong> in different countries. The<br />
following table summarizes prices <strong>of</strong> wine <strong>imports</strong> from the major wine producing<br />
countries to each <strong>of</strong> the selected countries. Prices range from a high <strong>of</strong> $27.31 per liter<br />
for Singapore <strong>imports</strong> from France to a low <strong>of</strong> $.62 per liter for Russian <strong>imports</strong> from<br />
Argentina.<br />
The number in parenthesis following the aggregate price per liter indicates the market<br />
position <strong>of</strong> the exporting country in each <strong>of</strong> the 22 listed countries. France enjoys first<br />
market position in seventeen <strong>of</strong> the listed countries and second in market position in four<br />
<strong>of</strong> the listed countries. Italian <strong>imports</strong> have the leading market position in four <strong>of</strong> the<br />
listed countries and are second in six <strong>of</strong> the listed countries.<br />
SUMMARY OF WINE PRICES PER LITER<br />
AND MARKET POSITION IN THE IMPORT MARKET<br />
FOR SELECTED COUNTRIES 8<br />
AVERAGE WINE PRICES PER LITER FOR IMPORTS FROM MAJOR WINE PRODUCING COUNTRIES 2007 ($)<br />
COUNTRY FRANCE ITALY AUSTRALIA<br />
UNITED<br />
STATES SPAIN CHILE ARGENTINA<br />
SOUTH<br />
AFRICA<br />
United Kingdom 6.78(1) 3.77(3) 4.09 (2) 2.63 (4) 3.42 (5) 3.43(6) 2.75(13) 3.25 (7)<br />
Canada 6.27(1) 5.04(2) 5.54 (3) 4.61 (4) 3.16 (6) 2.63(5) 2.31 (7) 3.05 (4)<br />
Japan 12.55(1) 5.21(2) 4.70 (6) 3.57 (3) 3.95 (4) 2.4(5) 1.63(9) 3.22(12)<br />
Germany 3.26(1) 1.54(1) 1.62 (7) 1.66 (6) 1.63 (3) 1.31(5) 1.93(16) 1.56 (4)<br />
Italy 8.79(1) - 1.72(12) 1.09 (2) .90 (3) 1.80(8) 1.37(10) 1.40(14)<br />
Netherlands 3.84(1) 3.04(3) 3.2 8 (7) 2.69 (9) 2.59 (4) 2.68(5) 2.57(10) 2.21 (6)<br />
Switzerland 7.23(1) 4.74(2) 4.59 (7) 4.46 (5) 3.92 (3) 3.07(9) 2.91(12) 2.20(11)<br />
France - 1.17(1) 1.48 (9) 3.03 (7) .58 (3) 1.20(8) 3.00(13) 1.43(10)<br />
Mexico 10.65(3) 4.01(5) 4.86 (9) 2.15 (4) 4.91 (1) 2.13(2) 2.31 (6) 3.88(11)<br />
Denmark 5.64(1) 5.32(2) 2.34 (5) 2.52(11) 3.18 (3) 2.12(4) 2.64 (9) 2.59 (7)<br />
South Korea 8.12(1) 5.97(3) 4.64 (5) 3.53 (4) 1.40 (6) 3.98(2) 3.43 (9) 2.66(10)<br />
Sweden 6.11(1) 3.82(2) 4.42 (6) 5.69(11) 2.63 (4) 3.22(8) 3.05(12) 2.86 (5)<br />
China 4.69(1) 2.68(4) 2.24 (3) 2.03 (6) 1.31 (5) .63(2) 1.31 (8) 2.03 (9)<br />
Ireland 6.93(2) 5.01(6) 4.68 (3) 3.40 (9) 5.37 (5) 3.94(4) 3.10(12) 3.88 (7)<br />
Hong Kong 15.97(1) 7.39(6) 5.12 (2) 2.47 (4) 2.35(11) 3.27(5) 3.10(13) 4.08(16)<br />
Taiwan 5.65(1) 4.97(6) 4.98 (2) 4.13 (3) 2.38 (7) 3.20(4) 3.70 (8) 4.48(10)<br />
Finland 4.12(1) 3.93(4) 3.55 (6) 3.40(12) 3.40 (3) 2.89(2) 2.32(10) 2.68 (9)<br />
Russia 2.09(2) 4.00(1) 2.44 (3) 2.30(14) .70 (3) 1.56(6) .62 (5) 2.18(12)<br />
Norway 5.65(1) 5.21(2) 3.72 (5) 2.27(13) 4.37 (3) 2.66(7) 2.14(10) 3.06(11)<br />
Belgium 5.25(1) 2.95(3) 2.76(10) 2.88(13) 3.19 (2) 2.65(7) 3.03(12) 1.94 (9)<br />
Norway 3.88(2) 2.01(1) 3.29(13) 2.90(14) 2.00 (6) 2.88(7) 2.37(11) 3.03(12)<br />
8 Market position in the import market based on value.<br />
v
III. US WINE IMPORTS – 2006 & 2007:<br />
Appendix 1 is a summary <strong>of</strong> US wine <strong>imports</strong> for 2006 and 2007 in the same format used<br />
for <strong>analysis</strong> <strong>of</strong> the 22 target countries.<br />
In 2007 US <strong>imports</strong> represented 32.6% <strong>of</strong> the <strong>of</strong> the volume <strong>of</strong> the total US wine market.<br />
France, Italy and Australia represented 67.5% <strong>of</strong> the US imported wine sector.<br />
In 2007 significant increases in US import volume came from Argentina (+66.2%); Spain<br />
(+10.5%); Chile (+12.9%); New Zealand (+33.1%); Germany (+11.4%) and Portugal<br />
(+9.2%) while wine <strong>imports</strong> from Australia declined by 5.5%.<br />
The average price <strong>of</strong> US <strong>imports</strong> from the wine producing countries in 2007 was $5.41<br />
per liter ($48.69 per 9-liter case). Prices ranged from $11.31 per liter for French wines<br />
and $2.02 per liter for wines from Argentina.<br />
vi
COUNTRY WINE MARKET ANALYSIS - IMPORTS<br />
UN ITED KINGDOM<br />
2006, 2007 AND 2007/ 2006<br />
TABLE WINE, SPARKLING WINE DESSERT WINE, VERMOUTH AND OTHER SPECIAL NATURAL WINE<br />
VALUE ($US 000), VOLUME (LITERS 000) AND VALUE/LITER ($)<br />
HTS CODES 2204/2205/2206 COMBINED<br />
DOMESTIC WINE CONSUMPTION AND TOTAL WINE MARKET<br />
2006 2007 2007/2006 (% CHANGE)<br />
MARKET MARKET SHARE (%) (2) MARKET MARKET SHARE (%) (2)<br />
MARKET MARKET SHARE (%) (2)<br />
VALUE VOLUME VALUE/ IMPORT TOTAL VALUE VOLUME VALUE/ IMPORT TOTAL VALUE VOLUME VALUE/ IMPORT TOTAL<br />
COUNTRY (1) ($US 000) LITERS (000) LITER ($) MARKET MARKET ($US 000) LITERS (000) LITER ($) MARKET MARKET ($US 000) LITERS (000) LITER ($) MARKET MARKET<br />
France (3) 1,531,055 272,190 $ 5.62 20.6% 20.5% 1,824,815 269,204 $ 6.78 19.6% 19.5% 19.2% (1.1%) 20.5% (5.2%) (5.2%)<br />
Australia 788,602 209,522 $ 3.76 15.9% 15.8% 927,958 226,674 $ 4.09 16.5% 16.4% 17.7% 8.2% 8.8% 3.8% 3.7%<br />
Italy (3) 386,482 131,961 $ 2.93 10.0% 10.0% 412,442 109,416 $ 3.77<br />
7.9% 7.9% 6.7% (17.1%) 28.7% (20.5%) (20.5%)<br />
United States (3) 383,555 141,013 $ 2.72 10.7% 10.6% 410,608 156,125 $ 2.63 11.3% 11.3% 7.1% 10.7% (3.3%) 6.2% 6.2%<br />
Spain 292,438 100,090 $ 2.92 7.6% 7.6% 346,252 101,381 $ 3.42<br />
7.4% 7.3% 18.4% 1.3% 16.9% (2.9%) (2.9%)<br />
Chile 222,145 75,383 $ 2.95 5.7% 5.7% 340,821 99,424 $ 3.43<br />
7.2% 7.2% 53.4% 31.9% 16.3% 26.5% 26.5%<br />
South Africa 193,740 73,990 $ 2.62 5.6% 5.6% 246,051 75,689 $ 3.25<br />
5.5% 5.5% 27.0% 2.3% 24.1% (1.9%) (1.9%)<br />
New Zealand 145,344 21,212 $ 6.85 1.6% 1.6% 203,292 26,693 $ 7.62<br />
1.9% 1.9% 39.9% 25.8% 11.2% 20.7% 20.6%<br />
Germany 177,934 80,301 $ 2.22 6.1% 6.1% 190,682 73,218 $ 2.60<br />
5.3% 5.3% 7.2% (8.8%) 17.5% (12.6%) (12.6%)<br />
Ireland 100,523 36,661 $ 2.74 2.8% 2.8% 133,863 44,744 $ 2.99<br />
3.2% 3.2% 33.2% 22.0% 9.1% 17.0% 17.0%<br />
Portugal 83,501 16,024 $ 5.21 1.2% 1.2% 102,765 17,943 $ 5.73<br />
1.3% 1.3% 23.1% 12.0% 9.9% 7.4% 7.4%<br />
Belgium 51,861 23,379 $ 2.22 1.8% 1.8% 76,834 30,801 $ 2.49<br />
2.2% 2.2% 48.2% 31.7% 12.5% 26.3% 26.3%<br />
Argentina 48,328 18,909 $ 2.56 1.4% 1.4% 57,841 21,011 $ 2.75<br />
1.5% 1.5% 19.7% 11.1% 7.7% 6.6% 6.5%<br />
Switzerland 19,051 4,465 $ 4.27 0.3% 0.3% 32,683 8,715 $ 3.75<br />
0.6% 0.6% 71.6% 95.2% (12.1%) 87.2% 87.1%<br />
Netherlands 16,676 5,542 $ 3.01 0.4% 0.4% 26,552 8,903 $ 2.98<br />
0.6% 0.6% 59.2% 60.6% (0.9%) 54.1% 54.0%<br />
Sweden 9,520 4,823 $ 1.97 0.4% 0.4% 17,508 8,968 $ 1.95<br />
0.7% 0.6% 83.9% 85.9% (1.1%) 78.3% 78.3%<br />
Hungary 11,849 3,887 $ 3.05 0.3% 0.3% 9,821 4,132 $ 2.38<br />
0.3% 0.3% (17.1%) 6.3% (22.0%) 1.9% 1.9%<br />
Bulgaria 6,279 3,063 $ 2.05 0.2% 0.2% 5,853 3,482 $ 1.68<br />
0.3% 0.3% (6.8%) 13.7% (18.0%) 9.0% 9.0%<br />
Austria 3,569 393 $ 9.08 0.0% 0.0% 5,405 558 $ 9.69<br />
0.0% 0.0% 51.5% 42.0% 6.7% 36.2% 36.1%<br />
Greece 2,655 830 $ 3.20 0.1% 0.1% 3,284 962 $ 3.41<br />
0.1% 0.1% 23.7% 15.8% 6.8% 11.1% 11.1%<br />
LISTED COUNTRY IMPORTS 4,475,105 1,223,639 $ 3.66 92.7% 92.4% 5,375,329 1,288,044 $ 4.17 93.5% 93.2% 20.1% 5.3% 14.1% 0.9% 0.9%<br />
OTHER COUNTRY IMPORTS 304,703 96,901 $ 3.14 7.3% 7.3% 314,868 88,945 $ 3.54<br />
6.5% 6.4% 3.3% (8.2%) 12.6% (12.0%) (12.0%)<br />
TOTAL IMPORTS (4) 4,779,808 1,320,540 $ 3.62 100.0% 99.7% 5,690,197 1,376,989 $ 4.13 100.0% 99.6% 19.0% 4.3% 14.2% 0.0% (0.0%)<br />
DOMESTIC WINE 4,460 0.3% 5,011 0.4% 12.4% 7.7%<br />
TOTAL MARKET (5) 1,325,000 100.0% 1,382,000 100.0% 4.3% 0.0%<br />
(1) Ranked by Value in 2007<br />
(2) Based on volume. "0.0%"Indicates less than 0.1%.<br />
(3) In recent years, US bulk table wine exports to Italy and France have been processed and bottled in those countries and shipped to the UK. In this table, US bulk<br />
table wine exports to Italy and France have been added to "direct" UK <strong>imports</strong> from the US to determine total UK <strong>imports</strong> from the US. Concurrently, <strong>imports</strong> by the UK<br />
from Italy and France have been decreased by the same quantity that UK <strong>imports</strong> from the US have been increased.<br />
(4) Some imported wines may be transshipped to other countries in which case the import market and the total market may be overstated.<br />
(5) Total wine market estimated at 1.325 billion liters in 2006 and 1.382 billion liters in 2007.<br />
See Appendices 1 & 2<br />
Source: Global Trade Information Service. Copyright: Trade Data and Analysis<br />
Table 1<br />
Page 1
2006<br />
COUNTRY WINE MARKET ANALYSIS - IMPORTS<br />
CANADA<br />
2006, 2007 AND 2007/ 2006<br />
TABLE WINE, SPARKLING WINE DESSERT WINE, VERMOUTH AND OTHER SPECIAL NATURAL WINE<br />
VALUE ($US 000), VOLUME (LITERS 000) AND VALUE/LITER ($)<br />
HTS CODES 2204/2205/2206 COMBINED<br />
DOMESTIC WINE CONSUMPTION AND TOTAL WINE MARKET<br />
2007<br />
2007/2006 (% CHANGE)<br />
MARKET<br />
MARKET SHARE (%) (2)<br />
MARKET<br />
MARKET SHARE (%) (2) MARKET<br />
MARKET SHARE (%) (2)<br />
VALUE VOLUME VALUE/ IMPORT TOTAL VALUE VOLUME VALUE/ IMPORT TOTAL VALUE VOLUME VALUE/ IMPORT TOTAL<br />
COUNTRY (1) ($US 000) LITERS (000) LITER ($) MARKET MARKET ($US 000) LITERS (000) LITER ($) MARKET MARKET ($US 000) LITERS (000) LITER ($) MARKET MARKET<br />
France 336,002 63,729 $ 5.27<br />
20.1% 15.2% 376,153 59,955 $ 6.27 18.4% 13.7% 11.9% (5.9%) 19.0% (8.5%) (9.7%)<br />
Italy 247,210 54,965 $ 4.50<br />
17.4% 13.1% 293,463 58,206 $ 5.04 17.9% 13.3% 18.7% 5.9% 12.1% 3.0% 1.7%<br />
Australia 256,261 54,842 $ 4.67<br />
17.3% 13.1% 289,746 52,302 $ 5.54 16.1% 12.0% 13.1% (4.6%) 18.6% (7.2%) (8.4%)<br />
United States 171,705 42,689 $ 4.02<br />
13.5% 10.2% 211,486 45,858 $ 4.61 14.1% 10.5% 23.2% 7.4% 14.7% 4.5% 3.1%<br />
Chile 60,722 22,282 $ 2.73<br />
7.0% 5.3% 75,211 28,549 $ 2.63 8.8% 6.5% 23.9% 28.1% (3.3%) 24.6% 23.0%<br />
Spain 54,553 21,377 $ 2.55<br />
6.8% 5.1% 66,995 21,212 $ 3.16 6.5% 4.8% 22.8% (0.8%) 23.8% (3.5%) (4.7%)<br />
Argentina 32,462 18,957 $ 1.71<br />
6.0% 4.5% 46,226 20,006 $ 2.31 6.1% 4.6% 42.4% 5.5% 34.9% 2.7% 1.3%<br />
Portugal 39,595 6,315 $ 6.27<br />
2.0% 1.5% 45,514 6,874 $ 6.62 2.1% 1.6% 15.0% 8.9% 5.6% 5.9% 4.5%<br />
South Africa 34,264 12,196 $ 2.81<br />
3.9% 2.9% 37,736 12,374 $ 3.05 3.8% 2.8% 10.1% 1.5% 8.6% (1.3%) (2.6%)<br />
New Zealand 21,120 2,722 $ 7.76<br />
0.9% 0.6% 28,659 3,729 $ 7.69 1.1% 0.9% 35.7% 37.0% (0.9%) 33.2% 31.5%<br />
Germany 23,584 6,297 $ 3.75<br />
2.0% 1.5% 26,477 5,726 $ 4.62 1.8% 1.3% 12.3% (9.1%) 23.5% (11.5%) (12.7%)<br />
United Kingdom 7,081 3,903 $ 1.81<br />
1.2% 0.9% 9,434 5,015 $ 1.88 1.5% 1.1% 33.2% 28.5% 3.7% 25.0% 23.3%<br />
Greece 3,603 999 $ 3.61<br />
0.3% 0.2% 4,336 1,028 $ 4.22 0.3% 0.2% 20.4% 2.8% 17.0% 0.0% (1.3%)<br />
Japan 2,120 842 $ 2.52<br />
0.3% 0.2% 2,982 947 $ 3.15 0.3% 0.2% 40.7% 12.5% 25.0% 9.5% 8.0%<br />
Hungary 3,030 1,431 $ 2.12<br />
0.5% 0.3% 2,778 964 $ 2.88 0.3% 0.2% (8.3%) (32.6%) 36.1% (34.5%) (35.3%)<br />
Israel 953 179 $ 5.33<br />
0.1% 0.0% 1,319 208 $ 6.35 0.1% 0.0% 38.4% 16.2% 19.0% 13.1% 11.6%<br />
Austria 971 379 $ 2.56<br />
0.1% 0.1% 1,112 141 $ 7.91 0.0% 0.0% 14.5% (62.9%) 209.0% (63.9%) (64.4%)<br />
Romania 1,123 329 $ 3.42<br />
0.1% 0.1% 1,050 367 $ 2.87 0.1% 0.1% (6.5%) 11.5% (16.1%) 8.4% 7.0%<br />
Lebanon 489 51 $ 9.62<br />
0.0% 0.0% 920 104 $ 8.88 0.0% 0.0% 88.1% 103.8% (7.7%) 98.3% 95.7%<br />
Bulgaria 967 446 $ 2.17<br />
0.1% 0.1% 735 255 $ 2.88 0.1% 0.1% (24.0%) (42.8%) 33.0% (44.4%) (45.1%)<br />
LISTED COUNTRY IMPORTS 1,297,815 314,929 $ 4.12<br />
99.5% 75.0% 1,522,333 323,816 $ 4.70 99.5% 74.0% 17.3% 2.8% 14.1% 0.0% (1.3%)<br />
OTHER COUNTRY IMPORTS 5,197 1,641 $ 3.17<br />
0.5% 0.4% 5,604 1,619 $ 3.46 0.5% 0.4% 7.8% (1.3%) 9.3% (4.0%) (5.3%)<br />
TOTAL IMPORTS (3) 1,303,013 316,570 $ 4.12<br />
100.0% 75.4% 1,527,938 325,436 $ 4.70 100.0% 74.4% 17.3% 2.8% 14.1% 0.0% (1.3%)<br />
DOMESTIC WINE 103,430 24.6% 112,064 25.6% 8.3% 4.0%<br />
TOTAL MARKET (4) 420,000 100.0% 437,500 100.0% 4.2% 0.0%<br />
420,000 #########<br />
(1) Ranked by Value in 2007<br />
(2) Based on volume. "0.0%"Indicates less than 0.1%.<br />
(3) Some imported wines may be transshipped to other countries in which case the import market and the total market may be overstated.<br />
(4) Total wine market estimated at 420 million liters in 2006 and 437.5 million liters in 2007.<br />
See Appendices 1 & 2<br />
Source: Global Trade Information Service. Copyright: Trade Data and Analysis<br />
Table 2<br />
Page 2
COUNTRY WINE MARKET ANALYSIS - IMPORTS<br />
JAPAN<br />
2006, 2007 AND 2007/ 2006<br />
TABLE WINE, SPARKLING WINE DESSERT WINE, VERMOUTH AND OTHER SPECIAL NATURAL WINE<br />
VALUE ($US 000), VOLUME (LITERS 000) AND VALUE/LITER ($)<br />
HTS CODES 2204/2205/2206 COMBINED<br />
DOMESTIC WINE CONSUMPTION AND TOTAL WINE MARKET<br />
2006 2007<br />
2007/2006 (% CHANGE)<br />
MARKET MARKET SHARE (%) (2) MARKET MARKET SHARE (%) (2)<br />
MARKET MARKET SHARE (%) (2)<br />
VALUE VOLUME VALUE/ IMPORT TOTAL VALUE VOLUME VALUE/ IMPORT TOTAL VALUE VOLUME VALUE/ IMPORT TOTAL<br />
COUNTRY (1) ($US 000) LITERS (000) LITER ($) MARKET MARKET ($US 000) LITERS (000) LITER ($) MARKET MARKET ($US 000) LITERS (000) LITER ($) MARKET MARKET<br />
France 797,178 69,973 $ 11.39 32.2% 28.0% 841,445 67,038 $ 12.55 30.2% 27.4% 5.6% (4.2%) 10.2% (6.2%) (2.2%)<br />
Italy 135,912 28,956 $ 4.69 13.3% 11.6% 149,436 28,685 $ 5.21 12.9% 11.7% 10.0% (0.9%) 11.0% (3.0%) 1.1%<br />
United States 69,458 23,077 $ 3.01 10.6% 9.2% 75,759 21,212 $ 3.57<br />
9.5% 8.7% 9.1% (8.1%) 18.7% (10.0%) (6.2%)<br />
Spain 51,010 13,278 $ 3.84 6.1% 5.3% 61,631 15,619 $ 3.95<br />
7.0% 6.4% 20.8% 17.6% 2.7% 15.2% 20.0%<br />
Chile 35,587 13,018 $ 2.73 6.0% 5.2% 46,228 17,498 $ 2.64<br />
7.9% 7.1% 29.9% 34.4% (3.4%) 31.6% 37.2%<br />
Australia 35,592 8,136 $ 4.37 3.7% 3.3% 43,412 9,241 $ 4.70<br />
4.2% 3.8% 22.0% 13.6% 7.4% 11.2% 15.9%<br />
Germany 31,317 6,384 $ 4.91 2.9% 2.6% 25,395 4,799 $ 5.29<br />
2.2% 2.0% (18.9%) (24.8%) 7.9% (26.4%) (23.3%)<br />
Korea South 14,750 19,756 $ 0.75 9.1% 7.9% 20,975 28,654 $ 0.73 12.9% 11.7% 42.2% 45.0% (2.0%) 42.1% 48.0%<br />
Argentina 18,798 12,032 $ 1.56 5.5% 4.8% 18,936 11,652 $ 1.63<br />
5.2% 4.8% 0.7% (3.2%) 4.0% (5.1%) (1.2%)<br />
China 21,751 13,109 $ 1.66 6.0% 5.2% 17,482 8,518 $ 2.05<br />
3.8% 3.5% (19.6%) (35.0%) 23.7% (36.4%) (33.7%)<br />
New Zealand 4,914 523 $ 9.40 0.2% 0.2% 5,732 543 $ 10.56<br />
0.2% 0.2% 16.6% 3.9% 12.3% 1.8% 6.0%<br />
South Africa 5,119 1,816 $ 2.82 0.8% 0.7% 5,698 1,770 $ 3.22<br />
0.8% 0.7% 11.3% (2.6%) 14.2% (4.6%) (0.6%)<br />
Portugal 5,030 719 $ 7.00 0.3% 0.3% 5,651 766 $ 7.38<br />
0.3% 0.3% 12.3% 6.5% 5.5% 4.3% 8.7%<br />
Thailand 168 81 $ 2.08 0.0% 0.0% 1,612 2,062 $ 0.78<br />
0.9% 0.8% 860.0% 2453.0% (62.4%) 2400.5% 2505.1%<br />
Canada 1,782 119 $ 14.94 0.1% 0.0% 1,389 46 $ 30.24<br />
0.0% 0.0% (22.0%) (61.5%) 102.3% (62.3%) (60.7%)<br />
Belgium 1,302 461 $ 2.82 0.2% 0.2% 1,267 423 $ 2.99<br />
0.2% 0.2% (2.7%) (8.2%) 6.0% (10.1%) (6.3%)<br />
Austria 1,055 82 $ 12.83 0.0% 0.0% 1,123 90 $ 12.48<br />
0.0% 0.0% 6.5% 9.4% (2.7%) 7.1% 11.6%<br />
Hungary 1,732 419 $ 4.13 0.2% 0.2% 1,114 189 $ 5.88<br />
0.1% 0.1% (35.7%) (54.8%) 42.3% (55.7%) (53.9%)<br />
Taiwan 778 245 $ 3.18 0.1% 0.1% 884 276 $ 3.21<br />
0.1% 0.1% 13.7% 12.6% 0.9% 10.3% 14.9%<br />
United Kingdom 1,065 119 $ 8.94 0.1% 0.0% 705 136 $ 5.20<br />
0.1% 0.1% (33.8%) 13.8% (41.8%) 11.4% 16.1%<br />
LISTED COUNTRY IMPORTS 1,234,297 212,303 $ 5.81 97.6% 84.9% 1,325,874 219,217 $ 6.05 98.7% 89.5% 7.4% 3.3% 4.0% 1.1% 5.4%<br />
OTHER COUNTRY IMPORTS 9,796 5,330 $ 1.84 2.4% 2.1% 6,151 2,988 $ 2.06<br />
1.3% 1.2% (37.2%) (43.9%) 12.0% (45.1%) (42.8%)<br />
TOTAL IMPORTS (3) 1,244,092 217,633 $ 5.72 100.0% 87.1% 1,332,025 222,206 $ 5.99 100.0% 90.7% 7.1% 2.1% 4.9% 0.0% 4.2%<br />
DOMESTIC WINE 32,367 12.9% 22,794 9.3% (29.6%) (28.1%)<br />
TOTAL MARKET (4) 250,000 100.0% 245,000 100.0% (2.0%) 0.0%<br />
(1) Ranked by Value in 2007<br />
(2) Based on volume. "0.0%"Indicates less than 0.1%.<br />
(3) Some imported wines may be transshipped to other countries in which case the import market and the total market may be overstated.<br />
(4) Total wine market estimated at 250 million liters in 2006 and 245 million liters in 2007.<br />
See Appendices 1 & 2<br />
Source: Global Trade Information Service. Copyright: Trade Data and Analysis<br />
Table 3<br />
Page 3
COUNTRY WINE MARKET ANALYSIS - IMPORTS<br />
GERMANY<br />
2006, 2007 AND 2007/ 2006<br />
TABLE WINE, SPARKLING WINE DESSERT WINE, VERMOUTH AND OTHER SPECIAL NATURAL WINE<br />
VALUE ($US 000), VOLUME (LITERS 000) AND VALUE/LITER ($)<br />
HTS CODES 2204/2205/2206 COMBINED<br />
DOMESTIC WINE CONSUMPTION AND TOTAL WINE MARKET<br />
2006 2007 2007/2006 (% CHANGE)<br />
MARKET MARKET SHARE (%) (2) MARKET MARKET SHARE (%) (2)<br />
MARKET MARKET SHARE (%) (2)<br />
VALUE VOLUME VALUE/ IMPORT TOTAL VALUE VOLUME VALUE/ IMPORT TOTAL VALUE VOLUME VALUE/ IMPORT TOTAL<br />
COUNTRY (1) ($US 000) LITERS (000) LITER ($) MARKET MARKET ($US 000) LITERS (000) LITER ($) MARKET MARKET ($US 000) LITERS (000) LITER ($) MARKET MARKET<br />
Italy 845,252 647,158 $ 1.31 43.9% 32.6% 948,230 614,328 $ 1.54 41.3% 30.9% 12.2% (5.1%) 18.2% (6.0%) (5.3%)<br />
France 815,797 265,711 $ 3.07 18.0% 13.4% 859,179 263,426 $ 3.26 17.7% 13.2% 5.3% (0.9%) 6.2% (1.8%) (1.1%)<br />
Spain 390,112 222,268 $ 1.76 15.1% 11.2% 390,481 239,360 $ 1.63 16.1% 12.0% 0.1% 7.7% (7.1%) 6.7% 7.4%<br />
South Africa 65,576 36,159 $ 1.81 2.5% 1.8% 86,681 55,626 $ 1.56<br />
3.7% 2.8% 32.2% 53.8% (14.1%) 52.4% 53.5%<br />
Chile 52,000 36,345 $ 1.43 2.5% 1.8% 70,136 53,507 $ 1.31<br />
3.6% 2.7% 34.9% 47.2% (8.4%) 45.8% 46.8%<br />
United States 54,213 37,503 $ 1.45 2.5% 1.9% 69,292 41,851 $ 1.66<br />
2.8% 2.1% 27.8% 11.6% 14.5% 10.5% 11.3%<br />
Australia 54,971 32,669 $ 1.68 2.2% 1.6% 64,838 39,958 $ 1.62<br />
2.7% 2.0% 17.9% 22.3% (3.6%) 21.2% 22.0%<br />
Austria 47,165 32,460 $ 1.45 2.2% 1.6% 62,323 35,931 $ 1.73<br />
2.4% 1.8% 32.1% 10.7% 19.4% 9.6% 10.4%<br />
Denmark 39,973 18,540 $ 2.16 1.3% 0.9% 38,458 15,053 $ 2.55<br />
1.0% 0.8% (3.8%) (18.8%) 18.5% (19.6%) (19.0%)<br />
Portugal 31,492 14,169 $ 2.22 1.0% 0.7% 35,981 14,583 $ 2.47<br />
1.0% 0.7% 14.3% 2.9% 11.0% 1.9% 2.7%<br />
Netherlands 59,750 21,122 $ 2.83 1.4% 1.1% 35,068 11,548 $ 3.04<br />
0.8% 0.6% (41.3%) (45.3%) 7.4% (45.8%) (45.5%)<br />
Greece 25,627 13,640 $ 1.88 0.9% 0.7% 24,841 11,784 $ 2.11<br />
0.8% 0.6% (3.1%) (13.6%) 12.2% (14.4%) (13.8%)<br />
Macedonia 16,346 34,923 $ 0.47 2.4% 1.8% 20,204 37,957 $ 0.53<br />
2.6% 1.9% 23.6% 8.7% 13.7% 7.7% 8.4%<br />
Hungary 15,697 14,542 $ 1.08 1.0% 0.7% 18,726 13,710 $ 1.37<br />
0.9% 0.7% 19.3% (5.7%) 26.5% (6.6%) (6.0%)<br />
United Kingdom 20,020 9,278 $ 2.16 0.6% 0.5% 14,315 6,161 $ 2.32<br />
0.4% 0.3% (28.5%) (33.6%) 7.7% (34.2%) (33.8%)<br />
Argentina 10,683 6,057 $ 1.76 0.4% 0.3% 11,342 5,891 $ 1.93<br />
0.4% 0.3% 6.2% (2.7%) 9.2% (3.7%) (3.0%)<br />
Switzerland 8,315 1,280 $ 6.50 0.1% 0.1% 6,497 742 $ 8.75<br />
0.0% 0.0% (21.9%) (42.0%) 34.7% (42.5%) (42.1%)<br />
Romania 7,867 8,623 $ 0.91 0.6% 0.4% 6,225 6,790 $ 0.92<br />
0.5% 0.3% (20.9%) (21.3%) 0.5% (22.0%) (21.5%)<br />
New Zealand 3,053 527 $ 5.79 0.0% 0.0% 4,771 735 $ 6.49<br />
0.0% 0.0% 56.3% 39.4% 12.1% 38.1% 39.0%<br />
Ukraine 3,719 1,451 $ 2.56 0.1% 0.1% 4,004 1,284 $ 3.12<br />
0.1% 0.1% 7.7% (11.5%) 21.6% (12.3%) (11.7%)<br />
LISTED COUNTRY IMPORTS 2,567,629 1,454,426 $ 1.77 98.7% 73.3% 2,771,590 1,470,225 $ 1.89 98.8% 73.9% 7.9% 1.1% 6.8% 0.1% 0.8%<br />
OTHER COUNTRY IMPORTS 26,191 19,473 $ 1.34 1.3% 1.0% 30,463 17,816 $ 1.71<br />
1.2% 0.9% 16.3% (8.5%) 27.1% (9.4%) (8.7%)<br />
TOTAL IMPORTS 2,593,819 1,473,899 $ 1.76 100.0% 74.3% 2,802,054 1,488,041 $ 1.88 100.0% 74.8% 8.0% 1.0% 7.0% 0.0% 0.7%<br />
DOMESTIC WINE 511,101 25.7% 501,959 25.2% (1.8%) (2.0%)<br />
TOTAL MARKET (3) 1,985,000 100.0% 1,990,000 100.0% 0.3% 0.0%<br />
(1) Ranked by Value in 2007<br />
(2) Based on volume. "0.0%"Indicates less than 0.1%.<br />
(3) Some imported wines may be transshipped to other countries in which case the import market and the total market may be overstated.<br />
(4) Total wine market estimated at 1.985 billion liters in 2006 and 1.990 billion liters in 2007.<br />
See Appendices 1 & 2<br />
Source: Global Trade Information Service. Copyright: Trade Data and Analysis<br />
Table 4<br />
Page 4
COUNTRY WINE MARKET ANALYSIS - IMPORTS<br />
ITALY<br />
2006, 2007 AND 2007/ 2006<br />
TABLE WINE, SPARKLING WINE DESSERT WINE, VERMOUTH AND OTHER SPECIAL NATURAL WINE<br />
VALUE ($US 000), VOLUME (LITERS 000) AND VALUE/LITER ($)<br />
HTS CODES 2204/2205/2206 COMBINED<br />
DOMESTIC WINE CONSUMPTION AND TOTAL WINE MARKET<br />
2006 2007 2007/2006 (% CHANGE)<br />
MARKET MARKET SHARE (%) (2) MARKET MARKET SHARE (%) (2)<br />
MARKET MARKET SHARE (%) (2)<br />
VALUE VOLUME VALUE/ IMPORT TOTAL VALUE VOLUME VALUE/ IMPORT TOTAL VALUE VOLUME VALUE/ IMPORT TOTAL<br />
COUNTRY (1) ($US 000) LITERS (000) LITER ($) MARKET MARKET ($US 000) LITERS (000) LITER ($) MARKET MARKET ($US 000) LITERS (000) LITER ($) MARKET MARKET<br />
France 252,128 32,932 $ 7.66 21.2% 1.2% 313,778 35,700 $ 8.79 19.6% 1.3% 24.5% 8.4% 14.8% (7.8%) 10.0%<br />
United States 52,741 53,403 $ 0.99 34.4% 2.0% 68,967 63,220 $ 1.09 34.6% 2.4% 30.8% 18.4% 10.5% 0.7% 20.1%<br />
Spain 30,273 47,521 $ 0.64 30.6% 1.7% 46,041 50,896 $ 0.90 27.9% 1.9% 52.1% 7.1% 42.0% (8.9%) 8.7%<br />
Portugal 11,073 3,063 $ 3.62 2.0% 0.1% 16,520 12,944 $ 1.28<br />
7.1% 0.5% 49.2% 322.6% (64.7%) 259.4% 328.9%<br />
Germany 7,176 3,502 $ 2.05 2.3% 0.1% 10,389 4,716 $ 2.20<br />
2.6% 0.2% 44.8% 34.7% 7.5% 14.5% 36.7%<br />
Netherlands 6,000 1,584 $ 3.79 1.0% 0.1% 9,746 598 $ 16.31<br />
0.3% 0.0% 62.4% (62.3%) 330.4% (67.9%) (61.7%)<br />
United Kingdom 1,115 306 $ 3.64 0.2% 0.0% 3,333 645 $ 5.17<br />
0.4% 0.0% 199.0% 110.6% 41.9% 79.1% 113.8%<br />
Chile 2,461 1,091 $ 2.26 0.7% 0.0% 3,096 1,721 $ 1.80<br />
0.9% 0.1% 25.8% 57.7% (20.3%) 34.1% 60.1%<br />
Switzerland 972 100 $ 9.70 0.1% 0.0% 2,054 57 $ 36.32<br />
0.0% 0.0% 111.4% (43.5%) 274.3% (52.0%) (42.7%)<br />
Argentina 1,512 1,006 $ 1.50 0.6% 0.0% 2,050 1,496 $ 1.37<br />
0.8% 0.1% 35.6% 48.7% (8.8%) 26.4% 50.9%<br />
Austria 1,803 808 $ 2.23 0.5% 0.0% 1,931 889 $ 2.17<br />
0.5% 0.0% 7.1% 10.0% (2.6%) (6.4%) 11.7%<br />
Australia 2,404 1,244 $ 1.93 0.8% 0.0% 1,911 1,108 $ 1.72<br />
0.6% 0.0% (20.5%) (11.0%) (10.7%) (24.3%) (9.7%)<br />
Belgium 1,447 246 $ 5.89 0.2% 0.0% 1,682 411 $ 4.09<br />
0.2% 0.0% 16.3% 67.4% (30.5%) 42.4% 69.9%<br />
South Africa 744 428 $ 1.74 0.3% 0.0% 1,510 1,078 $ 1.40<br />
0.6% 0.0% 102.8% 151.9% (19.5%) 114.2% 155.6%<br />
Greece 1,831 3,541 $ 0.52 2.3% 0.1% 1,490 2,381 $ 0.63<br />
1.3% 0.1% (18.6%) (32.8%) 21.1% (42.8%) (31.8%)<br />
China 822 1,947 $ 0.42 1.3% 0.1% 1,018 2,212 $ 0.46<br />
1.2% 0.1% 23.9% 13.6% 9.1% (3.4%) 15.3%<br />
Japan 437 120 $ 3.63 0.1% 0.0% 897 222 $ 4.03<br />
0.1% 0.0% 105.3% 85.1% 10.9% 57.4% 87.9%<br />
Hungary 1,273 1,242 $ 1.03 0.8% 0.0% 874 763 $ 1.15<br />
0.4% 0.0% (31.3%) (38.6%) 11.8% (47.8%) (37.7%)<br />
Romania 765 254 $ 3.01 0.2% 0.0% 646 444 $ 1.46<br />
0.2% 0.0% (15.6%) 74.8% (51.7%) 48.7% 77.4%<br />
Israel 317 48 $ 6.64 0.0% 0.0% 431 62 $ 6.95<br />
0.0% 0.0% 36.0% 29.9% 4.7% 10.5% 31.8%<br />
LISTED COUNTRY IMPORTS 377,292 154,385 $ 2.44 99.4% 5.7% 488,363 181,561 $ 2.69 99.4% 6.7% 29.4% 17.6% 10.1% 0.0% 19.4%<br />
OTHER COUNTRY IMPORTS 1,834 875 $ 2.10 0.6% 0.0% 2,534 1,014 $ 2.50<br />
0.6% 0.0% 38.1% 15.9% 19.2% (1.4%) 17.6%<br />
TOTAL IMPORTS (3) 379,126 155,260 $ 2.44 100.0% 5.7% 490,898 182,575 $ 2.69 100.0% 6.8% 29.5% 17.6% 10.1% 0.0% 19.3%<br />
DOMESTIC WINE 2,574,740 94.3% 2,507,425 93.2% (2.6%) (1.2%)<br />
TOTAL MARKET (4) 2,730,000 100.0% 2,690,000 100.0% (1.5%) 0.0%<br />
(1) Ranked by Value in 2007<br />
(2) Based on volume. "0.0%"Indicates less than 0.1%.<br />
(3) Some imported wines may be transshipped to other countries in which case the import market and the total market may be overstated.<br />
(4) Total wine market estimated at 2.730 billion liters in 2006 and 2.690 billion liters in 2007.<br />
See Appendices 1 & 2<br />
Source: Global Trade Information Service. Copyright: Trade Data and Analysis<br />
Table 5<br />
Page 5
COUNTRY WINE MARKET ANALYSIS - IMPORTS<br />
NETHERLANDS<br />
2006, 2007 AND 2007/ 2006<br />
TABLE WINE, SPARKLING WINE DESSERT WINE, VERMOUTH AND OTHER SPECIAL NATURAL WINE<br />
VALUE ($US 000), VOLUME (LITERS 000) AND VALUE/LITER ($)<br />
HTS CODES 2204/2205/2206 COMBINED<br />
DOMESTIC WINE CONSUMPTION AND TOTAL WINE MARKET<br />
2006 2007 2007/2006 (% CHANGE)<br />
MARKET MARKET SHARE (%) (2) MARKET MARKET SHARE (%) (2)<br />
MARKET MARKET SHARE (%) (2)<br />
VALUE VOLUME VALUE/ IMPORT TOTAL VALUE VOLUME VALUE/ IMPORT TOTAL VALUE VOLUME VALUE/ IMPORT TOTAL<br />
COUNTRY (1) ($US 000) LITERS (000) LITER ($) MARKET MARKET ($US 000) LITERS (000) LITER ($) MARKET MARKET ($US 000) LITERS (000) LITER ($) MARKET MARKET<br />
France 338,254 104,354 $ 3.24 29.6% 28.6% 400,315 104,257 $ 3.84 29.3% 28.2% 18.3% (0.1%) 18.5% (1.0%) (1.4%)<br />
Germany 92,702 48,701 $ 1.90 13.8% 13.3% 106,724 54,097 $ 1.97 15.2% 14.6% 15.1% 11.1% 3.6% 10.1% 9.6%<br />
Italy 77,118 31,070 $ 2.48 8.8% 8.5% 98,429 32,426 $ 3.04<br />
9.1% 8.8% 27.6% 4.4% 22.3% 3.4% 3.0%<br />
Spain 78,157 34,808 $ 2.25 9.9% 9.5% 89,120 34,459 $ 2.59<br />
9.7% 9.3% 14.0% (1.0%) 15.2% (1.9%) (2.3%)<br />
Chile 55,599 21,102 $ 2.63 6.0% 5.8% 68,434 25,580 $ 2.68<br />
7.2% 6.9% 23.1% 21.2% 1.5% 20.1% 19.6%<br />
South Africa 66,982 37,033 $ 1.81 10.5% 10.1% 63,223 28,626 $ 2.21<br />
8.0% 7.7% (5.6%) (22.7%) 22.1% (23.4%) (23.7%)<br />
Australia 47,918 16,791 $ 2.85 4.8% 4.6% 61,773 18,807 $ 3.28<br />
5.3% 5.1% 28.9% 12.0% 15.1% 11.0% 10.5%<br />
Portugal 47,039 10,937 $ 4.30 3.1% 3.0% 50,132 10,705 $ 4.68<br />
3.0% 2.9% 6.6% (2.1%) 8.9% (3.0%) (3.4%)<br />
United States 40,161 16,302 $ 2.46 4.6% 4.5% 32,955 12,237 $ 2.69<br />
3.4% 3.3% (17.9%) (24.9%) 9.3% (25.6%) (25.9%)<br />
Argentina 22,456 9,557 $ 2.35 2.7% 2.6% 29,213 11,361 $ 2.57<br />
3.2% 3.1% 30.1% 18.9% 9.4% 17.8% 17.3%<br />
Belgium 34,869 13,216 $ 2.64 3.7% 3.6% 27,144 8,757 $ 3.10<br />
2.5% 2.4% (22.2%) (33.7%) 17.5% (34.3%) (34.6%)<br />
United Kingdom 14,436 5,266 $ 2.74 1.5% 1.4% 24,076 10,514 $ 2.29<br />
3.0% 2.8% 66.8% 99.7% (16.5%) 97.9% 97.0%<br />
New Zealand 4,538 770 $ 5.90 0.2% 0.2% 4,640 812 $ 5.72<br />
0.2% 0.2% 2.3% 5.5% (3.1%) 4.5% 4.1%<br />
Panama 556 162 $ 3.42 0.0% 0.0% 2,287 775 $ 2.95<br />
0.2% 0.2% 311.1% 377.0% (13.8%) 372.7% 370.5%<br />
Luxembourg 1,878 568 $ 3.31 0.2% 0.2% 1,370 325 $ 4.22<br />
0.1% 0.1% (27.0%) (42.8%) 27.5% (43.3%) (43.5%)<br />
Greece 1,149 529 $ 2.17 0.2% 0.1% 1,299 526 $ 2.47<br />
0.1% 0.1% 13.1% (0.6%) 13.7% (1.4%) (1.9%)<br />
Switzerland 487 289 $ 1.68 0.1% 0.1% 1,280 398 $ 3.21<br />
0.1% 0.1% 162.7% 37.8% 90.7% 36.5% 35.9%<br />
Austria 511 120 $ 4.24 0.0% 0.0% 1,140 153 $ 7.47<br />
0.0% 0.0% 123.0% 26.7% 76.0% 25.5% 25.0%<br />
Ireland 584 230 $ 2.54 0.1% 0.1% 756 345 $ 2.19<br />
0.1% 0.1% 29.5% 50.3% (13.9%) 49.0% 48.3%<br />
Japan 510 155 $ 3.29 0.0% 0.0% 695 168 0.0% 0.0%<br />
LISTED COUNTRY IMPORTS 925,905 351,962 $ 2.63 99.8% 96.4% 1,065,003 355,329 $ 3.00 99.8% 96.0% 15.0% 1.0% 13.9% 0.1% (0.4%)<br />
OTHER COUNTRY IMPORTS 3,180 809 $ 3.93 0.2% 0.2% 7,603 612 $ 12.42<br />
0.2% 0.2% 139.1% (24.3%) 215.9% (25.0%) (25.4%)<br />
TOTAL IMPORTS (3) 929,085 352,771 $ 2.63 100.0% 96.6% 1,072,606 355,941 $ 3.01 100.0% 96.2% 15.4% 0.9% 14.4% 0.0% (0.5%)<br />
DOMESTIC WINE 12,229 3.4% 14,059 3.8% 15.0% 13.4%<br />
TOTAL MARKET (4) 365,000 100.0% 370,000 100.0% 1.4% 0.0%<br />
(1) Ranked by Value in 2007<br />
(2) Based on volume. "0.0%"Indicates less than 0.1%.<br />
(3) Some imported wines may be transshipped to other countries in which case the import market and the total market may be overstated.<br />
(4) Total wine market estimated at 365 million liters in 2006 and 370 million liters in 2007.<br />
See Appendices 1 & 2<br />
Source: Global Trade Information Service. Copyright: Trade Data and Analysis<br />
Table 6<br />
Page 6
COUNTRY WINE MARKET ANALYSIS - IMPORTS<br />
SWITZERLAND<br />
2006, 2007 AND 2007/ 2006<br />
TABLE WINE, SPARKLING WINE DESSERT WINE, VERMOUTH AND OTHER SPECIAL NATURAL WINE<br />
VALUE ($US 000), VOLUME (LITERS 000) AND VALUE/LITER ($)<br />
HTS CODES 2204/2205/2206 COMBINED<br />
DOMESTIC WINE CONSUMPTION AND TOTAL WINE MARKET<br />
2006 2007 2007/2006 (% CHANGE)<br />
MARKET MARKET SHARE (%) (2) MARKET MARKET SHARE (%) (2)<br />
MARKET MARKET SHARE (%) (2)<br />
VALUE VOLUME VALUE/ IMPORT TOTAL VALUE VOLUME VALUE/ IMPORT TOTAL VALUE VOLUME VALUE/ IMPORT TOTAL<br />
COUNTRY (1) ($US 000) LITERS (000) LITER ($) MARKET MARKET ($US 000) LITERS (000) LITER ($) MARKET MARKET ($US 000) LITERS (000) LITER ($) MARKET MARKET<br />
France 335,035 53,817 $ 6.23 29.1% 19.9% 392,113 54,262 $ 7.23 27.7% 20.6% 17.0% 0.8% 16.1% (4.8%) 3.1%<br />
Italy 258,246 64,715 $ 3.99 35.0% 24.0% 317,310 67,010 $ 4.74 34.3% 25.4% 22.9% 3.5% 18.7% (2.2%) 5.9%<br />
Spain 109,923 32,540 $ 3.38 17.6% 12.1% 137,320 35,015 $ 3.92 17.9% 13.3% 24.9% 7.6% 16.1% 1.6% 10.1%<br />
Germany 27,655 5,399 $ 5.12 2.9% 2.0% 34,991 5,588 $ 6.26<br />
2.9% 2.1% 26.5% 3.5% 22.3% (2.2%) 5.8%<br />
United States 22,788 5,967 $ 3.82 3.2% 2.2% 32,091 7,197 $ 4.46<br />
3.7% 2.7% 40.8% 20.6% 16.8% 13.9% 23.4%<br />
Portugal 18,386 4,989 $ 3.69 2.7% 1.8% 22,789 5,562 $ 4.10<br />
2.8% 2.1% 23.9% 11.5% 11.2% 5.3% 14.0%<br />
Australia 16,690 4,042 $ 4.13 2.2% 1.5% 21,471 4,679 $ 4.59<br />
2.4% 1.8% 28.6% 15.8% 11.1% 9.3% 18.4%<br />
Austria 13,365 1,644 $ 8.13 0.9% 0.6% 16,210 2,228 $ 7.27<br />
1.1% 0.8% 21.3% 35.6% (10.5%) 28.1% 38.7%<br />
Chile 10,978 3,430 $ 3.20 1.9% 1.3% 12,977 4,220 $ 3.07<br />
2.2% 1.6% 18.2% 23.1% (3.9%) 16.2% 25.8%<br />
United Kingdom 4,270 241 $ 17.72 0.1% 0.1% 9,380 509 $ 18.42<br />
0.3% 0.2% 119.7% 111.4% 4.0% 99.6% 116.2%<br />
South Africa 7,424 3,413 $ 2.17 1.8% 1.3% 9,033 4,115 $ 2.20<br />
2.1% 1.6% 21.7% 20.5% 0.9% 13.9% 23.3%<br />
Argentina 5,277 1,384 $ 3.81 0.7% 0.5% 7,673 2,637 $ 2.91<br />
1.3% 1.0% 45.4% 90.5% (23.7%) 80.0% 94.9%<br />
Netherlands 1,288 302 $ 4.27 0.2% 0.1% 2,374 427 $ 5.57<br />
0.2% 0.2% 84.3% 41.3% 30.4% 33.5% 44.6%<br />
Belgium 1,402 533 $ 2.63 0.3% 0.2% 1,357 328 $ 4.14<br />
0.2% 0.1% (3.3%) (38.4%) 57.1% (41.8%) (37.0%)<br />
Greece 1,018 267 $ 3.81 0.1% 0.1% 1,309 270 $ 4.84<br />
0.1% 0.1% 28.6% 1.2% 27.2% (4.4%) 3.5%<br />
Hungary 1,216 979 $ 1.24 0.5% 0.4% 871 576 $ 1.51<br />
0.3% 0.2% (28.4%) (41.1%) 21.6% (44.4%) (39.8%)<br />
New Zealand 636 71 $ 9.00 0.0% 0.0% 695 67 $ 10.31<br />
0.0% 0.0% 9.2% (4.7%) 14.6% (10.0%) (2.6%)<br />
Lebanon 382 42 $ 9.16 0.0% 0.0% 470 57 $ 8.31<br />
0.0% 0.0% 22.9% 35.6% (9.3%) 28.1% 38.6%<br />
LISTED COUNTRY IMPORTS 835,978 183,773 $ 4.55 99.5% 68.1% 1,020,432 194,746 $ 5.24 99.6% 73.8% 22.1% 6.0% 15.2% 0.1% 8.4%<br />
OTHER COUNTRY IMPORTS 3,915 973 $ 4.02 0.5% 0.4% 7,778 827 $ 9.40<br />
0.4% 0.3% 98.7% (15.0%) 133.8% (19.7%) (13.1%)<br />
TOTAL IMPORTS (3) 839,893 184,746 $ 4.55 100.0% 68.4% 1,028,210 195,573 $ 5.26 100.0% 74.1% 22.4% 5.9% 15.6% 0.0% 8.3%<br />
DOMESTIC WINE 85,254 31.6% 68,427 25.9% (19.7%) (17.9%)<br />
DOMESTIC WINE 270,000 100.0% 264,000 100.0% (2.2%) 0.0%<br />
(1) Ranked by Value in 2007<br />
(2) Based on volume. "0.0%"Indicates less than 0.1%.<br />
(3) Some imported wines may be transshipped to other countries in which case the import market and the total market may be overstated.<br />
(4) Total wine market estimated at 270 million liters in 2006 and 264 million liters in 2007.<br />
See Appendices 1 & 2<br />
Source: Global Trade Information Service. Copyright: Trade Data and Analysis<br />
Table 7<br />
Page 7
COUNTRY WINE MARKET ANALYSIS - IMPORTS<br />
FRANCE<br />
2006, 2007 AND 2007/ 2006<br />
TABLE WINE, SPARKLING WINE DESSERT WINE, VERMOUTH AND OTHER SPECIAL NATURAL WINE<br />
VALUE ($US 000), VOLUME (LITERS 000) AND VALUE/LITER ($)<br />
HTS CODES 2204/2205/2206 COMBINED<br />
DOMESTIC WINE CONSUMPTION AND TOTAL WINE MARKET<br />
2006 2007 2007/2006 (% CHANGE)<br />
MARKET MARKET SHARE (%) (2) MARKET MARKET SHARE (%) (2)<br />
MARKET MARKET SHARE (%) (2)<br />
VALUE VOLUME VALUE/ IMPORT TOTAL VALUE VOLUME VALUE/ IMPORT TOTAL VALUE VOLUME VALUE/ IMPORT TOTAL<br />
COUNTRY (1) ($US 000) LITERS (000) LITER ($) MARKET MARKET ($US 000) LITERS (000) LITER ($) MARKET MARKET ($US 000) LITERS (000) LITER ($) MARKET MARKET<br />
Italy 134,724 157,439 $ 0.86 27.9% 4.8% 162,444 138,562 $ 1.17 24.6% 4.3% 20.6% (12.0%) 37.0% (11.6%) (10.7%)<br />
Portugal 130,859 54,894 $ 2.38 9.7% 1.7% 152,949 58,353 $ 2.62 10.4% 1.8% 16.9% 6.3% 10.0% 6.8% 7.8%<br />
Spain 125,992 254,815 $ 0.49 45.1% 7.8% 151,880 262,832 $ 0.58 46.7% 8.1% 20.5% 3.1% 16.9% 3.6% 4.6%<br />
United Kingdom 80,014 11,400 $ 7.02 2.0% 0.3% 101,243 11,985 $ 8.45<br />
2.1% 0.4% 26.5% 5.1% 20.4% 5.6% 6.6%<br />
Germany 37,609 16,678 $ 2.26 3.0% 0.5% 45,187 13,656 $ 3.31<br />
2.4% 0.4% 20.1% (18.1%) 46.7% (17.7%) (17.0%)<br />
Belgium 17,898 4,831 $ 3.70 0.9% 0.1% 32,190 5,433 $ 5.92<br />
1.0% 0.2% 79.9% 12.5% 59.9% 13.0% 14.1%<br />
United States 23,638 7,846 $ 3.01 1.4% 0.2% 30,412 10,029 $ 3.03<br />
1.8% 0.3% 28.7% 27.8% 0.6% 28.4% 29.6%<br />
Chile 21,438 14,318 $ 1.50 2.5% 0.4% 22,852 18,982 $ 1.20<br />
3.4% 0.6% 6.6% 32.6% (19.6%) 33.2% 34.5%<br />
Australia 13,675 9,059 $ 1.51 1.6% 0.3% 14,543 9,830 $ 1.48<br />
1.7% 0.3% 6.3% 8.5% (2.0%) 9.0% 10.1%<br />
South Africa 9,751 7,868 $ 1.24 1.4% 0.2% 10,438 7,280 $ 1.43<br />
1.3% 0.2% 7.0% (7.5%) 15.7% (7.1%) (6.2%)<br />
Morocco 9,114 6,240 $ 1.46 1.1% 0.2% 10,364 6,399 $ 1.62<br />
1.1% 0.2% 13.7% 2.6% 10.9% 3.0% 4.0%<br />
Netherlands 15,145 1,880 $ 8.06 0.3% 0.1% 9,264 852 $ 10.88<br />
0.2% 0.0% (38.8%) (54.7%) 35.0% (54.5%) (54.1%)<br />
Argentina 5,837 2,123 $ 2.75 0.4% 0.1% 7,553 2,514 $ 3.00<br />
0.4% 0.1% 29.4% 18.4% 9.3% 19.0% 20.1%<br />
Greece 8,842 4,759 $ 1.86 0.8% 0.1% 6,603 3,321 $ 1.99<br />
0.6% 0.1% (25.3%) (30.2%) 7.0% (29.9%) (29.2%)<br />
Switzerland 7,496 1,194 $ 6.28 0.2% 0.0% 5,914 655 $ 9.02<br />
0.1% 0.0% (21.1%) (45.1%) 43.7% (44.9%) (44.3%)<br />
New Zealand 4,306 634 $ 6.79 0.1% 0.0% 5,420 489 $ 11.08<br />
0.1% 0.0% 25.9% (22.8%) 63.1% (22.5%) (21.7%)<br />
Luxembourg 1,855 337 $ 5.50 0.1% 0.0% 2,816 383 $ 7.35<br />
0.1% 0.0% 51.8% 13.7% 33.5% 14.3% 15.3%<br />
Hungary 1,807 224 $ 8.05 0.0% 0.0% 2,582 248 $ 10.39<br />
0.0% 0.0% 42.9% 10.7% 29.0% 11.2% 12.3%<br />
Israel 1,630 297 $ 5.48 0.1% 0.0% 2,124 354 $ 5.99<br />
0.1% 0.0% 30.3% 19.2% 9.3% 19.7% 20.9%<br />
Lebanon 2,325 428 $ 5.44 0.1% 0.0% 1,979 393 $ 5.03<br />
0.1% 0.0% (14.9%) (8.0%) (7.5%) (7.6%) (6.7%)<br />
LISTED COUNTRY IMPORTS 653,957 557,263 $ 1.17 98.6% 17.0% 798,147 552,230 $ 1.45 98.2% 17.1% 22.0% (0.9%) 23.2% (0.4%) 0.5%<br />
OTHER COUNTRY IMPORTS 17,741 7,792 $ 2.28 1.4% 0.2% 16,514 10,240 $ 1.61<br />
1.8% 0.3% (6.9%) 31.4% (29.2%) 32.0% 33.3%<br />
TOTAL IMPORTS (3) 671,698 565,055 $ 1.19 100.0% 17.2% 814,661 562,469 $ 1.45 100.0% 17.4% 21.3% (0.5%) 21.8% 0.0% 1.0%<br />
DOMESTIC WINE 2,714,945 82.8% 2,671,531 82.6% (1.6%) (0.2%)<br />
TOTAL MARKET (4) 3,280,000 100.0% 3,234,000 100.0% (1.4%) 0.0%<br />
(1) Ranked by Value in 2007<br />
(2) Based on volume. "0.0%"Indicates less than 0.1%.<br />
(3) Some imported wines may be transshipped to other countries in which case the import market and the total market may be overstated.<br />
(4) Total wine market estimated at 3.280 billion liters in 2006 and 3.234 billion liters in 2007.<br />
See Appendices 1 & 2<br />
Source: Global Trade Information Service. Copyright: Trade Data and Analysis<br />
Table 8<br />
Page 8
COUNTRY WINE MARKET ANALYSIS - IMPORTS<br />
MEXICO<br />
2006, 2007 AND 2007/ 2006<br />
TABLE WINE, SPARKLING WINE DESSERT WINE, VERMOUTH AND OTHER SPECIAL NATURAL WINE<br />
VALUE ($US 000), VOLUME (LITERS 000) AND VALUE/LITER ($)<br />
HTS CODES 2204/2205/2206 COMBINED<br />
DOMESTIC WINE CONSUMPTION AND TOTAL WINE MARKET<br />
2006 2007 2007/2006 (% CHANGE)<br />
MARKET MARKET SHARE (%) (2) MARKET MARKET SHARE (%) (2)<br />
MARKET MARKET SHARE (%) (2)<br />
VALUE VOLUME VALUE/ IMPORT TOTAL VALUE VOLUME VALUE/ IMPORT TOTAL VALUE VOLUME VALUE/ IMPORT TOTAL<br />
COUNTRY (1) ($US 000) LITERS (000) LITER ($) MARKET MARKET ($US 000) LITERS (000) LITER ($) MARKET MARKET ($US 000) LITERS (000) LITER ($) MARKET MARKET<br />
Spain 45,003 9,637 $ 4.67 23.4% 6.4% 45,311 9,237 $ 4.91 19.2% 5.8% 0.7% (4.2%) 5.0% (18.1%) (10.1%)<br />
Chile 25,676 9,283 $ 2.77 22.6% 6.2% 29,294 13,754 $ 2.13 28.6% 8.6% 14.1% 48.2% (23.0%) 26.7% 38.9%<br />
France 23,311 2,397 $ 9.73 5.8% 1.6% 27,199 2,555 $ 10.65<br />
5.3% 1.6% 16.7% 6.6% 9.5% (8.9%) (0.1%)<br />
United States 20,662 9,980 $ 2.07 24.3% 6.7% 24,353 11,346 $ 2.15 23.6% 7.1% 17.9% 13.7% 3.7% (2.8%) 6.6%<br />
Italy 9,984 2,553 $ 3.91 6.2% 1.7% 14,287 3,563 $ 4.01<br />
7.4% 2.2% 43.1% 39.6% 2.5% 19.3% 30.9%<br />
Argentina 8,521 4,777 $ 1.78 11.6% 3.2% 11,536 4,991 $ 2.31 10.4% 3.1% 35.4% 4.5% 29.6% (10.7%) (2.1%)<br />
Germany 3,408 1,401 $ 2.43 3.4% 0.9% 3,607 1,386 $ 2.60<br />
2.9% 0.9% 5.8% (1.1%) 7.0% (15.4%) (7.3%)<br />
Portugal 1,478 494 $ 2.99 1.2% 0.3% 2,105 534 $ 3.94<br />
1.1% 0.3% 42.5% 8.0% 31.9% (7.6%) 1.3%<br />
Australia 1,414 319 $ 4.43 0.8% 0.2% 1,944 400 $ 4.86<br />
0.8% 0.3% 37.5% 25.5% 9.6% 7.3% 17.6%<br />
Uruguay 237 47 $ 5.10 0.1% 0.0% 397 99 $ 4.02<br />
0.2% 0.1% 67.7% 112.6% (21.1%) 81.8% 99.3%<br />
South Africa 205 47 $ 4.36 0.1% 0.0% 270 69 $ 3.88<br />
0.1% 0.0% 31.3% 47.4% (10.9%) 26.0% 38.2%<br />
Japan 105 7 $ 15.13 0.0% 0.0% 222 13 $ 17.34<br />
0.0% 0.0% 111.8% 84.9% 14.6% 58.0% 73.3%<br />
New Zealand 81 11 $ 7.36 0.0% 0.0% 208 23 $ 9.01<br />
0.0% 0.0% 156.1% 109.2% 22.4% 78.8% 96.1%<br />
Greece 60 85 $ 0.71 0.2% 0.1% 89 101 $ 0.88<br />
0.2% 0.1% 47.3% 18.7% 24.1% 1.5% 11.3%<br />
Canada 27 1 $ 27.33 0.0% 0.0% 56 1 $ 45.19<br />
0.0% 0.0% 105.2% 24.1% 65.3% 6.1% 16.3%<br />
Hungary 44 4 $ 10.92 0.0% 0.0% 45 7 $ 6.64<br />
0.0% 0.0% 1.8% 67.3% (39.1%) 43.0% 56.8%<br />
Israel 26 11 $ 2.27 0.0% 0.0% 35 9 $ 3.64<br />
0.0% 0.0% 34.0% (16.5%) 60.5% (28.6%) (21.7%)<br />
Denmark 7 0 $ 25.43 0.0% 0.0% 27 10 $ 2.69<br />
0.0% 0.0% 294.4% 3621.8% (89.4%) 3081.9% 3389.2%<br />
Ireland 22 2 $ 11.73<br />
Brazil 19 3 $ 7.24<br />
LISTED COUNTRY IMPORTS 140,249 41,055 $ 3.42 99.8% 27.4% 161,027 48,102 $ 3.35 100.0% 30.1% 14.8% 17.2% (2.0%) 0.2% 9.8%<br />
OTHER COUNTRY IMPORTS 232 89 $ 2.61 0.2% 0.1% 77 22 $ 3.45<br />
0.0% 0.0% (66.7%) (74.8%) 32.0% (78.4%) (76.4%)<br />
TOTAL IMPORTS (3) 140,481 41,144 $ 3.41 100.0% 27.4% 161,104 48,125 $ 3.35 100.0% 30.1% 14.7% 17.0% (2.0%) 0.0% 9.7%<br />
DOMESTIC WINE 108,856 72.6% 111,875 69.9% 2.8% (3.7%)<br />
TOTAL MARKET (4) 150,000 100.0% 160,000 100.0% 6.7% 0.0%<br />
(1) Ranked by Value in 2007<br />
(2) Based on volume. "0.0%"Indicates less than 0.1%.<br />
(3) Some imported wines may be transshipped to other countries in which case the import market and the total market may be overstated.<br />
(4) Total wine market estimated at 150 million liters in 2006 and 160 million liters in 2007.<br />
See Appendices 1 & 2<br />
Source: Global Trade Information Service. Copyright: Trade Data and Analysis<br />
Table 9<br />
Page 9
COUNTRY WINE MARKET ANALYSIS - IMPORTS<br />
DENMARK<br />
2006, 2007 AND 2007/ 2006<br />
TABLE WINE, SPARKLING WINE DESSERT WINE, VERMOUTH AND OTHER SPECIAL NATURAL WINE<br />
VALUE ($US 000), VOLUME (LITERS 000) AND VALUE/LITER ($)<br />
HTS CODES 2204/2205/2206 COMBINED<br />
DOMESTIC WINE CONSUMPTION AND TOTAL WINE MARKET<br />
2006 2007 2007/2006 (% CHANGE)<br />
MARKET MARKET SHARE (%) (2) MARKET MARKET SHARE (%) (2)<br />
MARKET MARKET SHARE (%) (2)<br />
VALUE VOLUME VALUE/ IMPORT TOTAL VALUE VOLUME VALUE/ IMPORT TOTAL VALUE VOLUME VALUE/ IMPORT TOTAL<br />
COUNTRY (1) ($US 000) LITERS (000) LITER ($) MARKET MARKET ($US 000) LITERS (000) LITER ($) MARKET MARKET ($US 000) LITERS (000) LITER ($) MARKET MARKET<br />
France 176,245 37,972 $ 4.64 19.3% 19.0% 186,504 33,047 $ 5.64 16.8% 16.5% 5.8% (13.0%) 21.6% (12.9%) (13.0%)<br />
Italy 127,304 28,450 $ 4.47 14.5% 14.2% 147,425 27,713 $ 5.32 14.1% 13.9% 15.8% (2.6%) 18.9% (2.5%) (2.6%)<br />
Spain 57,521 23,638 $ 2.43 12.0% 11.8% 64,257 20,203 $ 3.18 10.3% 10.1% 11.7% (14.5%) 30.7% (14.5%) (14.5%)<br />
Chile 52,609 25,650 $ 2.05 13.1% 12.8% 59,677 28,161 $ 2.12 14.4% 14.1% 13.4% 9.8% 3.3% 9.8% 9.8%<br />
Australia 47,188 20,861 $ 2.26 10.6% 10.4% 58,503 25,025 $ 2.34 12.8% 12.5% 24.0% 20.0% 3.4% 20.0% 20.0%<br />
Germany 34,372 15,862 $ 2.17 8.1% 7.9% 46,070 17,469 $ 2.64<br />
8.9% 8.7% 34.0% 10.1% 21.7% 10.2% 10.1%<br />
South Africa 30,737 11,942 $ 2.57 6.1% 6.0% 34,016 13,147 $ 2.59<br />
6.7% 6.6% 10.7% 10.1% 0.5% 10.1% 10.1%<br />
United Kingdom 20,857 6,506 $ 3.21 3.3% 3.3% 28,956 7,156 $ 4.05<br />
3.6% 3.6% 38.8% 10.0% 26.2% 10.0% 10.0%<br />
Argentina 21,527 8,924 $ 2.41 4.5% 4.5% 23,321 8,818 $ 2.64<br />
4.5% 4.4% 8.3% (1.2%) 9.6% (1.1%) (1.2%)<br />
Portugal 18,121 3,613 $ 5.01 1.8% 1.8% 19,392 3,483 $ 5.57<br />
1.8% 1.7% 7.0% (3.6%) 11.0% (3.6%) (3.6%)<br />
United States 16,417 8,423 $ 1.95 4.3% 4.2% 17,964 7,133 $ 2.52<br />
3.6% 3.6% 9.4% (15.3%) 29.2% (15.3%) (15.3%)<br />
New Zealand 4,176 605 $ 6.90 0.3% 0.3% 4,878 636 $ 7.68<br />
0.3% 0.3% 16.8% 5.0% 11.2% 5.1% 5.0%<br />
Sweden 3,615 937 $ 3.86 0.5% 0.5% 4,445 1,547 $ 2.87<br />
0.8% 0.8% 23.0% 65.1% (25.5%) 65.2% 65.1%<br />
Finland 1,348 984 $ 1.37 0.5% 0.5% 1,993 1,392 $ 1.43<br />
0.7% 0.7% 47.9% 41.5% 4.5% 41.5% 41.5%<br />
Netherlands 1,546 191 $ 8.09 0.1% 0.1% 1,692 111 $ 15.29<br />
0.1% 0.1% 9.4% (42.1%) 88.9% (42.1%) (42.1%)<br />
Austria 557 41 $ 13.49 0.0% 0.0% 1,179 76 $ 15.41<br />
0.0% 0.0% 111.6% 85.2% 14.2% 85.3% 85.2%<br />
Greece 1,170 424 $ 2.76 0.2% 0.2% 1,148 360 $ 3.18<br />
0.2% 0.2% (1.9%) (15.1%) 15.4% (15.0%) (15.1%)<br />
Belgium 1,117 69 $ 16.19 0.0% 0.0% 1,143 29 $ 39.74<br />
0.0% 0.0% 2.3% (58.3%) 145.4% (58.3%) (58.3%)<br />
Switzerland 444 16 $ 27.66 0.0% 0.0% 561 4 $ 134.65<br />
0.0% 0.0% 26.4% (74.0%) 386.8% (74.0%) (74.0%)<br />
Lithuania 121 392 46 $ 8.62<br />
0.0% 0.0% 224.7%<br />
LISTED COUNTRY IMPORTS 616,993 195,109 $ 3.16 99.4% 97.6% 703,515 195,556 $ 3.60 99.7% 97.8% 14.0% 0.2% 13.8% 0.3% 0.2%<br />
OTHER COUNTRY IMPORTS 3,044 1,154 $ 2.64 0.6% 0.6% 2,241 625 $ 3.59<br />
0.3% 0.3% (26.4%) (45.9%) 36.0% (45.8%) (45.9%)<br />
TOTAL IMPORTS (3) 620,037 196,263 $ 3.16 100.0% 98.1% 705,757 196,181 $ 3.60 100.0% 98.1% 13.8% (0.0%) 13.9% 0.0% (0.0%)<br />
DOMESTIC WINE 3,737 1.9% 3,819 1.9% 2.2% 2.2%<br />
TOTAL MARKET (4) 200,000 100.0% 200,000 100.0% 0.0% 0.0%<br />
(1) Ranked by Value in 2007<br />
(2) Based on volume. "0.0%"Indicates less than 0.1%.<br />
(3) Some imported wines may be transshipped to other countries in which case the import market and the total market may be overstated.<br />
(4) Total wine market estimated at 200 million liters in 2006 and 200 million liters in 2007.<br />
See Appendices 1 & 2<br />
Source: Global Trade Information Service. Copyright: Trade Data and Analysis<br />
Table 10<br />
Page 10
COUNTRY WINE MARKET ANALYSIS - IMPORTS<br />
SOUTH KOREA<br />
2006, 2007 AND 2007/ 2006<br />
TABLE WINE, SPARKLING WINE DESSERT WINE, VERMOUTH AND OTHER SPECIAL NATURAL WINE<br />
VALUE ($US 000), VOLUME (LITERS 000) AND VALUE/LITER ($)<br />
HTS CODES 2204/2205/2206 COMBINED<br />
DOMESTIC WINE CONSUMPTION AND TOTAL WINE MARKET<br />
2006 2007 2007/2006 (% CHANGE)<br />
MARKET MARKET SHARE (%) (2) MARKET MARKET SHARE (%) (2)<br />
MARKET MARKET SHARE (%) (2)<br />
VALUE VOLUME VALUE/ IMPORT TOTAL VALUE VOLUME VALUE/ IMPORT TOTAL VALUE VOLUME VALUE/ IMPORT TOTAL<br />
COUNTRY (1) ($US 000) LITERS (000) LITER ($) MARKET MARKET ($US 000) LITERS (000) LITER ($) MARKET MARKET ($US 000) LITERS (000) LITER ($) MARKET MARKET<br />
France 32,714 4,703 $ 6.96 20.4% 19.6% 59,158 7,285 $ 0.86 21.5% 20.8% 80.8% 54.9% (87.6%) 5.6% 6.2%<br />
Chile 15,382 3,772 $ 4.08 16.3% 15.7% 25,594 6,432 $ 2.38 19.0% 18.4% 66.4% 70.5% (41.6%) 16.2% 16.9%<br />
Italy 9,082 1,896 $ 4.79 8.2% 7.9% 19,650 3,293 $ 0.49<br />
9.7% 9.4% 116.4% 73.7% (89.8%) 18.4% 19.1%<br />
United States 12,739 4,062 $ 3.14 17.6% 16.9% 16,834 4,766 $ 7.02 14.1% 13.6% 32.1% 17.3% 123.9% (20.0%) (19.5%)<br />
Australia 6,695 1,603 $ 4.18 6.9% 6.7% 11,240 2,422 $ 2.26<br />
7.2% 6.9% 67.9% 51.1% (45.9%) 3.0% 3.6%<br />
Spain 4,506 3,638 $ 1.24 15.8% 15.2% 7,529 5,359 $ 3.70 15.8% 15.3% 67.1% 47.3% 198.7% 0.4% 1.0%<br />
Germany 3,524 1,277 $ 2.76 5.5% 5.3% 4,646 1,545 $ 3.01<br />
4.6% 4.4% 31.8% 21.0% 9.1% (17.6%) (17.1%)<br />
Japan 2,670 729 $ 3.66 3.2% 3.0% 3,986 1,153 $ 1.50<br />
3.4% 3.3% 49.3% 58.1% (59.0%) 7.8% 8.4%<br />
Argentina 1,744 512 $ 3.40 2.2% 2.1% 2,278 664 $ 1.51<br />
2.0% 1.9% 30.6% 29.6% (55.7%) (11.7%) (11.1%)<br />
South Africa 1,005 514 $ 1.95 2.2% 2.1% 1,016 382 $ 1.24<br />
1.1% 1.1% 1.1% (25.6%) (36.5%) (49.3%) (49.0%)<br />
New Zealand 443 44 $ 10.15 0.2% 0.2% 963 100 $ 1.46<br />
0.3% 0.3% 117.5% 129.7% (85.6%) 56.5% 57.5%<br />
Canada 685 20 $ 33.87 0.1% 0.1% 954 35 $ 8.06<br />
0.1% 0.1% 39.2% 74.6% (76.2%) 19.0% 19.7%<br />
Portugal 168 22 $ 7.80 0.1% 0.1% 247 28 $ 2.75<br />
0.1% 0.1% 46.7% 31.6% (64.7%) (10.3%) (9.8%)<br />
China 101 88 $ 1.14 0.4% 0.4% 228 146 $ 1.86<br />
0.4% 0.4% 125.5% 65.1% 62.7% 12.5% 13.2%<br />
Romania 126 62 $ 2.05 0.3% 0.3% 172 67 $ 6.28<br />
0.2% 0.2% 36.4% 8.7% 206.6% (25.9%) (25.4%)<br />
Hungary 59 4 $ 13.50 0.0% 0.0% 153 98 $ 6.79<br />
0.3% 0.3% 158.0% 2124.3% (49.7%) 1416.0% 1425.2%<br />
Georgia 2 1 $ 2.94 0.0% 0.0% 74 10 $ 5.50<br />
0.0% 0.0% 3439.1% 1319.7% 86.9% 867.7% 873.5%<br />
Netherlands 24 3 $ 7.63 0.0% 0.0% 66 10 $ 8.05<br />
0.0% 0.0% 171.2% 208.9% 5.4% 110.5% 111.8%<br />
Austria 29 4 $ 6.83 0.0% 0.0% 58 9 $ 5.48<br />
0.0% 0.0% 97.7% 100.5% (19.8%) 36.6% 37.5%<br />
Israel 110 34 $ 3.22 0.1% 0.1% 50 12 $ 5.44<br />
0.0% 0.0% (54.6%) (65.4%) 69.2% (76.4%) (76.3%)<br />
LISTED COUNTRY IMPORTS 91,811 22,988 $ 3.99 99.6% 95.8% 154,896 33,816 $ 1.17 99.9% 96.6% 68.7% 47.1% (70.7%) 0.3% 0.9%<br />
OTHER COUNTRY IMPORTS 263 82 $ 3.21 0.4% 0.3% 196 32 $ 2.28<br />
0.1% 0.1% (25.4%) (61.5%) (29.0%) (73.8%) (73.6%)<br />
TOTAL IMPORTS (3) 92,074 23,070 $ 3.99 100.0% 96.1% 155,092 33,848 $ 1.19 100.0% 96.7% 68.4% 46.7% (70.2%) 0.0% 0.6%<br />
DOMESTIC WINE 930 3.9% 1,152 3.3% 23.8% (15.1%)<br />
TOTAL MARKET (4) 24,000 100.0% 35,000 100.0% 45.8% 0.0%<br />
(1) Ranked by Value in 2007<br />
(2) Based on volume. "0.0%"Indicates less than 0.1%.<br />
(3) Some imported wines may be transshipped to other countries in which case the import market and the total market may be overstated.<br />
(4) Total wine market estimated at 24 million liters in 2006 and 35 million liters in 2007.<br />
See Appendices 1 & 2<br />
Source: Global Trade Information Service. Copyright: Trade Data and Analysis<br />
Table 11<br />
Page 11
COUNTRY WINE MARKET ANALYSIS - IMPORTS<br />
SWEDEN<br />
2006, 2007 AND 2007/ 2006<br />
TABLE WINE, SPARKLING WINE DESSERT WINE, VERMOUTH AND OTHER SPECIAL NATURAL WINE<br />
VALUE ($US 000), VOLUME (LITERS 000) AND VALUE/LITER ($)<br />
HTS CODES 2204/2205/2206 COMBINED<br />
DOMESTIC WINE CONSUMPTION AND TOTAL WINE MARKET<br />
2006 2007 2007/2006 (% CHANGE)<br />
MARKET MARKET SHARE (%) (2) MARKET MARKET SHARE (%) (2)<br />
MARKET MARKET SHARE (%) (2)<br />
VALUE VOLUME VALUE/ IMPORT TOTAL VALUE VOLUME VALUE/ IMPORT TOTAL VALUE VOLUME VALUE/ IMPORT TOTAL<br />
COUNTRY (1) ($US 000) LITERS (000) LITER ($) MARKET MARKET ($US 000) LITERS (000) LITER ($) MARKET MARKET ($US 000) LITERS (000) LITER ($) MARKET MARKET<br />
France 93,155 17,968 $ 5.18 10.4% 9.8% 116,386 19,058 $ 6.11 10.2% 9.5% 24.9% 6.1% 17.8% (2.2%) (2.9%)<br />
Italy 82,672 23,845 $ 3.47 13.9% 13.0% 98,613 25,792 $ 3.82 13.8% 12.9% 19.3% 8.2% 10.3% (0.2%) (1.0%)<br />
South Africa 54,784 21,964 $ 2.49 12.8% 12.0% 73,824 25,780 $ 2.86 13.8% 12.9% 34.8% 17.4% 14.8% 8.3% 7.4%<br />
Spain 62,389 29,096 $ 2.14 16.9% 15.9% 71,107 27,059 $ 2.63 14.5% 13.5% 14.0% (7.0%) 22.6% (14.2%) (14.9%)<br />
Germany 34,185 20,886 $ 1.64 12.1% 11.4% 48,502 26,454 $ 1.83 14.2% 13.2% 41.9% 26.7% 12.0% 16.8% 15.9%<br />
Australia 43,157 11,736 $ 3.68 6.8% 6.4% 44,116 9,981 $ 4.42<br />
5.4% 5.0% 2.2% (15.0%) 20.2% (21.5%) (22.2%)<br />
Denmark 38,681 17,823 $ 2.17 10.4% 9.7% 40,712 17,477 $ 2.33<br />
9.4% 8.7% 5.3% (1.9%) 7.3% (9.5%) (10.3%)<br />
Chile 24,819 8,560 $ 2.90 5.0% 4.7% 32,849 10,215 $ 3.22<br />
5.5% 5.1% 32.4% 19.3% 10.9% 10.1% 9.2%<br />
United Kingdom 13,962 4,972 $ 2.81 2.9% 2.7% 30,900 9,465 $ 3.26<br />
5.1% 4.7% 121.3% 90.4% 16.2% 75.6% 74.2%<br />
Portugal 12,199 3,288 $ 3.71 1.9% 1.8% 13,093 3,084 $ 4.25<br />
1.7% 1.5% 7.3% (6.2%) 14.4% (13.5%) (14.2%)<br />
United States 11,100 2,205 $ 5.03 1.3% 1.2% 11,789 2,071 $ 5.69<br />
1.1% 1.0% 6.2% (6.1%) 13.1% (13.4%) (14.1%)<br />
Argentina 7,908 2,746 $ 2.88 1.6% 1.5% 9,223 3,020 $ 3.05<br />
1.6% 1.5% 16.6% 10.0% 6.0% 1.4% 0.6%<br />
New Zealand 2,845 401 $ 7.09 0.2% 0.2% 4,262 563 $ 7.58<br />
0.3% 0.3% 49.8% 40.2% 6.9% 29.3% 28.3%<br />
Bulgaria 4,276 2,215 $ 1.93 1.3% 1.2% 3,947 1,882 $ 2.10<br />
1.0% 0.9% (7.7%) (15.0%) 8.6% (21.6%) (22.2%)<br />
Hungary 5,041 2,313 $ 2.18 1.3% 1.3% 3,889 1,485 $ 2.62<br />
0.8% 0.7% (22.9%) (35.8%) 20.2% (40.8%) (41.3%)<br />
Finland 2,233 790 $ 2.83 0.5% 0.4% 2,966 1,316 $ 2.25<br />
0.7% 0.7% 32.9% 66.5% (20.2%) 53.6% 52.4%<br />
Austria 1,298 193 $ 6.73 0.1% 0.1% 2,423 354 $ 6.84<br />
0.2% 0.2% 86.7% 83.5% 1.7% 69.3% 67.9%<br />
Belgium 484 171 $ 2.84 0.1% 0.1% 1,252 332 $ 3.77<br />
0.2% 0.2% 158.5% 94.9% 32.7% 79.8% 78.3%<br />
Norway 703 218 $ 3.23 0.1% 0.1% 779 220 $ 3.53<br />
0.1% 0.1% 10.7% 1.3% 9.3% (6.6%) (7.3%)<br />
Greece 645 236 $ 2.73 0.1% 0.1% 733 197 $ 3.73<br />
0.1% 0.1% 13.6% (16.7%) 36.3% (23.2%) (23.8%)<br />
LISTED COUNTRY IMPORTS 496,538 171,625 $ 2.89 99.8% 93.8% 611,365 185,803 $ 3.29 99.6% 92.9% 23.1% 8.3% 13.7% (0.1%) (0.9%)<br />
OTHER COUNTRY IMPORTS 2,193 426 $ 5.15 0.2% 0.2% 3,307 700 $ 4.72<br />
0.4% 0.4% 50.8% 64.4% (8.3%) 51.7% 50.4%<br />
TOTAL IMPORTS (3) 498,731 172,051 $ 2.90 100.0% 94.0% 614,671 186,504 $ 3.30 100.0% 93.3% 23.2% 8.4% 13.7% 0.0% (0.8%)<br />
DOMESTIC WINE 10,949 6.0% 13,496 6.7% 23.3% 12.8%<br />
TOTAL MARKET (4) 183,000 100.0% 200,000 100.0% 9.3% 0.0%<br />
(1) Ranked by Value in 2007<br />
(2) Based on volume. "0.0%"Indicates less than 0.1%.<br />
(3) Some imported wines may be transshipped to other countries in which case the import market and the total market may be overstated.<br />
(4) Total wine market estimated at 183 million liters in 2006 and 200 million liters in 2007.<br />
See Appendices 1 & 2<br />
Source: Global Trade Information Service. Copyright: Trade Data and Analysis<br />
Table 12<br />
Page 12
COUNTRY WINE MARKET ANALYSIS - IMPORTS<br />
CHINA<br />
2006, 2007 AND 2007/ 2006<br />
TABLE WINE, SPARKLING WINE DESSERT WINE, VERMOUTH AND OTHER SPECIAL NATURAL WINE<br />
VALUE ($US 000), VOLUME (LITERS 000) AND VALUE/LITER ($)<br />
HTS CODES 2204/2205/2206 COMBINED<br />
DOMESTIC WINE CONSUMPTION AND TOTAL WINE MARKET<br />
2006 2007 2007/2006 (% CHANGE)<br />
MARKET MARKET SHARE (%) (2) MARKET MARKET SHARE (%) (2)<br />
MARKET MARKET SHARE (%) (2)<br />
VALUE VOLUME VALUE/ IMPORT TOTAL VALUE VOLUME VALUE/ IMPORT TOTAL VALUE VOLUME VALUE/ IMPORT TOTAL<br />
COUNTRY (1) ($US 000) LITERS (000) LITER ($) MARKET MARKET ($US 000) LITERS (000) LITER ($) MARKET MARKET ($US 000) LITERS (000) LITER ($) MARKET MARKET<br />
France 39,212 10,481 $ 3.74 9.0% 0.7% 98,211 20,921 $ 4.69 14.0% 1.2% 150.5% 99.6% 25.5% 55.2% 81.5%<br />
Chile 21,314 31,973 $ 0.67 27.5% 2.0% 46,559 74,312 $ 0.63 49.6% 4.2% 118.4% 132.4% (6.0%) 80.7% 111.3%<br />
Australia 27,335 20,216 $ 1.35 17.4% 1.3% 45,321 20,249 $ 2.24 13.5% 1.2% 65.8% 0.2% 65.5% (22.1%) (8.9%)<br />
Italy 12,273 9,553 $ 1.28 8.2% 0.6% 20,523 7,660 $ 2.68<br />
5.1% 0.4% 67.2% (19.8%) 108.6% (37.7%) (27.1%)<br />
Spain 19,864 30,739 $ 0.65 26.4% 1.9% 17,487 13,385 $ 1.31<br />
8.9% 0.8% (12.0%) (56.5%) 102.2% (66.2%) (60.4%)<br />
United States 6,851 3,541 $ 1.93 3.0% 0.2% 10,972 5,407 $ 2.03<br />
3.6% 0.3% 60.1% 52.7% 4.9% 18.7% 38.8%<br />
Germany 2,670 675 $ 3.95 0.6% 0.0% 5,489 1,226 $ 4.48<br />
0.8% 0.1% 105.6% 81.5% 13.3% 41.1% 65.0%<br />
Argentina 4,067 6,838 $ 0.59 5.9% 0.4% 3,204 2,437 $ 1.31<br />
1.6% 0.1% (21.2%) (64.4%) 121.1% (72.3%) (67.6%)<br />
South Africa 1,048 435 $ 2.41 0.4% 0.0% 2,386 1,177 $ 2.03<br />
0.8% 0.1% 127.7% 170.7% (15.9%) 110.4% 146.1%<br />
Canada 609 77 $ 7.96 0.1% 0.0% 1,939 136 $ 14.28<br />
0.1% 0.0% 218.3% 77.3% 79.5% 37.8% 61.2%<br />
Portugal 960 349 $ 2.75 0.3% 0.0% 1,929 814 $ 2.37<br />
0.5% 0.0% 100.9% 133.4% (13.9%) 81.4% 112.2%<br />
New Zealand 1,314 185 $ 7.11 0.2% 0.0% 1,900 269 $ 7.06<br />
0.2% 0.0% 44.6% 45.7% (0.7%) 13.2% 32.4%<br />
Japan 1,442 406 $ 3.55 0.3% 0.0% 1,846 453 $ 4.08<br />
0.3% 0.0% 28.1% 11.5% 14.8% (13.3%) 1.4%<br />
Korea South 706 284 $ 2.48 0.2% 0.0% 782 316 $ 2.47<br />
0.2% 0.0% 10.7% 11.3% (0.5%) (13.5%) 1.2%<br />
Georgia 74 33 $ 2.28 0.0% 0.0% 475 112 $ 4.26<br />
0.1% 0.0% 538.5% 242.4% 86.5% 166.1% 211.2%<br />
Austria 144 29 $ 5.05 0.0% 0.0% 392 57 $ 6.85<br />
0.0% 0.0% 171.4% 99.9% 35.8% 55.4% 81.7%<br />
Romania 94 56 $ 1.66 0.0% 0.0% 339 157 $ 2.16<br />
0.1% 0.0% 261.5% 177.2% 30.4% 115.5% 152.0%<br />
Hungary 315 83 $ 3.80 0.1% 0.0% 277 149 $ 1.86<br />
0.1% 0.0% (12.2%) 79.8% (51.2%) 39.7% 63.4%<br />
Bulgaria 241 139 $ 1.73 0.1% 0.0% 251 105 $ 2.39<br />
0.1% 0.0% 4.3% (24.5%) 38.1% (41.3%) (31.3%)<br />
Moldova 182 80 $ 2.28 0.1% 0.0% 191 120 $ 1.60<br />
0.1% 0.0% 4.9% 50.1% (30.1%) 16.7% 36.4%<br />
LISTED COUNTRY IMPORTS 140,715 116,171 $ 1.21 99.8% 7.3% 260,472 149,461 $ 1.74 99.8% 8.5% 85.1% 28.7% 43.9% 0.0% 17.0%<br />
OTHER COUNTRY IMPORTS 437 191 $ 2.29 0.2% 0.0% 751 241 $ 3.12<br />
0.2% 0.0% 71.6% 26.1% 36.0% (1.9%) 14.7%<br />
TOTAL IMPORTS (3) 141,152 116,362 $ 1.21 100.0% 7.3% 261,222 149,702 $ 1.74 100.0% 8.5% 85.1% 28.7% 43.8% 0.0% 17.0%<br />
DOMESTIC WINE 1,483,638 92.7% 1,610,298 91.5% 8.5% (1.3%)<br />
TOTAL MARKET (4) 1,600,000 100.0% 1,760,000 100.0% 10.0% 0.0%<br />
(1) Ranked by Value in 2007<br />
(2) Based on volume. "0.0%"Indicates less than 0.1%.<br />
(3) Some imported wines may be transshipped to other countries in which case the import market and the total market may be overstated.<br />
(4) Total wine market estimated at 1.6 billion liters in 2006 and 1.76 billion liters in 2007.<br />
See Appendices 1 & 2<br />
Source: Global Trade Information Service. Copyright: Trade Data and Analysis<br />
Table 13<br />
Page 13
COUNTRY WINE MARKET ANALYSIS - IMPORTS<br />
IRELAND<br />
2006, 2007 AND 2007/ 2006<br />
TABLE WINE, SPARKLING WINE DESSERT WINE, VERMOUTH AND OTHER SPECIAL NATURAL WINE<br />
VALUE ($US 000), VOLUME (LITERS 000) AND VALUE/LITER ($)<br />
HTS CODES 2204/2205/2206 COMBINED<br />
DOMESTIC WINE CONSUMPTION AND TOTAL WINE MARKET<br />
2006 2007 2007/2006 (% CHANGE)<br />
MARKET MARKET SHARE (%) (2) MARKET MARKET SHARE (%) (2)<br />
MARKET MARKET SHARE (%) (2)<br />
VALUE VOLUME VALUE/ IMPORT TOTAL VALUE VOLUME VALUE/ IMPORT TOTAL VALUE VOLUME VALUE/ IMPORT TOTAL<br />
COUNTRY (1) ($US 000) LITERS (000) LITER ($) MARKET MARKET ($US 000) LITERS (000) LITER ($) MARKET MARKET ($US 000) LITERS (000) LITER ($) MARKET MARKET<br />
United Kingdom 99,387 28,245 $ 3.52 32.9% 32.1% 105,505 26,873 $ 3.93 30.6% 29.9% 6.2% (4.9%) 11.6% (7.0%) (7.0%)<br />
France 61,623 10,411 $ 5.92 12.1% 11.8% 81,188 11,709 $ 6.93 13.3% 13.0% 31.7% 12.5% 17.1% 9.9% 10.0%<br />
Australia 55,630 12,700 $ 4.38 14.8% 14.4% 67,485 14,427 $ 4.68 16.4% 16.0% 21.3% 13.6% 6.8% 11.0% 11.1%<br />
Chile 40,609 11,307 $ 3.59 13.2% 12.8% 44,435 11,286 $ 3.94 12.9% 12.5% 9.4% (0.2%) 9.6% (2.5%) (2.4%)<br />
Spain 13,912 3,384 $ 4.11 3.9% 3.8% 20,986 3,907 $ 5.37<br />
4.4% 4.3% 50.9% 15.5% 30.7% 12.8% 12.9%<br />
Italy 13,683 3,450 $ 3.97 4.0% 3.9% 18,729 3,738 $ 5.01<br />
4.3% 4.2% 36.9% 8.4% 26.3% 5.9% 6.0%<br />
South Africa 17,596 4,904 $ 3.59 5.7% 5.6% 16,983 4,376 $ 3.88<br />
5.0% 4.9% (3.5%) (10.8%) 8.1% (12.8%) (12.7%)<br />
Germany 10,732 4,633 $ 2.32 5.4% 5.3% 13,947 4,796 $ 2.91<br />
5.5% 5.3% 30.0% 3.5% 25.6% 1.1% 1.2%<br />
United States 9,684 3,131 $ 3.09 3.6% 3.6% 10,018 2,948 $ 3.40<br />
3.4% 3.3% 3.4% (5.9%) 9.9% (8.0%) (7.9%)<br />
New Zealand 6,787 859 $ 7.90 1.0% 1.0% 9,305 1,176 $ 7.91<br />
1.3% 1.3% 37.1% 37.0% 0.1% 33.8% 33.9%<br />
Portugal 3,851 531 $ 7.25 0.6% 0.6% 4,388 443 $ 9.92<br />
0.5% 0.5% 13.9% (16.7%) 36.7% (18.6%) (18.5%)<br />
Argentina 3,396 753 $ 4.51 0.9% 0.9% 3,891 1,255 $ 3.10<br />
1.4% 1.4% 14.6% 66.6% (31.2%) 62.8% 62.9%<br />
Netherlands 803 241 $ 3.33 0.3% 0.3% 3,194 558 $ 5.72<br />
0.6% 0.6% 297.6% 131.4% 71.8% 126.1% 126.3%<br />
Poland 159 49 $ 3.22 0.1% 0.1% 301 67 $ 4.50<br />
0.1% 0.1% 89.2% 35.4% 39.8% 32.3% 32.4%<br />
Sweden 1,459 1,073 $ 1.36 1.3% 1.2% 158 74 $ 2.14<br />
0.1% 0.1% (89.1%) (93.1%) 57.3% (93.3%) (93.2%)<br />
Austria 98 13 $ 7.43 0.0% 0.0% 94 8 $ 11.50<br />
0.0% 0.0% (4.3%) (38.2%) 54.8% (39.6%) (39.5%)<br />
Moldova 73 28 $ 2.56 0.0% 0.0% 92 33 $ 2.79<br />
0.0% 0.0% 26.5% 16.0% 9.1% 13.3% 13.4%<br />
Georgia 5 1 $ 6.36 0.0% 0.0% 82 14 $ 5.69<br />
0.0% 0.0% 1478.1% 1663.7% (10.5%) 1623.3% 1624.5%<br />
Lithuania 42 14 $ 2.97 0.0% 0.0% 77 15 $ 4.97<br />
0.0% 0.0% 81.6% 8.6% 67.2% 6.1% 6.2%<br />
LISTED COUNTRY IMPORTS 339,529 85,728 $ 3.96 99.9% 97.4% 400,856 87,704 $ 4.57 99.9% 97.4% 18.1% 2.3% 15.4% (0.0%) 0.0%<br />
OTHER COUNTRY IMPORTS 475 75 $ 6.31 0.1% 0.1% 470 113 $ 4.15<br />
0.1% 0.1% (1.1%) 50.6% (34.3%) 47.2% 47.3%<br />
TOTAL IMPORTS (3) 340,004 85,803 $ 3.96 100.0% 97.5% 401,326 87,818 $ 4.57 100.0% 97.6% 18.0% 2.3% 15.3% 0.0% 0.1%<br />
DOMESTIC WINE 2,197 2.5% 2,182 2.4% (0.7%) (2.9%)<br />
TOTAL MARKET (4) 88,000 100.0% 90,000 100.0% 2.3% 0.0%<br />
(1) Ranked by Value in 2007<br />
(2) Based on volume. "0.0%"Indicates less than 0.1%.<br />
(3) Some imported wines may be transshipped to other countries in which case the import market and the total market may be overstated.<br />
(4) Total wine market estimated at 88 million liters in 2006 and 90 million liters in 2007.<br />
See Appendices 1 & 2<br />
See Appendices 1 & 2<br />
Source: Global Trade Information Service. Copyright: Trade Data and Analysis<br />
Table 14<br />
Page 14
COUNTRY WINE MARKET ANALYSIS - IMPORTS<br />
HONG KONG<br />
2006, 2007 AND 2007/ 2006<br />
TABLE WINE, SPARKLING WINE DESSERT WINE, VERMOUTH AND OTHER SPECIAL NATURAL WINE<br />
VALUE ($US 000), VOLUME (LITERS 000) AND VALUE/LITER ($)<br />
HTS CODES 2204/2205/2206 COMBINED<br />
DOMESTIC WINE CONSUMPTION AND TOTAL WINE MARKET<br />
2006 2007 2007/2006 (% CHANGE)<br />
MARKET MARKET SHARE (%) (2) MARKET MARKET SHARE (%) (2)<br />
MARKET MARKET SHARE (%) (2)<br />
VALUE VOLUME VALUE/ IMPORT TOTAL VALUE VOLUME VALUE/ IMPORT TOTAL VALUE VOLUME VALUE/ IMPORT TOTAL<br />
COUNTRY (1) ($US 000) LITERS (000) LITER ($) MARKET MARKET ($US 000) LITERS (000) LITER ($) MARKET MARKET ($US 000) LITERS (000) LITER ($) MARKET MARKET<br />
France 56,119 5,811 $ 9.66 27.2% 26.4% 116,516 7,295 $ 15.97 27.4% 27.0% 107.6% 25.5% 65.4% 0.8% 2.3%<br />
Australia 16,632 3,626 $ 4.59 17.0% 16.5% 25,679 5,016 $ 5.12 18.8% 18.6% 54.4% 38.3% 11.6% 11.1% 12.7%<br />
United Kingdom 5,133 496 $ 10.36 2.3% 2.3% 15,984 659 $ 24.26<br />
2.5% 2.4% 211.4% 33.0% 134.2% 6.7% 8.3%<br />
United States 7,204 3,170 $ 2.27 14.8% 14.4% 9,005 3,651 $ 2.47 13.7% 13.5% 25.0% 15.2% 8.5% (7.5%) (6.2%)<br />
Chile 6,591 2,178 $ 3.03 10.2% 9.9% 8,740 2,675 $ 3.27 10.1% 9.9% 32.6% 22.9% 7.9% (1.4%) 0.1%<br />
Italy 5,381 779 $ 6.91 3.6% 3.5% 8,012 1,085 $ 7.39<br />
4.1% 4.0% 48.9% 39.3% 6.9% 11.8% 13.5%<br />
Japan 5,502 1,026 $ 5.36 4.8% 4.7% 6,377 1,089 $ 5.86<br />
4.1% 4.0% 15.9% 6.1% 9.2% (14.8%) (13.5%)<br />
Netherlands 282 19 $ 15.08 0.1% 0.1% 4,820 57 $ 84.67<br />
0.2% 0.2% 1607.9% 204.2% 461.4% 144.2% 147.9%<br />
New Zealand 2,484 379 $ 6.55 1.8% 1.7% 3,716 488 $ 7.61<br />
1.8% 1.8% 49.6% 28.7% 16.2% 3.3% 4.9%<br />
Spain 2,173 1,172 $ 1.85 5.5% 5.3% 3,246 1,380 $ 2.35<br />
5.2% 5.1% 49.4% 17.7% 26.9% (5.5%) (4.1%)<br />
China 2,149 1,325 $ 1.62 6.2% 6.0% 2,104 1,344 $ 1.56<br />
5.1% 5.0% (2.1%) 1.5% (3.6%) (18.5%) (17.3%)<br />
Argentina 1,184 401 $ 2.95 1.9% 1.8% 2,082 672 $ 3.10<br />
2.5% 2.5% 75.9% 67.6% 5.0% 34.5% 36.5%<br />
Switzerland 336 8 $ 43.78 0.0% 0.0% 1,646 32 $ 51.08<br />
0.1% 0.1% 390.7% 320.6% 16.7% 237.7% 242.7%<br />
Germany 885 154 $ 5.76 0.7% 0.7% 1,572 229 $ 6.88<br />
0.9% 0.8% 77.5% 48.7% 19.4% 19.4% 21.2%<br />
South Africa 947 283 $ 3.35 1.3% 1.3% 1,560 383 $ 4.08<br />
1.4% 1.4% 64.9% 35.3% 21.9% 8.6% 10.2%<br />
Portugal 800 97 $ 8.24 0.5% 0.4% 1,038 112 $ 9.30<br />
0.4% 0.4% 29.9% 15.1% 12.8% (7.6%) (6.2%)<br />
Canada 511 14 $ 37.17 0.1% 0.1% 590 14 $ 42.89<br />
0.1% 0.1% 15.5% 0.1% 15.4% (19.7%) (18.5%)<br />
Singapore 206 29 $ 7.19 0.1% 0.1% 309 24 $ 12.80<br />
0.1% 0.1% 50.1% (15.8%) 78.2% (32.4%) (31.4%)<br />
Bulgaria 216 118 $ 1.82 0.6% 0.5% 216 105 $ 2.05<br />
0.4% 0.4% 0.2% (11.1%) 12.7% (28.7%) (27.6%)<br />
Korea South 200 100 $ 1.99 0.5% 0.5% 178 80 $ 2.22<br />
0.3% 0.3% (10.8%) (19.9%) 11.3% (35.7%) (34.7%)<br />
LISTED COUNTRY IMPORTS 114,935 21,183 $ 5.43 99.1% 96.3% 213,392 26,389 $ 8.09 99.2% 97.7% 85.7% 24.6% 49.0% 0.0% 1.5%<br />
OTHER COUNTRY IMPORTS 808 182 $ 4.44 0.9% 0.8% 812 222 $ 3.66<br />
0.8% 0.8% 0.5% 22.0% (17.6%) (2.1%) (0.6%)<br />
TOTAL IMPORTS (3) 115,744 21,365 $ 5.42 100.0% 97.1% 214,204 26,611 $ 8.05 100.0% 98.6% 85.1% 24.6% 48.6% 0.0% 1.5%<br />
DOMESTIC WINE 24 2.9% 389 1.4% 1521.7%<br />
TOTAL MARKET (4) 22,000 100.0% 27,000 100.0% 22.7% 0.0%<br />
(1) Ranked by Value in 2007<br />
(2) Based on volume. "0.0%"Indicates less than 0.1%.<br />
(3) Some imported wines may be transshipped to other countries in which case the import market and the total market may be overstated.<br />
(4) Total wine market estimated at 22 million liters in 2006 and 27 million liters in 2007.<br />
See Appendices 1 & 2<br />
Source: Global Trade Information Service. Copyright: Trade Data and Analysis<br />
Table 15<br />
Page 15
COUNTRY WINE MARKET ANALYSIS - IMPORTS<br />
TAIWAN<br />
2006, 2007 AND 2007/ 2006<br />
TABLE WINE, SPARKLING WINE DESSERT WINE, VERMOUTH AND OTHER SPECIAL NATURAL WINE<br />
VALUE ($US 000), VOLUME (LITERS 000) AND VALUE/LITER ($)<br />
HTS CODES 2204/2205/2206 COMBINED<br />
DOMESTIC WINE CONSUMPTION AND TOTAL WINE MARKET<br />
2006 2007 2007/2006 (% CHANGE)<br />
MARKET MARKET SHARE (%) (2) MARKET MARKET SHARE (%) (2)<br />
MARKET MARKET SHARE (%) (2)<br />
VALUE VOLUME VALUE/ IMPORT TOTAL VALUE VOLUME VALUE/ IMPORT TOTAL VALUE VOLUME VALUE/ IMPORT TOTAL<br />
COUNTRY (1) ($US 000) LITERS (000) LITER ($) MARKET MARKET ($US 000) LITERS (000) LITER ($) MARKET MARKET ($US 000) LITERS (000) LITER ($) MARKET MARKET<br />
France 40,981 8,865 $ 4.62 46.4% 35.5% 52,146 9,226 $ 5.65 43.5% 34.2% 27.2% 4.1% 22.3% (6.3%) (3.6%)<br />
Australia 8,205 1,619 $ 5.07 8.5% 6.5% 9,805 1,970 $ 4.98<br />
9.3% 7.3% 19.5% 21.7% (1.8%) 9.6% 12.7%<br />
United States 7,537 2,093 $ 3.60 11.0% 8.4% 8,316 2,014 $ 4.13<br />
9.5% 7.5% 10.3% (3.8%) 14.7% (13.3%) (10.9%)<br />
Chile 5,374 1,240 $ 4.33 6.5% 5.0% 6,628 2,073 $ 3.20<br />
9.8% 7.7% 23.3% 67.2% (26.2%) 50.6% 54.8%<br />
Japan 6,180 2,128 $ 2.90 11.1% 8.5% 6,040 2,053 $ 2.94<br />
9.7% 7.6% (2.3%) (3.5%) 1.3% (13.1%) (10.7%)<br />
Italy 3,062 528 $ 5.80 2.8% 2.1% 4,779 961 $ 4.97<br />
4.5% 3.6% 56.1% 81.8% (14.2%) 63.8% 68.4%<br />
Spain 2,784 1,218 $ 2.29 6.4% 4.9% 3,059 1,288 $ 2.38<br />
6.1% 4.8% 9.9% 5.7% 3.9% (4.8%) (2.1%)<br />
Argentina 1,665 506 $ 3.29 2.6% 2.0% 2,286 618 $ 3.70<br />
2.9% 2.3% 37.3% 22.2% 12.4% 10.1% 13.2%<br />
Germany 1,035 148 $ 7.00 0.8% 0.6% 1,390 187 $ 7.43<br />
0.9% 0.7% 34.3% 26.5% 6.2% 14.0% 17.2%<br />
South Africa 902 212 $ 4.24 1.1% 0.8% 1,221 272 $ 4.48<br />
1.3% 1.0% 35.4% 28.2% 5.6% 15.5% 18.7%<br />
Hungary 69 10 $ 6.56 0.1% 0.0% 924 28 $ 33.35<br />
0.1% 0.1% 1241.8% 164.1% 408.1% 137.8% 144.5%<br />
Canada 1,051 185 $ 5.69 1.0% 0.7% 850 203 $ 4.18<br />
1.0% 0.8% (19.1%) 10.1% (26.6%) (0.8%) 2.0%<br />
Austria 490 42 $ 11.57 0.2% 0.2% 397 24 $ 16.33<br />
0.1% 0.1% (18.8%) (42.5%) 41.1% (48.2%) (46.7%)<br />
New Zealand 194 12 $ 16.15 0.1% 0.0% 301 27 $ 11.24<br />
0.1% 0.1% 55.3% 123.1% (30.4%) 101.0% 106.6%<br />
Portugal 133 13 $ 9.95 0.1% 0.1% 194 20 $ 9.85<br />
0.1% 0.1% 45.8% 47.2% (0.9%) 32.6% 36.3%<br />
Thailand 155 122 $ 1.27 0.6% 0.5% 158 108 $ 1.47<br />
0.5% 0.4% 1.9% (11.8%) 15.6% (20.6%) (18.3%)<br />
Belgium 141 86 $ 1.64 0.4% 0.3% 136 79 $ 1.73<br />
0.4% 0.3% (3.1%) (7.8%) 5.1% (16.9%) (14.6%)<br />
United Kingdom 305 28 $ 10.86 0.1% 0.1% 107 20 $ 5.26<br />
0.1% 0.1% (65.0%) (27.7%) (51.6%) (34.9%) (33.0%)<br />
Korea South 69 14 $ 4.95 0.1% 0.1% 65 13 $ 4.95<br />
0.1% 0.0% (5.9%) (5.9%) (0.0%) (15.3%) (12.9%)<br />
Romania 28 8 $ 3.68 0.0% 0.0% 55 13 $ 4.28<br />
0.1% 0.0% 93.4% 66.4% 16.3% 49.8% 54.0%<br />
LISTED COUNTRY IMPORTS 80,359 19,079 $ 4.21 99.8% 76.3% 98,858 21,197 $ 4.66 99.9% 78.5% 23.0% 11.1% 10.7% 0.1% 2.9%<br />
OTHER COUNTRY IMPORTS 115 37 $ 3.13 0.2% 0.1% 120 26 $ 4.64<br />
0.1% 0.1% 5.0% (29.2%) 48.4% (36.3%) (34.5%)<br />
TOTAL IMPORTS (3) 80,474 19,115 $ 4.21 100.0% 76.5% 98,978 21,223 $ 4.66 100.0% 78.6% 23.0% 11.0% 10.8% 0.0% 2.8%<br />
DOMESTIC WINE 5,885 23.5% 5,777 21.4% (1.8%) (9.1%)<br />
TOTAL MARKET (4) 25,000 100.0% 27,000 100.0% 8.0% 0.0%<br />
(1) Ranked by Value in 2007<br />
(2) Based on volume. "0.0%"Indicates less than 0.1%.<br />
(3) Some imported wines may be transshipped to other countries in which case the import market and the total market may be overstated.<br />
(4) Total wine market estimated at 25 million liters in 2006 and 27 million liters in 2007.<br />
See Appendices 1 & 2<br />
Source: Global Trade Information Service. Copyright: Trade Data and Analysis<br />
Table 16<br />
Page 16
COUNTRY WINE MARKET ANALYSIS - IMPORTS<br />
SINGAPORE<br />
2006, 2007 AND 2007/ 2006<br />
TABLE WINE, SPARKLING WINE DESSERT WINE, VERMOUTH AND OTHER SPECIAL NATURAL WINE<br />
VALUE ($US 000), VOLUME (LITERS 000) AND VALUE/LITER ($)<br />
HTS CODES 2204/2205/2206 COMBINED<br />
DOMESTIC WINE CONSUMPTION AND TOTAL WINE MARKET<br />
2006 2007 2007/2006 (% CHANGE)<br />
MARKET MARKET SHARE (%) (2) MARKET MARKET SHARE (%) (2)<br />
MARKET MARKET SHARE (%) (2)<br />
VALUE VOLUME VALUE/ IMPORT TOTAL VALUE VOLUME VALUE/ IMPORT TOTAL VALUE VOLUME VALUE/ IMPORT TOTAL<br />
COUNTRY (1) ($US 000) LITERS (000) LITER ($) MARKET MARKET ($US 000) LITERS (000) LITER ($) MARKET MARKET ($US 000) LITERS (000) LITER ($) MARKET MARKET<br />
France 241,550 9,179 $ 26.31 44.9% 43.7% 303,525 11,113 $ 27.31 45.5% 44.5% 25.7% 21.1% 3.8% 1.3% 1.7%<br />
Australia 36,347 5,367 $ 6.77 26.3% 25.6% 44,258 6,483 $ 6.83 26.6% 25.9% 21.8% 20.8% 0.8% 1.1% 1.5%<br />
United Kingdom 3,556 179 $ 19.88 0.9% 0.9% 11,019 246 $ 44.78<br />
1.0% 1.0% 209.9% 37.6% 125.3% 15.2% 15.6%<br />
Italy 8,004 1,040 $ 7.70 5.1% 5.0% 9,715 981 $ 9.91<br />
4.0% 3.9% 21.4% (5.7%) 28.7% (21.0%) (20.8%)<br />
United States 5,419 1,093 $ 4.96 5.3% 5.2% 8,145 1,256 $ 6.48<br />
5.1% 5.0% 50.3% 14.9% 30.8% (3.8%) (3.5%)<br />
New Zealand 3,936 442 $ 8.91 2.2% 2.1% 5,274 520 $ 10.15<br />
2.1% 2.1% 34.0% 17.6% 14.0% (1.6%) (1.2%)<br />
Chile 4,024 1,131 $ 3.56 5.5% 5.4% 4,189 1,209 $ 3.47<br />
5.0% 4.8% 4.1% 6.9% (2.6%) (10.5%) (10.2%)<br />
Germany 1,769 349 $ 5.06 1.7% 1.7% 2,515 372 $ 6.76<br />
1.5% 1.5% 42.2% 6.4% 33.6% (10.9%) (10.6%)<br />
Switzerland 652 7 $ 97.86 0.0% 0.0% 2,339 13 $ 173.69<br />
0.1% 0.1% 258.5% 102.0% 77.5% 69.1% 69.7%<br />
Japan 1,586 233 $ 6.80 1.1% 1.1% 2,247 310 $ 7.24<br />
1.3% 1.2% 41.6% 33.0% 6.5% 11.4% 11.7%<br />
Spain 1,571 239 $ 6.56 1.2% 1.1% 2,039 373 $ 5.47<br />
1.5% 1.5% 29.8% 55.9% (16.7%) 30.5% 30.9%<br />
Argentina 1,562 395 $ 3.95 1.9% 1.9% 1,863 469 $ 3.98<br />
1.9% 1.9% 19.3% 18.7% 0.6% (0.7%) (0.3%)<br />
South Africa 1,441 303 $ 4.76 1.5% 1.4% 1,777 373 $ 4.76<br />
1.5% 1.5% 23.3% 23.3% 0.0% 3.2% 3.6%<br />
Portugal 962 144 $ 6.69 0.7% 0.7% 1,260 153 $ 8.23<br />
0.6% 0.6% 31.0% 6.4% 23.0% (10.9%) (10.6%)<br />
Canada 985 23 $ 42.71 0.1% 0.1% 1,188 36 $ 33.27<br />
0.1% 0.1% 20.6% 54.8% (22.1%) 29.5% 30.0%<br />
Korea South 107 49 $ 2.18 0.2% 0.2% 300 183 $ 1.63<br />
0.8% 0.7% 180.7% 273.5% (24.9%) 212.7% 213.8%<br />
China 226 83 $ 2.74 0.4% 0.4% 233 143 $ 1.62<br />
0.6% 0.6% 2.8% 73.5% (40.7%) 45.2% 45.8%<br />
Netherlands 149 33 $ 4.45 0.2% 0.2% 207 28 $ 7.54<br />
0.1% 0.1% 39.2% (17.8%) 69.3% (31.2%) (31.0%)<br />
Malaysia 137 14 $ 9.85 0.1% 0.1% 171 17 $ 10.08<br />
0.1% 0.1% 24.6% 21.9% 2.2% 2.0% 2.4%<br />
Belgium 180 6 $ 32.04 0.0% 0.0% 166 18 $ 9.17<br />
0.1% 0.1% (8.1%) 221.1% (71.4%) 168.8% 169.7%<br />
LISTED COUNTRY IMPORTS 314,163 20,308 $ 15.47 99.4% 96.7% 402,428 24,296 $ 16.56 99.5% 97.2% 28.1% 19.6% 7.1% 0.1% 0.5%<br />
OTHER COUNTRY IMPORTS 406 126 $ 3.21 0.6% 0.6% 527 116 $ 4.53<br />
0.5% 0.5% 29.8% (8.0%) 41.1% (23.0%) (22.7%)<br />
TOTAL IMPORTS (3) 314,569 20,434 $ 15.39 100.0% 97.3% 402,955 24,412 $ 16.51 100.0% 97.6% 28.1% 19.5% 7.2% 0.0% 0.4%<br />
DOMESTIC WINE 566 2.7% 588 2.4% 3.9% (12.7%)<br />
TOTAL MARKET (4) 21,000 100.0% 25,000 100.0% 19.0% 0.0%<br />
(1) Ranked by Value in 2007<br />
(2) Based on volume. "0.0%"Indicates less than 0.1%.<br />
(3) Some imported wines may be transshipped to other countries in which case the import market and the total market may be overstated.<br />
(4) Total wine market estimated at 21 million liters in 2006 and 25 million liters in 2007.<br />
See Appendices 1 & 2<br />
Source: Global Trade Information Service. Copyright: Trade Data and Analysis<br />
Table 17<br />
Page 17
COUNTRY WINE MARKET ANALYSIS - IMPORTS<br />
FINLAND<br />
2006, 2007 AND 2007/ 2006<br />
TABLE WINE, SPARKLING WINE DESSERT WINE, VERMOUTH AND OTHER SPECIAL NATURAL WINE<br />
VALUE ($US 000), VOLUME (LITERS 000) AND VALUE/LITER ($)<br />
HTS CODES 2204/2205/2206 COMBINED<br />
DOMESTIC WINE CONSUMPTION AND TOTAL WINE MARKET<br />
2006 2007 2007/2006 (% CHANGE)<br />
MARKET MARKET SHARE (%) (2) MARKET MARKET SHARE (%) (2)<br />
MARKET MARKET SHARE (%) (2)<br />
VALUE VOLUME VALUE/ IMPORT TOTAL VALUE VOLUME VALUE/ IMPORT TOTAL VALUE VOLUME VALUE/ IMPORT TOTAL<br />
COUNTRY (1) ($US 000) LITERS (000) LITER ($) MARKET MARKET ($US 000) LITERS (000) LITER ($) MARKET MARKET ($US 000) LITERS (000) LITER ($) MARKET MARKET<br />
France 35,971 8,894 $ 4.04 11.8% 11.7% 42,745 10,377 $ 4.12 12.3% 12.2% 18.8% 16.7% 1.9% 3.7% 4.3%<br />
Chile 25,299 9,655 $ 2.62 12.8% 12.7% 35,050 12,110 $ 2.89 14.3% 14.2% 38.5% 25.4% 10.5% 11.5% 12.1%<br />
Spain 25,392 8,129 $ 3.12 10.8% 10.7% 26,340 7,741 $ 3.40<br />
9.1% 9.1% 3.7% (4.8%) 8.9% (15.4%) (14.9%)<br />
Italy 19,841 5,557 $ 3.57 7.4% 7.3% 23,973 6,105 $ 3.93<br />
7.2% 7.2% 20.8% 9.9% 10.0% (2.4%) (1.8%)<br />
Sweden 15,974 16,624 $ 0.96 22.1% 21.9% 17,595 16,690 $ 1.05 19.7% 19.6% 10.1% 0.4% 9.7% (10.8%) (10.2%)<br />
Australia 11,534 3,168 $ 3.64 4.2% 4.2% 16,822 4,741 $ 3.55<br />
5.6% 5.6% 45.9% 49.7% (2.5%) 33.0% 33.8%<br />
Germany 11,161 4,293 $ 2.60 5.7% 5.6% 13,689 5,181 $ 2.64<br />
6.1% 6.1% 22.7% 20.7% 1.6% 7.3% 7.9%<br />
United Kingdom 8,276 3,731 $ 2.22 5.0% 4.9% 11,743 4,516 $ 2.60<br />
5.3% 5.3% 41.9% 21.1% 17.2% 7.6% 8.2%<br />
South Africa 9,482 3,736 $ 2.54 5.0% 4.9% 11,061 4,125 $ 2.68<br />
4.9% 4.9% 16.6% 10.4% 5.6% (1.9%) (1.3%)<br />
Argentina 7,665 3,233 $ 2.37 4.3% 4.3% 8,897 3,836 $ 2.32<br />
4.5% 4.5% 16.1% 18.7% (2.2%) 5.5% 6.1%<br />
Denmark 7,220 1,523 $ 4.74 2.0% 2.0% 8,349 1,720 $ 4.85<br />
2.0% 2.0% 15.6% 12.9% 2.4% 0.3% 1.0%<br />
United States 4,086 1,757 $ 2.33 2.3% 2.3% 4,857 1,946 $ 2.50<br />
2.3% 2.3% 18.9% 10.8% 7.3% (1.6%) (1.0%)<br />
Portugal 3,155 627 $ 5.03 0.8% 0.8% 3,604 644 $ 5.60<br />
0.8% 0.8% 14.3% 2.7% 11.2% (8.7%) (8.2%)<br />
Hungary 1,958 1,808 $ 1.08 2.4% 2.4% 2,203 1,870 $ 1.18<br />
2.2% 2.2% 12.5% 3.4% 8.8% (8.1%) (7.6%)<br />
Estonia 951 216 $ 4.40 0.3% 0.3% 2,162 470 $ 4.60<br />
0.6% 0.6% 127.2% 117.3% 4.5% 93.1% 94.3%<br />
Belgium 779 391 $ 1.99 0.5% 0.5% 1,224 594 $ 2.06<br />
0.7% 0.7% 57.0% 52.0% 3.3% 35.1% 35.9%<br />
New Zealand 807 110 $ 7.36 0.1% 0.1% 1,222 139 $ 8.81<br />
0.2% 0.2% 51.4% 26.5% 19.7% 12.4% 13.1%<br />
Luxembourg 757 117 $ 6.49 0.2% 0.2% 1,093 149 $ 7.34<br />
0.2% 0.2% 44.5% 27.8% 13.0% 13.6% 14.3%<br />
Ireland 320 125 $ 2.57 0.2% 0.2% 801 344 $ 2.33<br />
0.4% 0.4% 150.0% 175.9% (9.4%) 145.2% 146.7%<br />
Norway 290 96 $ 3.03 0.1% 0.1% 787 358 $ 2.20<br />
0.4% 0.4% 171.8% 275.0% (27.5%) 233.2% 235.3%<br />
LISTED COUNTRY IMPORTS 190,920 73,788 $ 2.59 98.1% 97.1% 234,218 83,658 $ 2.80 98.8% 98.4% 22.7% 13.4% 8.2% 0.7% 1.4%<br />
OTHER COUNTRY IMPORTS 3,005 1,435 $ 2.09 1.9% 1.9% 2,843 993 $ 2.86<br />
1.2% 1.2% (5.4%) (30.8%) 36.7% (38.5%) (38.1%)<br />
TOTAL IMPORTS (3) 193,926 75,222 $ 2.58 100.0% 99.0% 237,061 84,651 $ 2.80 100.0% 99.6% 22.2% 12.5% 8.6% 0.0% 0.6%<br />
DOMESTIC WINE 778 1.0% 349 0.4% (55.1%) (59.9%)<br />
TOTAL MARKET (4) 76,000 100.0% 85,000 100.0% 11.8% 0.0%<br />
(1) Ranked by Value in 2007<br />
(2) Based on volume. "0.0%"Indicates less than 0.1%.<br />
(3) Some imported wines may be transshipped to other countries in which case the import market and the total market may be overstated.<br />
(4) Total wine market estimated at 76 million liters in 2006 and 85 million liters in 2007.<br />
See Appendices 1 & 2<br />
Source: Global Trade Information Service. Copyright: Trade Data and Analysis<br />
Table 18<br />
Page 18
COUNTRY WINE MARKET ANALYSIS - IMPORTS<br />
RUSSIA<br />
2006, 2007 AND 2007/ 2006<br />
TABLE WINE, SPARKLING WINE DESSERT WINE, VERMOUTH AND OTHER SPECIAL NATURAL WINE<br />
VALUE ($US 000), VOLUME (LITERS 000) AND VALUE/LITER ($)<br />
HTS CODES 2204/2205/2206 COMBINED<br />
DOMESTIC WINE CONSUMPTION AND TOTAL WINE MARKET<br />
2006 2007 2007/2006 (% CHANGE)<br />
MARKET MARKET SHARE (%) (2) MARKET MARKET SHARE (%) (2)<br />
MARKET MARKET SHARE (%) (2)<br />
VALUE VOLUME VALUE/ IMPORT TOTAL VALUE VOLUME VALUE/ IMPORT TOTAL VALUE VOLUME VALUE/ IMPORT TOTAL<br />
COUNTRY (1) ($US 000) LITERS (000) LITER ($) MARKET MARKET ($US 000) LITERS (000) LITER ($) MARKET MARKET ($US 000) LITERS (000) LITER ($) MARKET MARKET<br />
Italy 132,146 38,192 $ 3.46 6.6% 3.4% 251,437 62,874 $ 4.00<br />
9.2% 4.8% 90.3% 64.6% 15.6% 38.8% 40.8%<br />
France 118,147 96,558 $ 1.22 16.7% 8.6% 189,626 90,647 $ 2.09 13.2% 6.9% 60.5% (6.1%) 71.0% (20.9%) (19.7%)<br />
Spain 95,086 156,245 $ 0.61 27.0% 14.0% 124,329 176,929 $ 0.70 25.8% 13.5% 30.8% 13.2% 15.5% (4.5%) (3.2%)<br />
Bulgaria 54,486 70,167 $ 0.78 12.1% 6.3% 79,958 80,794 $ 0.99 11.8% 6.2% 46.7% 15.1% 27.4% (2.9%) (1.6%)<br />
Argentina 34,645 58,412 $ 0.59 10.1% 5.2% 63,692 102,009 $ 0.62 14.9% 7.8% 83.8% 74.6% 5.3% 47.2% 49.3%<br />
Chile 25,503 19,086 $ 1.34 3.3% 1.7% 44,578 28,534 $ 1.56<br />
4.2% 2.2% 74.8% 49.5% 16.9% 26.0% 27.8%<br />
Germany 30,483 19,345 $ 1.58 3.3% 1.7% 39,156 23,105 $ 1.69<br />
3.4% 1.8% 28.5% 19.4% 7.5% 0.7% 2.1%<br />
Ukraine 25,385 12,476 $ 2.03 2.2% 1.1% 34,702 13,834 $ 2.51<br />
2.0% 1.1% 36.7% 10.9% 23.3% (6.5%) (5.2%)<br />
Portugal 1,805 448 $ 4.03 0.1% 0.0% 12,305 22,364 $ 0.55<br />
3.3% 1.7% 581.7% 4894.1% (86.3%) 4110.0% 4169.8%<br />
Uzbekistan 8,110 17,082 $ 0.47 3.0% 1.5% 11,204 20,541 $ 0.55<br />
3.0% 1.6% 38.1% 20.2% 14.9% 1.4% 2.8%<br />
Hungary 7,133 6,497 $ 1.10 1.1% 0.6% 10,328 7,385 $ 1.40<br />
1.1% 0.6% 44.8% 13.7% 27.4% (4.2%) (2.8%)<br />
South Africa 4,109 1,675 $ 2.45 0.3% 0.1% 7,932 3,642 $ 2.18<br />
0.5% 0.3% 93.1% 117.4% (11.2%) 83.2% 85.8%<br />
Australia 2,332 1,120 $ 2.08 0.2% 0.1% 5,043 2,065 $ 2.44<br />
0.3% 0.2% 116.2% 84.4% 17.3% 55.4% 57.6%<br />
United States 2,629 1,082 $ 2.43 0.2% 0.1% 4,247 1,843 $ 2.30<br />
0.3% 0.1% 61.6% 70.4% (5.2%) 43.7% 45.7%<br />
Uruguay 701 947 $ 0.74 0.2% 0.1% 3,846 6,738 $ 0.57<br />
1.0% 0.5% 448.6% 611.6% (22.9%) 499.9% 508.4%<br />
Macedonia 2,622 4,534 $ 0.58 0.8% 0.4% 3,443 4,905 $ 0.70<br />
0.7% 0.4% 31.3% 8.2% 21.4% (8.8%) (7.5%)<br />
Romania 3,105 2,124 $ 1.46 0.4% 0.2% 3,118 1,990 $ 1.57<br />
0.3% 0.2% 0.4% (6.3%) 7.2% (21.0%) (19.9%)<br />
Armenia 760 328 $ 2.32 0.1% 0.0% 2,544 1,168 $ 2.18<br />
0.2% 0.1% 234.7% 255.9% (5.9%) 200.0% 204.3%<br />
China 1,787 931 $ 1.92 0.2% 0.1% 2,387 1,195 $ 2.00<br />
0.2% 0.1% 33.6% 28.4% 4.1% 8.2% 9.8%<br />
Azerbaijan 1,695 1,653 $ 1.03 0.3% 0.1% 2,142 1,594 $ 1.34<br />
0.2% 0.1% 26.4% (3.6%) 31.0% (18.7%) (17.5%)<br />
LISTED COUNTRY IMPORTS 552,670 508,901 $ 1.09 88.0% 45.4% 896,017 654,157 $ 1.37 95.4% 49.9% 62.1% 28.5% 26.1% 8.4% 9.9%<br />
OTHER COUNTRY IMPORTS 76,057 69,156 $ 1.10 12.0% 6.2% 24,497 31,552 $ 0.78<br />
4.6% 2.4% (67.8%) (54.4%) (29.4%) (61.5%) (61.0%)<br />
TOTAL IMPORTS (3) 628,727 578,058 $ 1.09 100.0% 51.6% 920,514 685,709 $ 1.34 100.0% 52.3% 46.4% 18.6% 23.4% 0.0% 1.4%<br />
DOMESTIC WINE 541,942 48.4% 624,291 47.7% 15.2% (1.5%)<br />
TOTAL MARKET (4) 1,120,000 100.0% 1,310,000 100.0% 17.0% 0.0%<br />
(1) Ranked by Value in 2007<br />
(2) Based on volume. "0.0%"Indicates less than 0.1%.<br />
(3) Some imported wines may be transshipped to other countries in which case the import market and the total market may be overstated.<br />
(4) Total wine market estimated at 1.120 billion liters in 2006 and 1.310 billion liters in 2007.<br />
See Appendices 1 & 2<br />
Source: Global Trade Information Service. Copyright: Trade Data and Analysis<br />
Table 19<br />
Page 19
COUNTRY WINE MARKET ANALYSIS - IMPORTS<br />
NORWAY<br />
2006, 2007 AND 2007/ 2006<br />
TABLE WINE, SPARKLING WINE DESSERT WINE, VERMOUTH AND OTHER SPECIAL NATURAL WINE<br />
VALUE ($US 000), VOLUME (LITERS 000) AND VALUE/LITER ($)<br />
HTS CODES 2204/2205/2206 COMBINED<br />
DOMESTIC WINE CONSUMPTION AND TOTAL WINE MARKET<br />
2006 2007 2007/2006 (% CHANGE)<br />
MARKET MARKET SHARE (%) (2) MARKET MARKET SHARE (%) (2)<br />
MARKET MARKET SHARE (%) (2)<br />
VALUE VOLUME VALUE/ IMPORT TOTAL VALUE VOLUME VALUE/ IMPORT TOTAL VALUE VOLUME VALUE/ IMPORT TOTAL<br />
COUNTRY (1) ($US 000) LITERS (000) LITER ($) MARKET MARKET ($US 000) LITERS (000) LITER ($) MARKET MARKET ($US 000) LITERS (000) LITER ($) MARKET MARKET<br />
France 75,833 16,294 $ 4.65 23.3% 23.3% 97,550 17,252 $ 5.65 22.5% 22.7% 28.6% 5.9% 21.5% (3.4%) (2.5%)<br />
Italy 56,942 12,503 $ 4.55 17.9% 17.9% 76,728 14,733 $ 5.21 19.2% 19.4% 34.7% 17.8% 14.3% 7.5% 8.5%<br />
Spain 36,860 9,513 $ 3.87 13.6% 13.6% 45,079 10,325 $ 4.37 13.5% 13.6% 22.3% 8.5% 12.7% (1.0%) (0.0%)<br />
Germany 18,384 5,930 $ 3.10 8.5% 8.5% 21,838 6,064 $ 3.60<br />
7.9% 8.0% 18.8% 2.3% 16.1% (6.7%) (5.8%)<br />
Australia 14,811 4,149 $ 3.57 5.9% 5.9% 15,698 4,216 $ 3.72<br />
5.5% 5.5% 6.0% 1.6% 4.3% (7.3%) (6.4%)<br />
Portugal 11,298 3,730 $ 3.03 5.3% 5.3% 11,993 3,417 $ 3.51<br />
4.5% 4.5% 6.2% (8.4%) 15.9% (16.5%) (15.6%)<br />
Chile 9,581 3,869 $ 2.48 5.5% 5.5% 11,290 4,237 $ 2.66<br />
5.5% 5.6% 17.8% 9.5% 7.6% (0.1%) 0.9%<br />
United Kingdom 3,598 1,216 $ 2.96 1.7% 1.7% 9,791 2,620 $ 3.74<br />
3.4% 3.4% 172.1% 115.5% 26.2% 96.6% 98.5%<br />
Denmark 6,695 2,546 $ 2.63 3.6% 3.6% 7,573 2,022 $ 3.75<br />
2.6% 2.7% 13.1% (20.6%) 42.5% (27.6%) (26.9%)<br />
Argentina 5,605 2,797 $ 2.00 4.0% 4.0% 6,691 3,129 $ 2.14<br />
4.1% 4.1% 19.4% 11.9% 6.7% 2.0% 3.0%<br />
South Africa 4,548 1,683 $ 2.70 2.4% 2.4% 5,232 1,708 $ 3.06<br />
2.2% 2.2% 15.0% 1.5% 13.3% (7.4%) (6.5%)<br />
Sweden 3,669 2,428 $ 1.51 3.5% 3.5% 4,280 2,898 $ 1.48<br />
3.8% 3.8% 16.6% 19.4% (2.3%) 8.9% 9.9%<br />
United States 2,462 1,030 $ 2.39 1.5% 1.5% 3,685 1,625 $ 2.27<br />
2.1% 2.1% 49.6% 57.8% (5.1%) 43.9% 45.3%<br />
Hungary 3,151 1,341 $ 2.35 1.9% 1.9% 3,261 1,246 $ 2.62<br />
1.6% 1.6% 3.5% (7.1%) 11.4% (15.3%) (14.4%)<br />
Austria 1,107 235 $ 4.71 0.3% 0.3% 2,046 454 $ 4.50<br />
0.6% 0.6% 84.9% 93.6% (4.5%) 76.5% 78.3%<br />
Netherlands 420 251 $ 1.68 0.4% 0.4% 571 267 $ 2.14<br />
0.3% 0.4% 36.0% 6.8% 27.4% (2.6%) (1.7%)<br />
New Zealand 218 23 $ 9.35 0.0% 0.0% 405 49 $ 8.30<br />
0.1% 0.1% 85.4% 108.9% (11.2%) 90.5% 92.4%<br />
Bulgaria 304 150 $ 2.03 0.2% 0.2% 299 136 $ 2.20<br />
0.2% 0.2% (1.7%) (9.2%) 8.2% (17.2%) (16.3%)<br />
Belgium 200 65 $ 3.07 0.1% 0.1% 207 67 $ 3.09<br />
0.1% 0.1% 3.5% 2.8% 0.7% (6.2%) (5.3%)<br />
Finland 92 45 $ 2.05 0.1% 0.1% 188 79 $ 2.40<br />
0.1% 0.1% 103.9% 74.6% 16.8% 59.2% 60.8%<br />
LISTED COUNTRY IMPORTS 255,781 69,796 $ 3.66 99.7% 99.7% 324,406 76,546 $ 4.24 99.7% 100.7% 26.8% 9.7% 15.6% 0.0% 1.0%<br />
OTHER COUNTRY IMPORTS 599 201 $ 2.98 0.3% 0.3% 841 209 $ 4.03<br />
0.3% 0.3% 40.5% 3.9% 35.2% (5.3%) (4.3%)<br />
TOTAL IMPORTS (3) 256,379 69,997 $ 3.66 100.0% 100.0% 325,247 76,754 $ 4.24 100.0% 101.0% 26.9% 9.7% 15.7% 0.0% 1.0%<br />
DOMESTIC WINE 3 0.0% (754) (1.0%) (26563.3%) (24474.1%)<br />
TOTAL MARKET (4) 70,000 100.0% 76,000 100.0% 8.6% 0.0%<br />
(1) Ranked by Value in 2007<br />
(2) Based on volume. "0.0%"Indicates less than 0.1%.<br />
(3) Some imported wines may be transshipped to other countries in which case the import market and the total market may be overstated.<br />
(4) Total wine market estimated at 70 million liters in 2006 and 76 million liters in 2007.<br />
See Appendices 1 & 2<br />
Source: Global Trade Information Service. Copyright: Trade Data and Analysis<br />
Table 20<br />
Page 20
COUNTRY WINE MARKET ANALYSIS - IMPORTS<br />
BELGIUM<br />
2006, 2007 AND 2007/ 2006<br />
TABLE WINE, SPARKLING WINE DESSERT WINE, VERMOUTH AND OTHER SPECIAL NATURAL WINE<br />
VALUE ($US 000), VOLUME (LITERS 000) AND VALUE/LITER ($)<br />
HTS CODES 2204/2205/2206 COMBINED<br />
DOMESTIC WINE CONSUMPTION AND TOTAL WINE MARKET<br />
2006 2007 2007/2006 (% CHANGE)<br />
MARKET MARKET SHARE (%) (2) MARKET MARKET SHARE (%) (2)<br />
MARKET MARKET SHARE (%) (2)<br />
VALUE VOLUME VALUE/ IMPORT TOTAL VALUE VOLUME VALUE/ IMPORT TOTAL VALUE VOLUME VALUE/ IMPORT TOTAL<br />
COUNTRY (1) ($US 000) LITERS (000) LITER ($) MARKET MARKET ($US 000) LITERS (000) LITER ($) MARKET MARKET ($US 000) LITERS (000) LITER ($) MARKET MARKET<br />
France 731,187 183,352 $ 3.99 57.4% 52.4% 1,034,270 196,954 $ 5.25 58.4% 53.2% 41.5% 7.4% 31.7% 1.7% 1.6%<br />
Spain 74,517 28,295 $ 2.63 8.9% 8.1% 91,246 28,562 $ 3.19<br />
8.5% 7.7% 22.4% 0.9% 21.3% (4.4%) (4.5%)<br />
Italy 67,057 26,813 $ 2.50 8.4% 7.7% 80,026 27,168 $ 2.95<br />
8.1% 7.3% 19.3% 1.3% 17.8% (4.0%) (4.2%)<br />
Portugal 56,322 13,508 $ 4.17 4.2% 3.9% 62,528 13,963 $ 4.48<br />
4.1% 3.8% 11.0% 3.4% 7.4% (2.1%) (2.2%)<br />
Germany 35,113 15,288 $ 2.30 4.8% 4.4% 42,432 16,187 $ 2.62<br />
4.8% 4.4% 20.8% 5.9% 14.1% 0.3% 0.2%<br />
Netherlands 34,640 8,192 $ 4.23 2.6% 2.3% 40,749 7,459 $ 5.46<br />
2.2% 2.0% 17.6% (8.9%) 29.2% (13.8%) (13.9%)<br />
Chile 21,671 7,988 $ 2.71 2.5% 2.3% 25,191 9,508 $ 2.65<br />
2.8% 2.6% 16.2% 19.0% (2.3%) 12.7% 12.6%<br />
Luxembourg 20,818 6,502 $ 3.20 2.0% 1.9% 23,731 6,514 $ 3.64<br />
1.9% 1.8% 14.0% 0.2% 13.8% (5.1%) (5.2%)<br />
South Africa 20,647 10,846 $ 1.90 3.4% 3.1% 22,834 11,750 $ 1.94<br />
3.5% 3.2% 10.6% 8.3% 2.1% 2.6% 2.5%<br />
Australia 17,185 6,608 $ 2.60 2.1% 1.9% 20,562 7,445 $ 2.76<br />
2.2% 2.0% 19.7% 12.7% 6.2% 6.7% 6.6%<br />
United Kingdom 10,867 2,982 $ 3.64 0.9% 0.9% 12,590 3,462 $ 3.64<br />
1.0% 0.9% 15.9% 16.1% (0.2%) 10.0% 9.8%<br />
Argentina 5,862 1,945 $ 3.01 0.6% 0.6% 6,262 2,064 $ 3.03<br />
0.6% 0.6% 6.8% 6.1% 0.7% 0.5% 0.4%<br />
United States 4,833 1,817 $ 2.66 0.6% 0.5% 3,466 1,204 $ 2.88<br />
0.4% 0.3% (28.3%) (33.8%) 8.3% (37.3%) (37.3%)<br />
Greece 2,920 1,141 $ 2.56 0.4% 0.3% 3,320 1,246 $ 2.66<br />
0.4% 0.3% 13.7% 9.2% 4.1% 3.5% 3.3%<br />
Turkey 1,529 944 $ 1.62 0.3% 0.3% 2,730 1,346 $ 2.03<br />
0.4% 0.4% 78.6% 42.5% 25.3% 35.0% 34.8%<br />
New Zealand 1,261 187 $ 6.76 0.1% 0.1% 1,228 185 $ 6.63<br />
0.1% 0.1% (2.6%) (0.8%) (1.8%) (6.0%) (6.2%)<br />
Switzerland 878 167 $ 5.26 0.1% 0.0% 1,089 186 $ 5.84<br />
0.1% 0.1% 24.0% 11.7% 11.0% 5.8% 5.7%<br />
Austria 821 121 $ 6.81 0.0% 0.0% 817 116 $ 7.05<br />
0.0% 0.0% (0.5%) (3.9%) 3.6% (9.0%) (9.1%)<br />
Israel 383 70 $ 5.47 0.0% 0.0% 723 125 $ 5.78<br />
0.0% 0.0% 88.8% 78.6% 5.7% 69.1% 68.9%<br />
Hungary 384 139 $ 2.76 0.0% 0.0% 707 127 $ 5.57<br />
0.0% 0.0% 84.2% (8.7%) 101.7% (13.5%) (13.6%)<br />
LISTED COUNTRY IMPORTS 1,108,895 316,904 $ 3.50 99.3% 90.5% 1,476,500 335,570 $ 4.40 99.6% 90.7% 33.2% 5.9% 25.7% 0.3% 0.2%<br />
OTHER COUNTRY IMPORTS 5,608 2,290 $ 2.45 0.7% 0.7% 4,698 1,428 $ 3.29<br />
0.4% 0.4% (16.2%) (37.6%) 34.3% (40.9%) (41.0%)<br />
TOTAL IMPORTS (3) 1,114,503 319,193 $ 3.49 100.0% 91.2% 1,481,198 336,998 $ 4.40 100.0% 91.1% 32.9% 5.6% 25.9% 0.0% (0.1%)<br />
DOMESTIC WINE 30,807 8.8% 33,002 8.9% 7.1% 1.3%<br />
TOTAL MARKET (4) 350,000 100.0% 370,000 100.0% 5.7% 0.0%<br />
(1) Ranked by Value in 2007<br />
(2) Based on volume. "0.0%"Indicates less than 0.1%.<br />
(3) Some imported wines may be transshipped to other countries in which case the import market and the total market may be overstated.<br />
(4) Total wine market estimated at 350 million liters in 2006 and 370 million liters in 2007.<br />
See Appendices 1 & 2<br />
Source: Global Trade Information Service. Copyright: Trade Data and Analysis<br />
Table 21<br />
Page 21
COUNTRY WINE MARKET ANALYSIS - IMPORTS<br />
POLAND<br />
2006, 2007 AND 2007/ 2006<br />
TABLE WINE, SPARKLING WINE DESSERT WINE, VERMOUTH AND OTHER SPECIAL NATURAL WINE<br />
VALUE ($US 000), VOLUME (LITERS 000) AND VALUE/LITER ($)<br />
HTS CODES 2204/2205/2206 COMBINED<br />
DOMESTIC WINE CONSUMPTION AND TOTAL WINE MARKET<br />
2006 2007 2007/2006 (% CHANGE)<br />
MARKET MARKET SHARE (%) (2) MARKET MARKET SHARE (%) (2)<br />
MARKET MARKET SHARE (%) (2)<br />
VALUE VOLUME VALUE/ IMPORT TOTAL VALUE VOLUME VALUE/ IMPORT TOTAL VALUE VOLUME VALUE/ IMPORT TOTAL<br />
COUNTRY (1) ($US 000) LITERS (000) LITER ($) MARKET MARKET ($US 000) LITERS (000) LITER ($) MARKET MARKET ($US 000) LITERS (000) LITER ($) MARKET MARKET<br />
Italy 28,470 15,921 $ 1.79 19.7% 13.3% 42,117 20,998 $ 2.01 21.5% 15.0% 47.9% 31.9% 12.2% 9.4% 13.0%<br />
France 18,990 5,822 $ 3.26 7.2% 4.9% 29,293 7,546 $ 3.88<br />
7.7% 5.4% 54.3% 29.6% 19.0% 7.5% 11.1%<br />
Bulgaria 22,652 19,813 $ 1.14 24.5% 16.5% 28,312 20,620 $ 1.37 21.1% 14.7% 25.0% 4.1% 20.1% (13.7%) (10.8%)<br />
Netherlands 11,771 3,217 $ 3.66 4.0% 2.7% 19,241 5,015 $ 3.84<br />
5.1% 3.6% 63.5% 55.9% 4.9% 29.3% 33.6%<br />
Germany 14,175 7,636 $ 1.86 9.4% 6.4% 19,009 9,097 $ 2.09<br />
9.3% 6.5% 34.1% 19.1% 12.6% (1.2%) 2.1%<br />
Spain 13,212 7,749 $ 1.70 9.6% 6.5% 15,727 7,844 $ 2.00<br />
8.0% 5.6% 19.0% 1.2% 17.6% (16.0%) (13.2%)<br />
Chile 8,608 3,069 $ 2.80 3.8% 2.6% 10,979 3,811 $ 2.88<br />
3.9% 2.7% 27.5% 24.2% 2.7% 3.0% 6.4%<br />
Hungary 7,762 6,652 $ 1.17 8.2% 5.5% 10,276 9,084 $ 1.13<br />
9.3% 6.5% 32.4% 36.6% (3.1%) 13.3% 17.0%<br />
Moldova 4,227 2,676 $ 1.58 3.3% 2.2% 6,152 3,470 $ 1.77<br />
3.6% 2.5% 45.5% 29.7% 12.2% 7.6% 11.2%<br />
Portugal 2,313 854 $ 2.71 1.1% 0.7% 4,495 1,664 $ 2.70<br />
1.7% 1.2% 94.3% 94.9% (0.3%) 61.7% 67.0%<br />
Argentina 2,684 1,151 $ 2.33 1.4% 1.0% 3,729 1,573 $ 2.37<br />
1.6% 1.1% 39.0% 36.7% 1.7% 13.4% 17.1%<br />
South Africa 1,697 622 $ 2.73 0.8% 0.5% 2,859 943 $ 3.03<br />
1.0% 0.7% 68.5% 51.7% 11.1% 25.8% 30.0%<br />
Australia 2,023 669 $ 3.02 0.8% 0.6% 2,851 867 $ 3.29<br />
0.9% 0.6% 40.9% 29.5% 8.9% 7.4% 11.0%<br />
United States 1,812 574 $ 3.16 0.7% 0.5% 2,048 707 $ 2.90<br />
0.7% 0.5% 13.0% 23.0% (8.2%) 2.1% 5.5%<br />
Greece 1,191 609 $ 1.96 0.8% 0.5% 1,673 705 $ 2.37<br />
0.7% 0.5% 40.4% 15.7% 21.3% (4.0%) (0.8%)<br />
Sweden 1,009 221 $ 4.57 0.3% 0.2% 1,079 236 $ 4.58<br />
0.2% 0.2% 6.8% 6.5% 0.3% (11.6%) (8.7%)<br />
United Kingdom 561 162 $ 3.47 0.2% 0.1% 1,050 328 $ 3.20<br />
0.3% 0.2% 87.2% 103.0% (7.8%) 68.4% 74.0%<br />
Georgia 711 208 $ 3.41 0.3% 0.2% 1,032 293 $ 3.52<br />
0.3% 0.2% 45.1% 40.8% 3.1% 16.8% 20.7%<br />
Belgium 880 295 $ 2.99 0.4% 0.2% 934 195 $ 4.79<br />
0.2% 0.1% 6.1% (33.8%) 60.3% (45.1%) (43.3%)<br />
Czech Republic 411 200 $ 2.06 0.2% 0.2% 907 315 $ 2.88<br />
0.3% 0.2% 120.6% 57.7% 39.9% 30.8% 35.1%<br />
LISTED COUNTRY IMPORTS 145,160 78,121 $ 1.86 96.6% 65.1% 203,763 95,313 $ 2.14 97.7% 68.1% 40.4% 22.0% 15.1% 1.2% 4.6%<br />
OTHER COUNTRY IMPORTS 4,503 2,789 $ 1.61 3.4% 2.3% 4,865 2,213 $ 2.20<br />
2.3% 1.6% 8.0% (20.7%) 36.2% (34.2%) (32.0%)<br />
TOTAL IMPORTS (3) 149,663 80,910 $ 1.85 100.0% 67.4% 208,628 97,525 $ 2.14 100.0% 69.7% 39.4% 20.5% 15.6% 0.0% 3.3%<br />
DOMESTIC WINE 39,090 32.6% 42,475 30.3% 8.7% (6.9%)<br />
TOTAL MARKET (4) 120,000 100.0% 140,000 100.0% 16.7% 0.0%<br />
(1) Ranked by Value in 2007<br />
(2) Based on volume. "0.0%"Indicates less than 0.1%.<br />
(3) Some imported wines may be transshipped to other countries in which case the import market and the total market may be overstated.<br />
(4) Total wine market estimated at 120 million liters in 2006 and 140 million liters in 2007.<br />
See Appendices 1 & 2<br />
Source: Global Trade Information Service. Copyright: Trade Data and Analysis<br />
Table 22<br />
Page 22
APPENDIX 1<br />
COUNTRY WINE MARKET ANALYSIS - IMPORTS<br />
UNITED STATES<br />
2006, 2007 AND 2007/ 2006<br />
TABLE WINE, SPARKLING WINE DESSERT WINE, VERMOUTH AND OTHER SPECIAL NATURAL WINE<br />
VALUE ($US 000), VOLUME (LITERS 000) AND VALUE/LITER ($)<br />
HTS CODES 2204/2205/2206 COMBINED<br />
DOMESTIC WINE CONSUMPTION AND TOTAL WINE MARKET<br />
2006 2007 2007/2006 (% CHANGE)<br />
MARKET MARKET SHARE (%) (2) MARKET MARKET SHARE (%) (2)<br />
MARKET MARKET SHARE (%) (2)<br />
VALUE VOLUME VALUE/ IMPORT TOTAL VALUE VOLUME VALUE/ IMPORT TOTAL VALUE VOLUME VALUE/ IMPORT TOTAL<br />
COUNTRY (1) ($US 000) LITERS (000) LITER ($) MARKET MARKET ($US 000) LITERS (000) LITER ($) MARKET MARKET ($US 000) LITERS (000) LITER ($) MARKET MARKET<br />
France 1,332,672 125,497 10.6 15.4% 4.8% 1,468,578 129,867 11.3 14.8% 4.8% 10.2% 3.5% 6.5% (3.6%) 0.8%<br />
Italy 1,180,662 237,977 5.0 29.1% 9.1% 1,293,133 258,021 5.0 29.4% 9.6% 9.5% 8.4% 1.0% 1.0% 5.6%<br />
Australia 766,627 216,009 3.5 26.4% 8.3% 797,523 204,132 3.9 23.3% 7.6% 4.0% (5.5%) 10.1% (11.9%) (8.0%)<br />
Spain 238,879 45,670 5.2 5.6% 1.7% 275,022 50,487 5.4 5.8% 1.9% 15.1% 10.5% 4.1% 3.0% 7.7%<br />
Chile 170,310 54,066 3.2 6.6% 2.1% 211,192 61,040 3.5 7.0% 2.3% 24.0% 12.9% 9.8% 5.2% 9.9%<br />
New Zealand 104,475 14,773 7.1 1.8% 0.6% 145,538 19,656 7.4 2.2% 0.7% 39.3% 33.1% 4.7% 24.0% 29.6%<br />
Germany 121,006 27,791 4.4 3.4% 1.1% 144,527 30,961 4.7 3.5% 1.2% 19.4% 11.4% 7.2% 3.8% 8.5%<br />
Argentina 92,893 39,554 2.3 4.8% 1.5% 132,493 65,750 2.0 7.5% 2.4% 42.6% 66.2% (14.2%) 54.9% 61.9%<br />
Portugal 68,039 10,535 6.5 1.3% 0.4% 71,317 11,507 6.2 1.3% 0.4% 4.8% 9.2% (4.0%) 1.8% 6.4%<br />
South Africa 43,278 10,330 4.2 1.3% 0.4% 42,072 10,790 3.9 1.2% 0.4% (2.8%) 4.4% (6.9%) (2.7%) 1.7%<br />
Japan 28,483 3,975 7.2 0.5% 0.2% 32,802 4,475 7.3 0.5% 0.2% 15.2% 12.6% 2.3% 4.9% 9.6%<br />
Ireland 13,343 3,929 3.4 0.5% 0.2% 14,572 4,493 3.2 0.5% 0.2% 9.2% 14.4% (4.5%) 6.6% 11.4%<br />
United Kingdom 7,377 3,748 2.0 0.5% 0.1% 11,827 4,509 2.6 0.5% 0.2% 60.3% 20.3% 33.3% 12.1% 17.1%<br />
Canada 23,001 8,374 2.7 1.0% 0.3% 11,392 4,896 2.3 0.6% 0.2% (50.5%) (41.5%) (15.3%) (45.5%) (43.1%)<br />
Austria 9,496 1,815 5.2 0.2% 0.1% 11,155 1,487 7.5 0.2% 0.1% 17.5% (18.1%) 43.4% (23.7%) (20.2%)<br />
Greece 8,232 1,912 4.3 0.2% 0.1% 10,295 2,284 4.5 0.3% 0.1% 25.1% 19.4% 4.7% 11.3% 16.3%<br />
Israel 6,510 1,094 6.0 0.1% 0.0% 9,447 1,399 6.8 0.2% 0.1% 45.1% 27.9% 13.5% 19.2% 24.6%<br />
Hungary 3,222 782 4.1 0.1% 0.0% 4,637 1,006 4.6 0.1% 0.0% 43.9% 28.6% 11.9% 19.8% 25.2%<br />
Korea South 5,198 1,371 3.8 0.2% 0.1% 3,518 1,120 3.1 0.1% 0.0% (32.3%) (18.3%) (17.2%) (23.9%) (20.4%)<br />
Belgium 2,118 283 7.5 0.0% 0.0% 1,894 173 10.9 0.0% 0.0% (10.5%) (38.8%) 46.1% (42.9%) (40.4%)<br />
LISTED COUNTRY IMPORTS 4,225,819 809,486 5.2 99.1% 30.9% 4,692,934 868,051 5.4 99.0% 32.3% 11.1% 7.2% 3.6% (0.1%) 4.4%<br />
OTHER COUNTRY IMPORTS 20,246 7,392 2.7 0.9% 0.3% 23,220 8,452 2.7 1.0% 0.3% 14.7% 14.3% 0.3% 6.6% 11.3%<br />
TOTAL IMPORTS 4,246,066 816,878 5.2 100.0% 31.2% 4,716,154 876,503 5.4 100.0% 32.6% 11.1% 7.3% 3.5% 0.0% 4.5%<br />
DOMESTIC WINE 1,801,122 68.8% 1,811,797 67.4% 0.6% (2.0%)<br />
TOTAL MARKET (3) 2,618,000 100.0% 2,688,300 100.0% 2.7% 0.0%<br />
(1) Ranked by Value in 2007<br />
(2) Based on volume. "0.0%"Indicates less than 0.1%.<br />
(3) Some imported wines may be transshipped to other countries in which case the import market and the total market may be overstated.<br />
(4) Total wine market estimated at 2.618 million liters in 2006 and 2.688million liters in 2007.<br />
See Appendices 1 & 2
APPENDIX 2<br />
WINE CONSUMPTION IN SELECTED COUNTRIES<br />
GLOBAL WINE CONSUMPTION<br />
GLOBAL WINE IMPORTS<br />
2006 & 2007<br />
LITERS (000) (1)<br />
2006 2007<br />
COUNTRY LITERS (000) LITERS (000)<br />
United Kingdom 1,325,000 1,382,000<br />
Canada 420,000 437,000<br />
Japan 250,000 245,000<br />
Germany 1,985,000 1,990,000<br />
Italy 2,730,000 2,690,000<br />
Netherlands 365,000 370,000<br />
Switzerland 270,000 264,000<br />
France 3,280,000 3,234,000<br />
Mexico 150,000 160,000<br />
Denmark 200,000 200,000<br />
South Korea 24,000 35,000<br />
Sweden 183,000 200,000<br />
China 1,600,000 1,760,000<br />
Ireland 88,000 90,000<br />
Hong Kong 22,000 27,000<br />
Taiwan 25,000 27,000<br />
Singapore 21,000 25,000<br />
Finland 76,000 85,000<br />
Russia 1,120,000 1,310,000<br />
Norway 70,000 76,000<br />
Belgium 350,000 370,000<br />
Poland 120,000 140,000<br />
SELECTED COUNTRY TOTAL 14,674,000 15,117,000<br />
United States 2,618,000 2,688,000<br />
OTHER COUNTRIES 7,216,500 7,142,202<br />
GLOBAL WINE CONSUMPTION 24,508,500 24,947,202<br />
GLOBAL WINE IMPORTS 85,636 90,000<br />
(1) See Table 5.2 World <strong>Wine</strong> Consumption 2002-2006 "World <strong>Wine</strong> Report - 2007"<br />
Trade Data & Analysis, December 31, 2007 pages 37-41 and TDA update for 2007<br />
dated April 17, 2008.