analysis of united states imports - California Wine Export Program
analysis of united states imports - California Wine Export Program
analysis of united states imports - California Wine Export Program

Create successful ePaper yourself
Turn your PDF publications into a flip-book with our unique Google optimized e-Paper software.
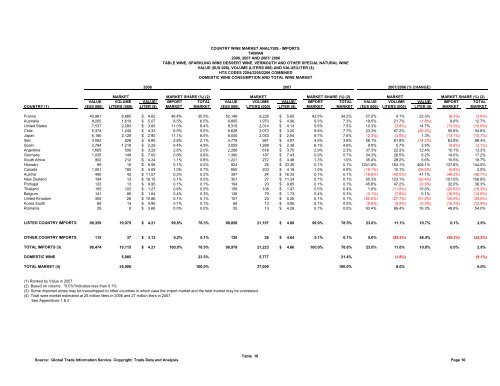
COUNTRY WINE MARKET ANALYSIS - IMPORTS<br />
TAIWAN<br />
2006, 2007 AND 2007/ 2006<br />
TABLE WINE, SPARKLING WINE DESSERT WINE, VERMOUTH AND OTHER SPECIAL NATURAL WINE<br />
VALUE ($US 000), VOLUME (LITERS 000) AND VALUE/LITER ($)<br />
HTS CODES 2204/2205/2206 COMBINED<br />
DOMESTIC WINE CONSUMPTION AND TOTAL WINE MARKET<br />
2006 2007 2007/2006 (% CHANGE)<br />
MARKET MARKET SHARE (%) (2) MARKET MARKET SHARE (%) (2)<br />
MARKET MARKET SHARE (%) (2)<br />
VALUE VOLUME VALUE/ IMPORT TOTAL VALUE VOLUME VALUE/ IMPORT TOTAL VALUE VOLUME VALUE/ IMPORT TOTAL<br />
COUNTRY (1) ($US 000) LITERS (000) LITER ($) MARKET MARKET ($US 000) LITERS (000) LITER ($) MARKET MARKET ($US 000) LITERS (000) LITER ($) MARKET MARKET<br />
France 40,981 8,865 $ 4.62 46.4% 35.5% 52,146 9,226 $ 5.65 43.5% 34.2% 27.2% 4.1% 22.3% (6.3%) (3.6%)<br />
Australia 8,205 1,619 $ 5.07 8.5% 6.5% 9,805 1,970 $ 4.98<br />
9.3% 7.3% 19.5% 21.7% (1.8%) 9.6% 12.7%<br />
United States 7,537 2,093 $ 3.60 11.0% 8.4% 8,316 2,014 $ 4.13<br />
9.5% 7.5% 10.3% (3.8%) 14.7% (13.3%) (10.9%)<br />
Chile 5,374 1,240 $ 4.33 6.5% 5.0% 6,628 2,073 $ 3.20<br />
9.8% 7.7% 23.3% 67.2% (26.2%) 50.6% 54.8%<br />
Japan 6,180 2,128 $ 2.90 11.1% 8.5% 6,040 2,053 $ 2.94<br />
9.7% 7.6% (2.3%) (3.5%) 1.3% (13.1%) (10.7%)<br />
Italy 3,062 528 $ 5.80 2.8% 2.1% 4,779 961 $ 4.97<br />
4.5% 3.6% 56.1% 81.8% (14.2%) 63.8% 68.4%<br />
Spain 2,784 1,218 $ 2.29 6.4% 4.9% 3,059 1,288 $ 2.38<br />
6.1% 4.8% 9.9% 5.7% 3.9% (4.8%) (2.1%)<br />
Argentina 1,665 506 $ 3.29 2.6% 2.0% 2,286 618 $ 3.70<br />
2.9% 2.3% 37.3% 22.2% 12.4% 10.1% 13.2%<br />
Germany 1,035 148 $ 7.00 0.8% 0.6% 1,390 187 $ 7.43<br />
0.9% 0.7% 34.3% 26.5% 6.2% 14.0% 17.2%<br />
South Africa 902 212 $ 4.24 1.1% 0.8% 1,221 272 $ 4.48<br />
1.3% 1.0% 35.4% 28.2% 5.6% 15.5% 18.7%<br />
Hungary 69 10 $ 6.56 0.1% 0.0% 924 28 $ 33.35<br />
0.1% 0.1% 1241.8% 164.1% 408.1% 137.8% 144.5%<br />
Canada 1,051 185 $ 5.69 1.0% 0.7% 850 203 $ 4.18<br />
1.0% 0.8% (19.1%) 10.1% (26.6%) (0.8%) 2.0%<br />
Austria 490 42 $ 11.57 0.2% 0.2% 397 24 $ 16.33<br />
0.1% 0.1% (18.8%) (42.5%) 41.1% (48.2%) (46.7%)<br />
New Zealand 194 12 $ 16.15 0.1% 0.0% 301 27 $ 11.24<br />
0.1% 0.1% 55.3% 123.1% (30.4%) 101.0% 106.6%<br />
Portugal 133 13 $ 9.95 0.1% 0.1% 194 20 $ 9.85<br />
0.1% 0.1% 45.8% 47.2% (0.9%) 32.6% 36.3%<br />
Thailand 155 122 $ 1.27 0.6% 0.5% 158 108 $ 1.47<br />
0.5% 0.4% 1.9% (11.8%) 15.6% (20.6%) (18.3%)<br />
Belgium 141 86 $ 1.64 0.4% 0.3% 136 79 $ 1.73<br />
0.4% 0.3% (3.1%) (7.8%) 5.1% (16.9%) (14.6%)<br />
United Kingdom 305 28 $ 10.86 0.1% 0.1% 107 20 $ 5.26<br />
0.1% 0.1% (65.0%) (27.7%) (51.6%) (34.9%) (33.0%)<br />
Korea South 69 14 $ 4.95 0.1% 0.1% 65 13 $ 4.95<br />
0.1% 0.0% (5.9%) (5.9%) (0.0%) (15.3%) (12.9%)<br />
Romania 28 8 $ 3.68 0.0% 0.0% 55 13 $ 4.28<br />
0.1% 0.0% 93.4% 66.4% 16.3% 49.8% 54.0%<br />
LISTED COUNTRY IMPORTS 80,359 19,079 $ 4.21 99.8% 76.3% 98,858 21,197 $ 4.66 99.9% 78.5% 23.0% 11.1% 10.7% 0.1% 2.9%<br />
OTHER COUNTRY IMPORTS 115 37 $ 3.13 0.2% 0.1% 120 26 $ 4.64<br />
0.1% 0.1% 5.0% (29.2%) 48.4% (36.3%) (34.5%)<br />
TOTAL IMPORTS (3) 80,474 19,115 $ 4.21 100.0% 76.5% 98,978 21,223 $ 4.66 100.0% 78.6% 23.0% 11.0% 10.8% 0.0% 2.8%<br />
DOMESTIC WINE 5,885 23.5% 5,777 21.4% (1.8%) (9.1%)<br />
TOTAL MARKET (4) 25,000 100.0% 27,000 100.0% 8.0% 0.0%<br />
(1) Ranked by Value in 2007<br />
(2) Based on volume. "0.0%"Indicates less than 0.1%.<br />
(3) Some imported wines may be transshipped to other countries in which case the import market and the total market may be overstated.<br />
(4) Total wine market estimated at 25 million liters in 2006 and 27 million liters in 2007.<br />
See Appendices 1 & 2<br />
Source: Global Trade Information Service. Copyright: Trade Data and Analysis<br />
Table 16<br />
Page 16