analysis of united states imports - California Wine Export Program
analysis of united states imports - California Wine Export Program
analysis of united states imports - California Wine Export Program

You also want an ePaper? Increase the reach of your titles
YUMPU automatically turns print PDFs into web optimized ePapers that Google loves.
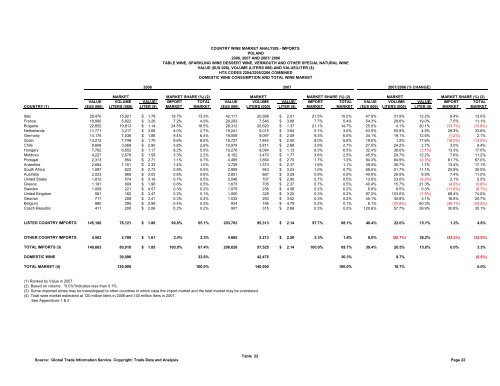
COUNTRY WINE MARKET ANALYSIS - IMPORTS<br />
POLAND<br />
2006, 2007 AND 2007/ 2006<br />
TABLE WINE, SPARKLING WINE DESSERT WINE, VERMOUTH AND OTHER SPECIAL NATURAL WINE<br />
VALUE ($US 000), VOLUME (LITERS 000) AND VALUE/LITER ($)<br />
HTS CODES 2204/2205/2206 COMBINED<br />
DOMESTIC WINE CONSUMPTION AND TOTAL WINE MARKET<br />
2006 2007 2007/2006 (% CHANGE)<br />
MARKET MARKET SHARE (%) (2) MARKET MARKET SHARE (%) (2)<br />
MARKET MARKET SHARE (%) (2)<br />
VALUE VOLUME VALUE/ IMPORT TOTAL VALUE VOLUME VALUE/ IMPORT TOTAL VALUE VOLUME VALUE/ IMPORT TOTAL<br />
COUNTRY (1) ($US 000) LITERS (000) LITER ($) MARKET MARKET ($US 000) LITERS (000) LITER ($) MARKET MARKET ($US 000) LITERS (000) LITER ($) MARKET MARKET<br />
Italy 28,470 15,921 $ 1.79 19.7% 13.3% 42,117 20,998 $ 2.01 21.5% 15.0% 47.9% 31.9% 12.2% 9.4% 13.0%<br />
France 18,990 5,822 $ 3.26 7.2% 4.9% 29,293 7,546 $ 3.88<br />
7.7% 5.4% 54.3% 29.6% 19.0% 7.5% 11.1%<br />
Bulgaria 22,652 19,813 $ 1.14 24.5% 16.5% 28,312 20,620 $ 1.37 21.1% 14.7% 25.0% 4.1% 20.1% (13.7%) (10.8%)<br />
Netherlands 11,771 3,217 $ 3.66 4.0% 2.7% 19,241 5,015 $ 3.84<br />
5.1% 3.6% 63.5% 55.9% 4.9% 29.3% 33.6%<br />
Germany 14,175 7,636 $ 1.86 9.4% 6.4% 19,009 9,097 $ 2.09<br />
9.3% 6.5% 34.1% 19.1% 12.6% (1.2%) 2.1%<br />
Spain 13,212 7,749 $ 1.70 9.6% 6.5% 15,727 7,844 $ 2.00<br />
8.0% 5.6% 19.0% 1.2% 17.6% (16.0%) (13.2%)<br />
Chile 8,608 3,069 $ 2.80 3.8% 2.6% 10,979 3,811 $ 2.88<br />
3.9% 2.7% 27.5% 24.2% 2.7% 3.0% 6.4%<br />
Hungary 7,762 6,652 $ 1.17 8.2% 5.5% 10,276 9,084 $ 1.13<br />
9.3% 6.5% 32.4% 36.6% (3.1%) 13.3% 17.0%<br />
Moldova 4,227 2,676 $ 1.58 3.3% 2.2% 6,152 3,470 $ 1.77<br />
3.6% 2.5% 45.5% 29.7% 12.2% 7.6% 11.2%<br />
Portugal 2,313 854 $ 2.71 1.1% 0.7% 4,495 1,664 $ 2.70<br />
1.7% 1.2% 94.3% 94.9% (0.3%) 61.7% 67.0%<br />
Argentina 2,684 1,151 $ 2.33 1.4% 1.0% 3,729 1,573 $ 2.37<br />
1.6% 1.1% 39.0% 36.7% 1.7% 13.4% 17.1%<br />
South Africa 1,697 622 $ 2.73 0.8% 0.5% 2,859 943 $ 3.03<br />
1.0% 0.7% 68.5% 51.7% 11.1% 25.8% 30.0%<br />
Australia 2,023 669 $ 3.02 0.8% 0.6% 2,851 867 $ 3.29<br />
0.9% 0.6% 40.9% 29.5% 8.9% 7.4% 11.0%<br />
United States 1,812 574 $ 3.16 0.7% 0.5% 2,048 707 $ 2.90<br />
0.7% 0.5% 13.0% 23.0% (8.2%) 2.1% 5.5%<br />
Greece 1,191 609 $ 1.96 0.8% 0.5% 1,673 705 $ 2.37<br />
0.7% 0.5% 40.4% 15.7% 21.3% (4.0%) (0.8%)<br />
Sweden 1,009 221 $ 4.57 0.3% 0.2% 1,079 236 $ 4.58<br />
0.2% 0.2% 6.8% 6.5% 0.3% (11.6%) (8.7%)<br />
United Kingdom 561 162 $ 3.47 0.2% 0.1% 1,050 328 $ 3.20<br />
0.3% 0.2% 87.2% 103.0% (7.8%) 68.4% 74.0%<br />
Georgia 711 208 $ 3.41 0.3% 0.2% 1,032 293 $ 3.52<br />
0.3% 0.2% 45.1% 40.8% 3.1% 16.8% 20.7%<br />
Belgium 880 295 $ 2.99 0.4% 0.2% 934 195 $ 4.79<br />
0.2% 0.1% 6.1% (33.8%) 60.3% (45.1%) (43.3%)<br />
Czech Republic 411 200 $ 2.06 0.2% 0.2% 907 315 $ 2.88<br />
0.3% 0.2% 120.6% 57.7% 39.9% 30.8% 35.1%<br />
LISTED COUNTRY IMPORTS 145,160 78,121 $ 1.86 96.6% 65.1% 203,763 95,313 $ 2.14 97.7% 68.1% 40.4% 22.0% 15.1% 1.2% 4.6%<br />
OTHER COUNTRY IMPORTS 4,503 2,789 $ 1.61 3.4% 2.3% 4,865 2,213 $ 2.20<br />
2.3% 1.6% 8.0% (20.7%) 36.2% (34.2%) (32.0%)<br />
TOTAL IMPORTS (3) 149,663 80,910 $ 1.85 100.0% 67.4% 208,628 97,525 $ 2.14 100.0% 69.7% 39.4% 20.5% 15.6% 0.0% 3.3%<br />
DOMESTIC WINE 39,090 32.6% 42,475 30.3% 8.7% (6.9%)<br />
TOTAL MARKET (4) 120,000 100.0% 140,000 100.0% 16.7% 0.0%<br />
(1) Ranked by Value in 2007<br />
(2) Based on volume. "0.0%"Indicates less than 0.1%.<br />
(3) Some imported wines may be transshipped to other countries in which case the import market and the total market may be overstated.<br />
(4) Total wine market estimated at 120 million liters in 2006 and 140 million liters in 2007.<br />
See Appendices 1 & 2<br />
Source: Global Trade Information Service. Copyright: Trade Data and Analysis<br />
Table 22<br />
Page 22