analysis of united states imports - California Wine Export Program
analysis of united states imports - California Wine Export Program
analysis of united states imports - California Wine Export Program

You also want an ePaper? Increase the reach of your titles
YUMPU automatically turns print PDFs into web optimized ePapers that Google loves.
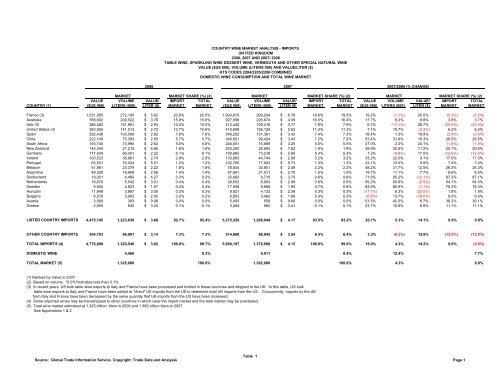
COUNTRY WINE MARKET ANALYSIS - IMPORTS<br />
UN ITED KINGDOM<br />
2006, 2007 AND 2007/ 2006<br />
TABLE WINE, SPARKLING WINE DESSERT WINE, VERMOUTH AND OTHER SPECIAL NATURAL WINE<br />
VALUE ($US 000), VOLUME (LITERS 000) AND VALUE/LITER ($)<br />
HTS CODES 2204/2205/2206 COMBINED<br />
DOMESTIC WINE CONSUMPTION AND TOTAL WINE MARKET<br />
2006 2007 2007/2006 (% CHANGE)<br />
MARKET MARKET SHARE (%) (2) MARKET MARKET SHARE (%) (2)<br />
MARKET MARKET SHARE (%) (2)<br />
VALUE VOLUME VALUE/ IMPORT TOTAL VALUE VOLUME VALUE/ IMPORT TOTAL VALUE VOLUME VALUE/ IMPORT TOTAL<br />
COUNTRY (1) ($US 000) LITERS (000) LITER ($) MARKET MARKET ($US 000) LITERS (000) LITER ($) MARKET MARKET ($US 000) LITERS (000) LITER ($) MARKET MARKET<br />
France (3) 1,531,055 272,190 $ 5.62 20.6% 20.5% 1,824,815 269,204 $ 6.78 19.6% 19.5% 19.2% (1.1%) 20.5% (5.2%) (5.2%)<br />
Australia 788,602 209,522 $ 3.76 15.9% 15.8% 927,958 226,674 $ 4.09 16.5% 16.4% 17.7% 8.2% 8.8% 3.8% 3.7%<br />
Italy (3) 386,482 131,961 $ 2.93 10.0% 10.0% 412,442 109,416 $ 3.77<br />
7.9% 7.9% 6.7% (17.1%) 28.7% (20.5%) (20.5%)<br />
United States (3) 383,555 141,013 $ 2.72 10.7% 10.6% 410,608 156,125 $ 2.63 11.3% 11.3% 7.1% 10.7% (3.3%) 6.2% 6.2%<br />
Spain 292,438 100,090 $ 2.92 7.6% 7.6% 346,252 101,381 $ 3.42<br />
7.4% 7.3% 18.4% 1.3% 16.9% (2.9%) (2.9%)<br />
Chile 222,145 75,383 $ 2.95 5.7% 5.7% 340,821 99,424 $ 3.43<br />
7.2% 7.2% 53.4% 31.9% 16.3% 26.5% 26.5%<br />
South Africa 193,740 73,990 $ 2.62 5.6% 5.6% 246,051 75,689 $ 3.25<br />
5.5% 5.5% 27.0% 2.3% 24.1% (1.9%) (1.9%)<br />
New Zealand 145,344 21,212 $ 6.85 1.6% 1.6% 203,292 26,693 $ 7.62<br />
1.9% 1.9% 39.9% 25.8% 11.2% 20.7% 20.6%<br />
Germany 177,934 80,301 $ 2.22 6.1% 6.1% 190,682 73,218 $ 2.60<br />
5.3% 5.3% 7.2% (8.8%) 17.5% (12.6%) (12.6%)<br />
Ireland 100,523 36,661 $ 2.74 2.8% 2.8% 133,863 44,744 $ 2.99<br />
3.2% 3.2% 33.2% 22.0% 9.1% 17.0% 17.0%<br />
Portugal 83,501 16,024 $ 5.21 1.2% 1.2% 102,765 17,943 $ 5.73<br />
1.3% 1.3% 23.1% 12.0% 9.9% 7.4% 7.4%<br />
Belgium 51,861 23,379 $ 2.22 1.8% 1.8% 76,834 30,801 $ 2.49<br />
2.2% 2.2% 48.2% 31.7% 12.5% 26.3% 26.3%<br />
Argentina 48,328 18,909 $ 2.56 1.4% 1.4% 57,841 21,011 $ 2.75<br />
1.5% 1.5% 19.7% 11.1% 7.7% 6.6% 6.5%<br />
Switzerland 19,051 4,465 $ 4.27 0.3% 0.3% 32,683 8,715 $ 3.75<br />
0.6% 0.6% 71.6% 95.2% (12.1%) 87.2% 87.1%<br />
Netherlands 16,676 5,542 $ 3.01 0.4% 0.4% 26,552 8,903 $ 2.98<br />
0.6% 0.6% 59.2% 60.6% (0.9%) 54.1% 54.0%<br />
Sweden 9,520 4,823 $ 1.97 0.4% 0.4% 17,508 8,968 $ 1.95<br />
0.7% 0.6% 83.9% 85.9% (1.1%) 78.3% 78.3%<br />
Hungary 11,849 3,887 $ 3.05 0.3% 0.3% 9,821 4,132 $ 2.38<br />
0.3% 0.3% (17.1%) 6.3% (22.0%) 1.9% 1.9%<br />
Bulgaria 6,279 3,063 $ 2.05 0.2% 0.2% 5,853 3,482 $ 1.68<br />
0.3% 0.3% (6.8%) 13.7% (18.0%) 9.0% 9.0%<br />
Austria 3,569 393 $ 9.08 0.0% 0.0% 5,405 558 $ 9.69<br />
0.0% 0.0% 51.5% 42.0% 6.7% 36.2% 36.1%<br />
Greece 2,655 830 $ 3.20 0.1% 0.1% 3,284 962 $ 3.41<br />
0.1% 0.1% 23.7% 15.8% 6.8% 11.1% 11.1%<br />
LISTED COUNTRY IMPORTS 4,475,105 1,223,639 $ 3.66 92.7% 92.4% 5,375,329 1,288,044 $ 4.17 93.5% 93.2% 20.1% 5.3% 14.1% 0.9% 0.9%<br />
OTHER COUNTRY IMPORTS 304,703 96,901 $ 3.14 7.3% 7.3% 314,868 88,945 $ 3.54<br />
6.5% 6.4% 3.3% (8.2%) 12.6% (12.0%) (12.0%)<br />
TOTAL IMPORTS (4) 4,779,808 1,320,540 $ 3.62 100.0% 99.7% 5,690,197 1,376,989 $ 4.13 100.0% 99.6% 19.0% 4.3% 14.2% 0.0% (0.0%)<br />
DOMESTIC WINE 4,460 0.3% 5,011 0.4% 12.4% 7.7%<br />
TOTAL MARKET (5) 1,325,000 100.0% 1,382,000 100.0% 4.3% 0.0%<br />
(1) Ranked by Value in 2007<br />
(2) Based on volume. "0.0%"Indicates less than 0.1%.<br />
(3) In recent years, US bulk table wine exports to Italy and France have been processed and bottled in those countries and shipped to the UK. In this table, US bulk<br />
table wine exports to Italy and France have been added to "direct" UK <strong>imports</strong> from the US to determine total UK <strong>imports</strong> from the US. Concurrently, <strong>imports</strong> by the UK<br />
from Italy and France have been decreased by the same quantity that UK <strong>imports</strong> from the US have been increased.<br />
(4) Some imported wines may be transshipped to other countries in which case the import market and the total market may be overstated.<br />
(5) Total wine market estimated at 1.325 billion liters in 2006 and 1.382 billion liters in 2007.<br />
See Appendices 1 & 2<br />
Source: Global Trade Information Service. Copyright: Trade Data and Analysis<br />
Table 1<br />
Page 1