HSBC J.P. Morgan Standard Chartered Bank - bicbanco
HSBC J.P. Morgan Standard Chartered Bank - bicbanco
HSBC J.P. Morgan Standard Chartered Bank - bicbanco

Create successful ePaper yourself
Turn your PDF publications into a flip-book with our unique Google optimized e-Paper software.
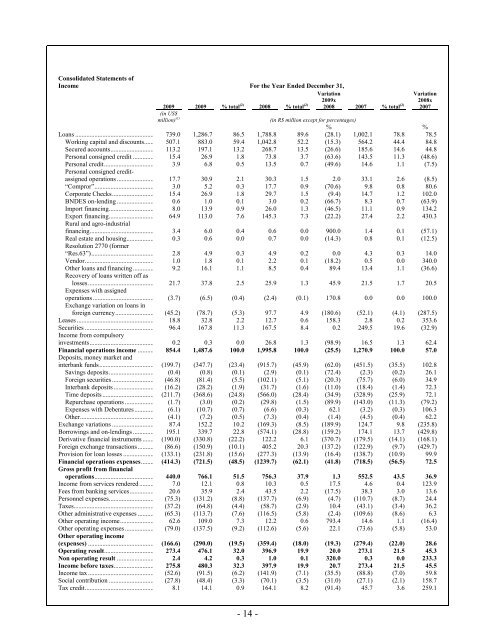
Consolidated Statements of<br />
Income For the Year Ended December 31,<br />
Variation<br />
Variation<br />
2009 2009 % total (2) 2008 % total (2) 2008 2007 % total (2) 2007<br />
2009x<br />
2008x<br />
(in US$<br />
million) (1)<br />
(in R$ million except for percentages)<br />
% %<br />
Loans ................................................. 739.0 1,286.7 86.5 1,788.8 89.6 (28.1) 1,002.1 78.8 78.5<br />
Working capital and discounts ...... 507.1 883.0 59.4 1,042.8 52.2 (15.3) 564.2 44.4 84.8<br />
Secured accounts ........................... 113.2 197.1 13.2 268.7 13.5 (26.6) 185.6 14.6 44.8<br />
Personal consigned credit ............. 15.4 26.9 1.8 73.8 3.7 (63.6) 143.5 11.3 (48.6)<br />
Personal credit ............................... 3.9 6.8 0.5 13.5 0.7 (49.6) 14.6 1.1 (7.5)<br />
Personal consigned creditassigned<br />
operations ....................... 17.7 30.9 2.1 30.3 1.5 2.0 33.1 2.6 (8.5)<br />
“Compror”..................................... 3.0 5.2 0.3 17.7 0.9 (70.6) 9.8 0.8 80.6<br />
Corporate Checks .......................... 15.4 26.9 1.8 29.7 1.5 (9.4) 14.7 1.2 102.0<br />
BNDES on-lending ....................... 0.6 1.0 0.1 3.0 0.2 (66.7) 8.3 0.7 (63.9)<br />
Import financing ............................ 8.0 13.9 0.9 26.0 1.3 (46.5) 11.1 0.9 134.2<br />
Export financing ............................ 64.9 113.0 7.6 145.3 7.3 (22.2) 27.4 2.2 430.3<br />
Rural and agro-industrial<br />
financing ........................................ 3.4 6.0 0.4 0.6 0.0 900.0 1.4 0.1 (57.1)<br />
Real estate and housing ................. 0.3 0.6 0.0 0.7 0.0 (14.3) 0.8 0.1 (12.5)<br />
Resolution 2770 (former<br />
“Res.63”)....................................... 2.8 4.9 0.3 4.9 0.2 0.0 4.3 0.3 14.0<br />
Vendor ........................................... 1.0 1.8 0.1 2.2 0.1 (18.2) 0.5 0.0 340.0<br />
Other loans and financing ............. 9.2 16.1 1.1 8.5 0.4 89.4 13.4 1.1 (36.6)<br />
Recovery of loans written off as<br />
losses ......................................... 21.7 37.8 2.5 25.9 1.3 45.9 21.5 1.7 20.5<br />
Expenses with assigned<br />
operations ...................................... (3.7) (6.5) (0.4) (2.4) (0.1) 170.8 0.0 0.0 100.0<br />
Exchange variation on loans in<br />
foreign currency ........................ (45.2) (78.7) (5.3) 97.7 4.9 (180.6) (52.1) (4.1) (287.5)<br />
Leases ................................................ 18.8 32.8 2.2 12.7 0.6 158.3 2.8 0.2 353.6<br />
Securities ........................................... 96.4 167.8 11.3 167.5 8.4 0.2 249.5 19.6 (32.9)<br />
Income from compulsory<br />
investments ........................................ 0.2 0.3 0.0 26.8 1.3 (98.9) 16.5 1.3 62.4<br />
Financial operations income .......... 854.4 1,487.6 100.0 1,995.8 100.0 (25.5) 1,270.9 100.0 57.0<br />
Deposits, money market and<br />
interbank funds .................................. (199.7) (347.7) (23.4) (915.7) (45.9) (62.0) (451.5) (35.5) 102.8<br />
Savings deposits ............................ (0.4) (0.8) (0.1) (2.9) (0.1) (72.4) (2.3) (0.2) 26.1<br />
Foreign securities .......................... (46.8) (81.4) (5.5) (102.1) (5.1) (20.3) (75.7) (6.0) 34.9<br />
Interbank deposits ......................... (16.2) (28.2) (1.9) (31.7) (1.6) (11.0) (18.4) (1.4) 72.3<br />
Time deposits ................................ (211.7) (368.6) (24.8) (566.0) (28.4) (34.9) (328.9) (25.9) 72.1<br />
Repurchase operations .................. (1.7) (3.0) (0.2) (29.8) (1.5) (89.9) (143.0) (11.3) (79.2)<br />
Expenses with Debentures ............ (6.1) (10.7) (0.7) (6.6) (0.3) 62.1 (3.2) (0.3) 106.3<br />
Other .............................................. (4.1) (7.2) (0.5) (7.3) (0.4) (1.4) (4.5) (0.4) 62.2<br />
Exchange variations .......................... 87.4 152.2 10.2 (169.3) (8.5) (189.9) 124.7 9.8 (235.8)<br />
Borrowings and on-lendings ............. 195.1 339.7 22.8 (574.1) (28.8) (159.2) 174.1 13.7 (429.8)<br />
Derivative financial instruments ....... (190.0) (330.8) (22.2) 122.2 6.1 (370.7) (179.5) (14.1) (168.1)<br />
Foreign exchange transactions .......... (86.6) (150.9) (10.1) 405.2 20.3 (137.2) (122.9) (9.7) (429.7)<br />
Provision for loan losses ................... (133.1) (231.8) (15.6) (277.3) (13.9) (16.4) (138.7) (10.9) 99.9<br />
Financial operations expenses ........ (414.3) (721.5) (48.5) (1239.7) (62.1) (41.8) (718.5) (56.5) 72.5<br />
Gross profit from financial<br />
operations ..................................... 440.0 766.1 51.5 756.3 37.9 1.3 552.5 43.5 36.9<br />
Income from services rendered ......... 7.0 12.1 0.8 10.3 0.5 17.5 4.6 0.4 123.9<br />
Fees from banking services ............... 20.6 35.9 2.4 43.5 2.2 (17.5) 38.3 3.0 13.6<br />
Personnel expenses ............................ (75.3) (131.2) (8.8) (137.7) (6.9) (4.7) (110.7) (8.7) 24.4<br />
Taxes.................................................. (37.2) (64.8) (4.4) (58.7) (2.9) 10.4 (43.1) (3.4) 36.2<br />
Other administrative expenses .......... (65.3) (113.7) (7.6) (116.5) (5.8) (2.4) (109.6) (8.6) 6.3<br />
Other operating income ..................... 62.6 109.0 7.3 12.2 0.6 793.4 14.6 1.1 (16.4)<br />
Other operating expenses .................. (79.0) (137.5) (9.2) (112.6) (5.6) 22.1 (73.6) (5.8) 53.0<br />
Other operating income<br />
(expenses) ......................................... (166.6) (290.0) (19.5) (359.4) (18.0) (19.3) (279.4) (22.0) 28.6<br />
Operating result ............................... 273.4 476.1 32.0 396.9 19.9 20.0 273.1 21.5 45.3<br />
Non operating result ....................... 2.4 4.2 0.3 1.0 0.1 320.0 0.3 0.0 233.3<br />
Income before taxes ......................... 275.8 480.3 32.3 397.9 19.9 20.7 273.4 21.5 45.5<br />
Income tax ......................................... (52.6) (91.5) (6.2) (141.9) (7.1) (35.5) (88.8) (7.0) 59.8<br />
Social contribution ............................ (27.8) (48.4) (3.3) (70.1) (3.5) (31.0) (27.1) (2.1) 158.7<br />
Tax credit ........................................... 8.1 14.1 0.9 164.1 8.2 (91.4) 45.7 3.6 259.1<br />
AMR-248898-v2<br />
- 14 -<br />
95-40469277