2011 Annual Report and Accounts - Investing In Africa
2011 Annual Report and Accounts - Investing In Africa
2011 Annual Report and Accounts - Investing In Africa

You also want an ePaper? Increase the reach of your titles
YUMPU automatically turns print PDFs into web optimized ePapers that Google loves.
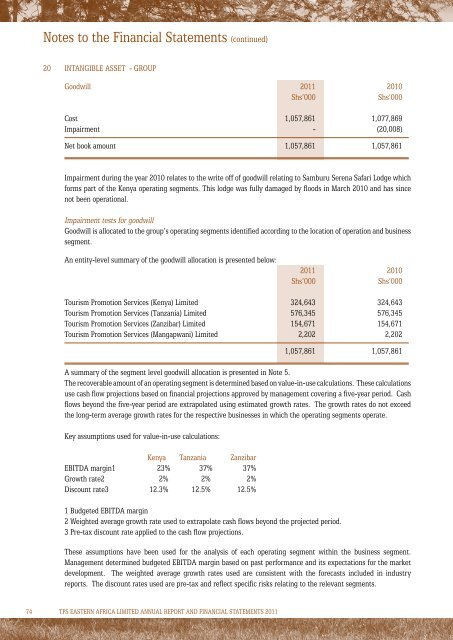
Notes to the Financial Statements (continued)<br />
20 <strong>In</strong>tangible asset - Group<br />
Goodwill <strong>2011</strong> 2010<br />
Shs’000<br />
Shs’000<br />
Cost 1,057,861 1,077,869<br />
Impairment - (20,008)<br />
Net book amount 1,057,861 1,057,861<br />
Impairment during the year 2010 relates to the write off of goodwill relating to Samburu Serena Safari Lodge which<br />
forms part of the Kenya operating segments. This lodge was fully damaged by floods in March 2010 <strong>and</strong> has since<br />
not been operational.<br />
Impairment tests for goodwill<br />
Goodwill is allocated to the group’s operating segments identified according to the location of operation <strong>and</strong> business<br />
segment.<br />
An entity-level summary of the goodwill allocation is presented below:<br />
<strong>2011</strong> 2010<br />
Shs’000<br />
Shs’000<br />
Tourism Promotion Services (Kenya) Limited 324,643 324,643<br />
Tourism Promotion Services (Tanzania) Limited 576,345 576,345<br />
Tourism Promotion Services (Zanzibar) Limited 154,671 154,671<br />
Tourism Promotion Services (Mangapwani) Limited 2,202 2,202<br />
1,057,861 1,057,861<br />
A summary of the segment level goodwill allocation is presented in Note 5.<br />
The recoverable amount of an operating segment is determined based on value-in-use calculations. These calculations<br />
use cash flow projections based on financial projections approved by management covering a five-year period. Cash<br />
flows beyond the five-year period are extrapolated using estimated growth rates. The growth rates do not exceed<br />
the long-term average growth rates for the respective businesses in which the operating segments operate.<br />
Key assumptions used for value-in-use calculations:<br />
Kenya Tanzania Zanzibar<br />
EBITDA margin1 23% 37% 37%<br />
Growth rate2 2% 2% 2%<br />
Discount rate3 12.3% 12.5% 12.5%<br />
1 Budgeted EBITDA margin<br />
2 Weighted average growth rate used to extrapolate cash flows beyond the projected period.<br />
3 Pre-tax discount rate applied to the cash flow projections.<br />
These assumptions have been used for the analysis of each operating segment within the business segment.<br />
Management determined budgeted EBITDA margin based on past performance <strong>and</strong> its expectations for the market<br />
development. The weighted average growth rates used are consistent with the forecasts included in industry<br />
reports. The discount rates used are pre-tax <strong>and</strong> reflect specific risks relating to the relevant segments.<br />
74 TPS EASTERN AFRICA LIMITED ANNUAL REPORT AND FINANCIAL STATEMENTS <strong>2011</strong>