Download PDF - ReliefWeb
Download PDF - ReliefWeb
Download PDF - ReliefWeb

You also want an ePaper? Increase the reach of your titles
YUMPU automatically turns print PDFs into web optimized ePapers that Google loves.
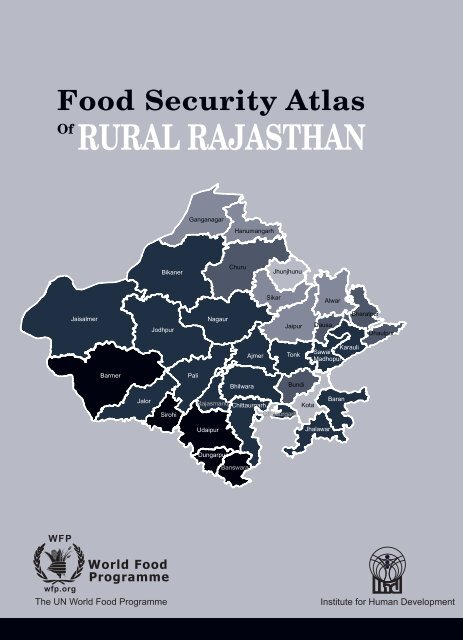
Food Security Atlas<br />
Of<br />
RURAL RAJASTHAN<br />
Ganganagar<br />
Hanumangarh<br />
Bikaner<br />
Churu<br />
Jhunjhunu<br />
Sikar<br />
Alwar<br />
Jaisalmer<br />
Jodhpur<br />
Nagaur<br />
Jaipur<br />
Dausa<br />
Bharatpur<br />
Dhaulpur<br />
Ajmer<br />
Tonk<br />
Karauli<br />
Sawai<br />
Madhopur<br />
Barmer<br />
Pali<br />
Bhilwara<br />
Bundi<br />
Jalor<br />
Sirohi<br />
Rajasmand<br />
Chittaurgarh<br />
Chittaurgarh<br />
Kota<br />
Baran<br />
Udaipur<br />
Jhalawar<br />
Dungarpur<br />
Banswara<br />
World Food<br />
Programme<br />
The UN World Food Programme
Food Security Atlas<br />
Of<br />
RURAL RAJASTHAN<br />
UN World Food Programme<br />
2 Poorvi Marg, Vasant Vihar<br />
New Delhi 110057<br />
www.wfp.org<br />
Institute for Human Development<br />
NIDM Building, IIPA Campus<br />
New Delhi 110002<br />
www.ihdindia.org<br />
i
Copyright © 2009<br />
UN World Food Programme (WFP)<br />
2, Poorvi Marg<br />
Vasant Vihar<br />
New Delhi - 110057<br />
Maps not to scale<br />
Published by:<br />
Institute for Human Development<br />
NIDM Building, IIPA Campus, 3 rd Floor, IP Estate<br />
Mahatma Gandhi Marg, New Delhi – 110002<br />
Website: www.ihdindia.org; Email: ihd@vsnl.com<br />
Design by:<br />
CELLULOID<br />
C-45, Ground Floor, Pandav Nagar, Delhi 110 092<br />
Tel.: 98737 98727, 011-22487531<br />
e-mail: celluloid@gmail.com<br />
Layout, Typesetting and Printed by:<br />
PRINT-WAYS<br />
G-19, IInd Floor, Vijay Chowk, Laxmi Nagar, Delhi - 110 092<br />
Tel.: 011-22514076, 9990563789, 9899094076<br />
e-mail: printways@gmail.com; printways@rediffmail.com<br />
Price Rs. 400/-<br />
ii
RESEARCH TEAM<br />
Institute for Human Development<br />
Dev Nathan<br />
Preet Rustagi<br />
Dalbir Singh<br />
Sandip Sarkar<br />
Sunil Kumar Mishra<br />
Abhay Kumar<br />
Payel Dutta Majumdar<br />
UN World Food Programme<br />
Minnie Mathew<br />
Nisha Srivastava<br />
Pradnya Paithankar<br />
Bal Paritosh Dash<br />
Animesh Kumar<br />
iii
TECHNICAL ADVISORY GROUP<br />
Chairperson<br />
Prof. Abhijit Sen, Member, Planning Commission<br />
Members<br />
Dr.. Indu Agnihotri, Centre for Women’s Development Studies, New Delhi<br />
Dr. V. Athreya, M S Swaminathan Research Foundation, Chennai<br />
Prof. Ramesh Chand, National Professor, National Centre for Agricultural Policy,<br />
New Delhi<br />
Ms. Anita Chaudhuri, Joint Secretary, Department of Food and Public<br />
Distribution<br />
Prof. R. S. Deshpande, Institute for Social and Economic Change, Bangalore<br />
Prof. Mahendra Dev, Centre for Economic and Social Studies, Hyderabad<br />
Dr. Amaresh Dubey, National Council for Applied Economic Research<br />
Mr. N. D. George, Director, Planning Commission<br />
Prof. S. R. Hashim, Director, Institute for Studies in Industrial Development,<br />
New Delhi<br />
Dr. P. K Joshi, Director, National Centre for Agricultural Policy, New Delhi<br />
Prof. K. P. Kannan, National Commission for Enterprises in the Unorganized<br />
Sector<br />
Prof. Amitabh Kundu, Jawaharlal Nehru University<br />
Dr. Minnie Mathew, World Food Programme<br />
Mr. A. K. Mathur, Director, National Sample Survey Organization<br />
Prof. Aasha Kapur Mehta, Chronic Poverty Research Centre, Indian Institute<br />
for Public Administration, New Delhi<br />
Prof. T. S. Papola, Delhi Government Chair in Human Development, Institute<br />
for Human Development<br />
Prof. R. Radhakrishna, Indira Gandhi Institute for Development Research,<br />
Mumbai<br />
Dr. D. Narsimha Reddy, Former Professor, University of Hyderabad<br />
Dr. Rukmini, M S Swaminathan Research Foundation, Chennai<br />
Prof. Vidya Sagar, Institute for Development Studies, Jaipur<br />
Dr. Abusaleh Shariff, National Council for Applied Economic Research<br />
Prof. A.K.Singh, Giri Institute for Development Studies, Lucknow<br />
Prof. R. S. Srivastava, National Commission for Enterprises in the Unorganized<br />
Sector<br />
Prof. Prem Vashishtha, Institute for Human Development.<br />
iv
izks- vfHkthr lsu<br />
Prof. ABHIJIT SEN<br />
lnL;<br />
;kstuk vk;ksx<br />
;kstuk Hkou<br />
ubZ fnYyh&&110 001<br />
MEMBER<br />
PLANNING COMMISSION<br />
YOJANA BHAWAN<br />
NEW DELHI-110 001<br />
F O R E W O R D<br />
Food Security has now taken centre stage in policy discussions around the world. Along<br />
with issues of food production there are also clearly issues of access of the poor to food.<br />
In India, despite high GDP growth rates over the past decade or so, the record in reducing<br />
hunger is not so impressive. This brings to the fore the question of inclusive growth,<br />
particularly the inclusion of the most deprived sections of our society and regions of our<br />
country into benefiting from the growth process. Increased access to food comes forward<br />
as a basic component of inclusive growth.<br />
It is apt that at such a time the Institute for Human Development (IHD) and the UN’s World<br />
Food Programme (WFP) have produced this set of Rural Food Security Atlases for 8 States<br />
of India.<br />
Constructing a Food Security Index (FSI) the authors have tried to identify the districts that<br />
fare particularly badly and the factors behind the poor performance of these districts in<br />
each of the States. The identification of regions and social groups that are most food<br />
insecure should help to draw attention to the regions and social groups that require most<br />
attention in order to reduce food insecurity. At the same time, analysis of factors behind<br />
poor food security should help direct district-level interventions towards dealing with the<br />
factors that seem to be behind poor food security in these districts.<br />
The authors argue while paying attention to increasing food supply, it is critical to pay<br />
attention to improving the access of the poor to adequate food. They identify improvements<br />
in infrastructure and in the position of women as central to improving food security.<br />
I hope the Atlases will stimulate discussion among policy makers and social analysts on<br />
ways of designing district-level interventions that would enable India to reduce hunger as<br />
part of inclusive growth.<br />
[ABHIJIT SEN]<br />
nwjHkk"k % 23096564 VsyhQSDl % 23096565<br />
Telephone: 23096564 Telefax : 23096565 e-mail: abhijitsen@yojana.nic.in<br />
v
Preface<br />
India is home to more than a quarter of the hungry people in the world. The effect of climate change on<br />
agriculture will adversely affect Indian agriculture, thereby making food availability scarce. The existing production<br />
levels barely manage to keep pace with the growing population, a problem that is aggravated by high<br />
disparities in resources and purchasing power.<br />
The changing scenario of rising food prices has raised new concerns about food security. It has been estimated<br />
that globally 130 million more people have become food insecure due to high food prices, in addition to the<br />
existing 850 million. Soaring prices would require providing top priority to ensuring access to food by the<br />
most vulnerable, which can be achieved through expanded safety net programmes such as the PDS, and<br />
those programmes which address the nutritional status of pregnant and lactating women, and children of less<br />
than five years of age.<br />
The prevalence of underweight children in India is among the highest in the world. Over 50 million children<br />
under five years are malnourished. There are multiple causes of this phenomenon. Looking at the problem<br />
spatially, a relatively small number of states, districts, and villages account for a large share of the problem<br />
– 5 states and 50 percent of villages account for about 80 percent of the malnutrition cases.<br />
Therefore, the need of the hour is a comprehensive strategy to tackle the growing menace of food and nutritional<br />
insecurity. In a country of continental dimensions with vast disparities, it is pertinent that developmental efforts<br />
be directed in specific directions and in specific areas for optimum utilization of resources.<br />
To map food insecurity in the country, the World Food Programme had come out with a series of food<br />
insecurity atlases in collaboration with the M.S. Swaminathan Research Foundation. The most significant<br />
contribution of these atlases was to mainstream the issue of food security, besides identifying their incidence<br />
among the major states.<br />
As a corollary to these atlases, on behalf of the WFP, the Institute for Human Development has prepared statespecific<br />
atlases with comprehensive analysis at district and regional levels. Looking through the child nutrition<br />
lens in view of prevalence of underweight children, and under-five mortality, these atlases help in identifying the<br />
districts at various levels of food security within the most food insecure states. This will help in convergence of<br />
complementary programmes of the government in addressing undernutrition and child mortality in the country.<br />
We are deeply indebted to all the members of the Technical Advisory Group (TAG), constituted to provide<br />
direction and technical inputs to the report. We would like to express our sincere gratitude to the TAG chairperson<br />
Prof. Abhijit Sen, Member, Planning Commission for his encouragement and deep involvement in this project.<br />
Much of the credit for bringing out this publication goes to Dr. Dev Nathan, Professor, and Dr. Preet Rustagi,<br />
Senior Fellow, who coordinated the study from IHD; Dr. Sandip Sarkar, who provided the technical advice,<br />
especially the construction of the indices; and Dr. Sunil Mishra and Ms. Payel Dutta Majumder who executed<br />
the work of calculation of indices and analyzing the data and Dr. Abhay Kumar who helped in finalising the<br />
report. We would also like to express our gratitude to Dr. Minnie Mathew, Head of Programme Unit, WFP-India<br />
for providing her guidance to the study; Dr. Nisha Srivastava, who led the project in WFP; Mr. Bal Paritosh Dash,<br />
Ms. Pradnya Paithankar and Mr. Animesh Kumar for providing their critical inputs.<br />
We hope that the atlases will serve as a tool for the government and policymakers to target interventions more<br />
effectively and fine-tune assistance strategies to target the most vulnerable groups and areas. An important<br />
outcome of this exercise is a systematic and integrated food security information system located within the<br />
state governments. Finally, it will enhance advocacy at the state level so as to direct policy focus, resources<br />
and initiatives to the most food insecure.<br />
Alakh N. Sharma<br />
Director,<br />
Institute for Human Development<br />
Mihoko Tamamura<br />
Representative & Country Director,<br />
World Food Programme – India<br />
vii
viii
Acknowledgements<br />
The preparation of food security atlases for eight states would not have been possible without the<br />
joint efforts of various organizations, individuals and government officials. The primary input for<br />
construction of the indices as well as formulation of appropriate indicators came from reliable<br />
disaggregated sub-state level data, which was collected, collated and mined from secondary sources<br />
as well as the information made available by various state departments and ministries. We wish to<br />
thank all of them for their support and assistance. We are grateful to the Department for International<br />
Development (DFID) for funding the project through the Global Institutional Support Grant to WFP.<br />
The Chairperson of the Technical Advisory Group (TAG), Prof. Abhijit Sen, Member, Planning<br />
Commission and other members of the TAG deserve a special mention for all the deliberations and<br />
their expert advice to the research team from time to time. Many of them were also available at short<br />
notice to help us resolve problems, provide solutions and show the way forward.<br />
The Rajasthan state report was prepared with inputs from numerous resource persons and regional<br />
institutions, which also helped in the organization of state consultations. We acknowledge Dr. Surjit<br />
Singh, Director, Institute for Development Studies, Jaipur and other staff who helped us in the collection<br />
and collation of state specific resource material and data, and also in the organization of the state<br />
consultation. We would like to thank the resource persons for their facilitation and active participation<br />
during the state level consultation and also for providing constructive comments to enrich the quality<br />
of the reports.<br />
A preparatory workshop was organized on 2 May, 2007 in Jaipur. This was chaired by Dr. V.S. Vyas,<br />
Professor Emeritus and Chairman, Governing Board, IDS and was attended by experts from the<br />
state government, academia, and civil society organizations. The insights and active participation of<br />
some of the experts deserve special mention – Mr. S.M. Meena, Labour Commissioner, Government<br />
of Rajasthan; Mr. I.C. Srivastava, Retired IAS; Mr. Mukesh Chand Gupta, Deputy Secretary, Food<br />
and Civil Supply, Government of Rajasthan; Prof. Anju Kohli and Dr. Arun Prabha Chaudhury from<br />
the Department of Economics, MLS University, Udaipur; Mr. Alok, Centre for Community Economics<br />
and Development Consultant Society (CECODECON); Ms. Nisha Sidhu, NFIW; Mr. Niranjan Sharma,<br />
Director, SOHARD, Alwar; Mr. Manohar Singh Rathore, Social Worker, Udaipur; Dr. Sunita and Mr.<br />
Sharique Mashhadi from Seva Mandir, Udaipur; Ms. Arti Joshi, Anubhuti Sansthan, Chittorgarh; Dr.<br />
M.M. Sheikh, ISDESR, Churu; and faculty from IDS - Prof. M. S. Rathore, Prof. Vidya Sagar, Prof.<br />
Sunil Ray, Prof. Pradeep Bhargava, Prof. Kanchan Mathur, Dr. P. R. Sharma, Prof. K.N. Joshi, Dr.<br />
Shobita Rajagopal and Dr. Varsha Joshi; among many others. The enthusiasm for the project that<br />
was evident at the state consultation has been a great source of inspiration for us.<br />
We would like to thank Mr. Michael Sheinkman, WFP Senior Regional Programme Adviser for<br />
Vulnerability Analysis and Mapping in WFP’s Regional Bureau at Bangkok, for his presentation and<br />
participation in the state consultation.<br />
ix
We would like to thank Ms. Mihoko Tamamura, the current Representative and Country Director of<br />
WFP – India, Mr. GianPietro Bordignon, former Representative and Country Director, and Mr.<br />
Dominique Frankefort, Deputy Country Director for their encouragement at every stage.<br />
The smooth execution of this project would not have been feasible without constant support and<br />
inspiration from Prof. Alakh N. Sharma, Director, IHD. He steered the course of ideas and discussions<br />
during the entire period of the project.<br />
We also wish to acknowledge the research and data support received from many individuals in the<br />
course of the project period. These include Ms. Piyali Das, who undertook the literature review<br />
during the initial phase of the project; Mr. Pinaki Joddar and Mr. Balwant Singh Mehta, who very ably<br />
mined large data sets of the NSSO for extracting relevant information and provided additional research<br />
inputs; and Mr. Anand Shukla who helped in provided critical inputs to the report.<br />
The support received from IHD administration, especially Mr. Prem Chandra, Ms. Jyoti Girish, Ms.<br />
Madhavi Chauhan, Ms. Nidhi Sharma, Mr. Sanjay Kumar and Mr. Phalguni Singh needs special<br />
mention. We also wish to thank Mr. S.P. Sharma for all the typing and pagesetting work, Ms. Shashikala<br />
Menon and Ms. Angela S. Nath for copyediting, Mr. Yatinder Bisht for designing, Mr. Nitin Chauhan<br />
for formatting, and the S.P. Printech for the printing support.<br />
- IHD and WFP Research Team<br />
x
Contents<br />
Foreword<br />
Preface<br />
Acknowledgements<br />
List of Tables, Figures, Maps and Boxes ....................................................................................<br />
List of Abbreviations .....................................................................................................................<br />
Executive Summary .................................................................................................................. 1<br />
1. Introduction ........................................................................................................................ 5<br />
1.1 What is Food Security<br />
1.2 Structure of the Report<br />
2. A Profile of the state of Rajasthan ................................................................................ 10<br />
2.1 Agro-Climatic Regions<br />
2.2 National Sample Survey Regions<br />
2.3 Economy<br />
2.3.1 Sectoral Composition of State Economy<br />
2.3.2 Participation of Workers and Gross State Domestic Product (GSDP)<br />
2.3.3 Poverty Status<br />
2.4 Environmental Conditions<br />
2.5 Socio-economic status<br />
2.5.1 Social Group-wise Composition of Households<br />
2.5.2 Occupation-wise distribution of Households<br />
2.5.3 Urbanization<br />
2.6 Health and Nutritional Status<br />
2.6.1 Nutritional status<br />
2.6.2 Immunization of Children<br />
3. Analysis of Food Security ............................................................................................... 27<br />
3.1 Measuring Food Security Status<br />
3.2 Explaining Food Security<br />
3.2.1 Food Availability<br />
3.2.2 Food Access<br />
3.2.3 Food Absorption<br />
3.3 Food Security Index<br />
4. Food Availability ............................................................................................................... 40<br />
4.1 Agricultural Growth<br />
4.2 Per capita Value of Agricultural Output<br />
4.3 Per-Capita Value of Livestock Product<br />
4.4 Coverage of Irrigation Facilities<br />
4.5 Status of Road Connectivity<br />
4.6 Coverage of Forest areas<br />
4.7 Food Availability Index<br />
5. Access to Food ................................................................................................................ 53<br />
5.1 Rural Wages<br />
5.2 Average Per Capita Monthly Expenditure<br />
5.3 Agricultural Labourers<br />
xi
5.4 Proportion of ST and SC in Population<br />
5.5 Ratio of Working Age Population<br />
5.6 Rural Female Literacy<br />
5.7 Women's Work Participation Rate<br />
5.8 Food Access Index<br />
6. Food Absorption .............................................................................................................. 71<br />
6.1 Access to Primary Health Services<br />
6.2 Access to Safe Drinking Water<br />
6.3 Food Absorption Index<br />
7. Addressing Food Insecurity in Rajasthan .................................................................... 79<br />
7.1 Food Security Index<br />
7.2 Identifying Priority Districts<br />
7.2.1 Status of Availability Indicators<br />
7.2.2 Status of Access Indicators<br />
7.2.3 Status of Absorption Indicators<br />
7.3 Strategies for Promoting Food Security<br />
7.3.1 Enhancing Availability<br />
7.3.2 Improving Access to Food<br />
7.3.3 Enhancing Absorption<br />
7.4 Improving Performance<br />
8. Conclusion: Towards A Food Secure Rajasthan ....................................................... 104<br />
References .............................................................................................................................. 112<br />
Appendix I: The Right to Food ............................................................................................ 115<br />
Appendix II: Food Security Index (FSI) - A Methodological Note................................... 119<br />
Appendix III: Index Value, Normative Value and Key Food Security Intervention ........ 124<br />
xii
List of Tables, Figures, Maps and Boxes<br />
Table 2.1: Net State Domestic Product and Poverty Status, 2004-05 13<br />
Table 2.2: Sectoral Composition of NSDP (TE 2004-05) 14<br />
Table 2.3: Share (Per cent) of Different Sector to total GSDP at 1993-94 Prices 15<br />
Table 2.4: Average Annual Growth Rate of GSDP in Rajasthan, 1994-05 16<br />
Table 2.5: Percentage of GSDP and Worker in Rajasthan, 2004-05 16<br />
Table 2.6: Environmental Limitations to Agricultural Development 18<br />
Table 2.7: Socio-Economic Status of Major States (All Figures in Percentages) 19<br />
Table 2.8: Region-wise per cent Share of Poor and All Households by Social Group for Rural Rajasthan (2004-05) 20<br />
Table 2.9: Region-wise Share of Poor and All Households by Household Type for Rural Rajasthan (2004-05) 21<br />
Table 2.10: Status of Urbanization 22<br />
Table 2.11: Mortality and Nutritional Status of Children and Women 24<br />
Table 2.12: Status of Consumption 25<br />
Table 2.13: Nutritional Status of Children (NFHS I, II, III) 25<br />
Table 2.14: Immunization of Children 26<br />
Table 3.1: Correlation between Micronutrient Intake and Under-nutrition and Mortality Status 29<br />
Table 3.2: Indicators used to compute Food Security Outcome Index (FSOI) 30<br />
Table 3.3: Status of Districts in Terms of FSOI 31<br />
Table 3.4: Rajasthan - Indicators Used to Analyze Food Security 38<br />
Table 4.1: Growth of Agricultural GDP and GSDP across States 40<br />
Table 4.2: Level of Agricultural Development 42<br />
Table 4.3: Per Capita Value of Agricultural Output in Rajasthan 43<br />
Table 4.4: Extent of Irrigation (Net Irrigated Area to Net Sown Area) 45<br />
Table 4.5: Percentage of Villages Having Access to Paved Road 47<br />
Table 4.6: Proportion of Forest Area in Rural Rajasthan 48<br />
Table 4.7: Indicators used to Compute Availability Index 51<br />
Table 4.8: Status of Districts in Availability Index 52<br />
Table 5.1: Wage Rate of Casual Workers, 2005 54<br />
Table 5.2: Status of Rural Wages in the Districts of Rajasthan 55<br />
Table 5.3: Monthly Per Capita Expenditure on Food, 2004-05 56<br />
Table 5.4: Monthly Per Capita Consumption Expenditure by District, 2004-05 (Rs.) 56<br />
Table 5.5: Proportion of Agricultural Labourers n Workforce, 2001 58<br />
Table 5.6: Share of Agricultural Labour Force in Rajasthan 58<br />
Table 5.7: Percentage of Scheduled Tribes and Scheduled Castes in the Rural Population by State 60<br />
Table 5.8: Proportion of SC and ST in Rural Population in Rajasthan, 2001 61<br />
Table 5.9: Ratio of Working Age Population, 2001 62<br />
Table 5.10 Ratio of Rural Working Age Population in Rajasthan, 2001 63<br />
Table 5.11: Status of Rural Female Literacy, 2001 64<br />
Table 5.12 Status of Rural Female Literacy in Rajasthan, 2001 (%) 65<br />
Table 5.13: Women's Work Participation Rate in Rural Rajasthan, 2001 (%) 66<br />
Table 5.14: Indicators used to Compute Food Access Index in Rajasthan 69<br />
Table 5.15: Status of Districts on Food Access Index 70<br />
Table 6.1: Factors Determining Status of Absorption 71<br />
Table 6.2: Access to PHCs (in per cent of villages), 2001 73<br />
Table 6.3: Access to Safe Drinking Water in Rural Rajasthan (in per cent of Households) 75<br />
Table 6.4: Indicators used to Compute Absorption Index 77<br />
Table 6.4: Status of Districts in terms of Food Absorption Index 78<br />
Table 7.1: Status of Districts in Terms of FSI 79<br />
Table 7.2: Ranks of Districts on Composite Food Security Index and Components 81<br />
Table 7.3: Priority Food Security Intervention Districts of Rajasthan by Criteria 82<br />
Table 7.4: Districts Under NFSM in Rajasthan 87<br />
xiii
Table 7.5: Percentage Share of Poor and Nearly Poor Household Who Have Ration 92<br />
Cards or Benefited from Various Scheme in Rural Rajasthan (2004-05) 87<br />
Table 7.6: Status of Public Interventions (ICDS Coverage) 94<br />
Table 7.7: NREGS Performance , April 2008 95<br />
Table 7.8: NREGA Statistics of Rajasthan, April 2008 96<br />
Table 8.1: Key Interventions in Priority Districts 110<br />
Table A2.1: Choice of Indicators, Sources, Reference Year and Calculating Procedure in Rajasthan 119<br />
Table A3.1: Index Value and Normative Value of Availability Variables 124<br />
Table A3.2: Index Value and Normative Value of Access Variables 125<br />
Table A3.3: Index Value and Normative Value of Absorption Variables 126<br />
Table A3.4: Key Food Security Interventions in Districts of Rajasthan 127<br />
List of Figures<br />
Figure 2.1: Region-wise Percentage Share of Poor Households by Social Group for Rural Orissa (2004-05) 17<br />
Figure 7.1: Allocation Proposed under NFSM 85<br />
Figure 7.2: Bharat Nirman Physical Target in Rajasthan (km) 90<br />
Figure 7.3: Water Quality Affected Habitations 100<br />
List of Maps<br />
Map 2.1: Rajasthan: National Sample Survey Regions 12<br />
Map 2.2: Level of Urbanization 23<br />
Map 3.1: Food Security Outcome Map of Rajasthan 32<br />
Map 4.1: Status of Agricultural Production 43<br />
Map 4.2: Share of Irrigated Area 45<br />
Map 4.3: Status of Rural Connectivity 47<br />
Map 4.4: Share of Area under Forests 49<br />
Map 4.5: Food Availability Map of Rural Rajasthan 50<br />
Map 5.1: Wage Rates of Rural Population 54<br />
Map 5.2: Status of Consumption Expenditure 57<br />
Map 5.3: Share of Agricultural Labourers in Total Working Population 59<br />
Map 5.4: Proportion of Scheduled Castes and Scheduled Tribes in Total Rural Population 62<br />
Map 5.5: Share of Rural Working Age Population 63<br />
Map 5.6: Status of Female Literacy 65<br />
Map 5.7: Women Workforce Participation Rate 67<br />
Map 5.8: Food Access Map of Rural Rajasthan 68<br />
Map 6.1: Access to Health Services in Rural Areas 73<br />
Map 6.2: Access to Safe Drinking Water in Rural Areas 74<br />
Map 6.3: Food Absorption Map of Rural Rajasthan 76<br />
Map 7.1: Food Security Map of Rural Rajasthan 80<br />
Map 7.2: Priority Districts for Food Security Interventions in Rural Rajasthan 83<br />
List of Boxes<br />
Box 3.1: Towards MDG - 4 29<br />
Box 4.1: Agricultural Production and Food Security 41<br />
Box 7.1: National Policy for Farmers, 2007 88<br />
Box 7.2: The Forest Rights Act 91<br />
Box 7.3: Innovative Schemes for Ensuring Nutritional Security 92<br />
Box 7.4: Improved Targeting in the Public Distribution System 93<br />
Box 7.5: NREGA and Food Security 95<br />
Box 7.5: Innovative Food Security Initiatives: The Food for Work Programme in Tribal Development Projects 97<br />
Box 7.6: Meeting the Nutritional Needs of Vulnerable Groups 102<br />
xiv
List of Abbreviations<br />
ADAPT<br />
AIDIS<br />
APL<br />
ARWSP<br />
BMI<br />
BPL<br />
CMR<br />
CSO<br />
DLHS<br />
DPAP<br />
FAO<br />
FCI<br />
FFS<br />
FSI<br />
FSO<br />
FSOI<br />
GSDP<br />
HYV<br />
ICDS<br />
ICT<br />
IFAD<br />
IHD<br />
IIPS<br />
IMR<br />
LTAP<br />
MDGs<br />
MDM<br />
MPCE<br />
MSSRF<br />
NCEUS<br />
NCRL<br />
NFHS<br />
NFSM<br />
NREGA<br />
NREGS<br />
NSDP<br />
NSS<br />
NTFP<br />
NWDPRA<br />
OBC<br />
Area Development Approach for Poverty Termination<br />
All-India Debt and Investment Survey<br />
Above Poverty Line<br />
Accelerated Rural Water Supply Programme<br />
Body Mass Index<br />
Below Poverty Line<br />
Child Mortality Rate<br />
Central Statistical Organization<br />
District-level Household Survey<br />
Drought Prone Area Programme<br />
Food and Agriculture Organization<br />
Food Corporation of India<br />
Farmers’ Field School<br />
Food Security Index<br />
Food Security Outcome<br />
Food Security Outcome Index<br />
Gross State Domestic Product<br />
High Yielding Variety<br />
Integrated Child Development Services<br />
Information and Communication Technology<br />
International Fund for Agricultural Development<br />
Institute for Human Development<br />
International Institute for Population Sciences<br />
Infant Mortality Rate<br />
Long Term Action Plan<br />
Millennium Development Goals<br />
Mid-Day Meal<br />
Monthly Per Capita Expenditure<br />
M S Swaminathan Research Foundation<br />
National Commission for Enterprises in the Unorganized Sector<br />
National Commission on Rural Labour<br />
National Family Health Survey<br />
National Food Security Mission<br />
National Rural Employment Guarantee Act<br />
National Rural Employment Guarantee Scheme<br />
Net State Domestic Product<br />
National Sample Survey<br />
Non-Timber Forest Product<br />
National Watershed Development Project for Rainfed Areas<br />
Other Backward Class<br />
xv
PDS<br />
PESA<br />
PHC<br />
PMGSY<br />
RLTAP<br />
RTI<br />
RGMWM<br />
SC<br />
SCA<br />
SCP<br />
SHG<br />
ST<br />
TE<br />
TSP<br />
UNICEF<br />
WFP<br />
WFS<br />
WHO<br />
Public Distribution System<br />
The Panchayats (Extension to Scheduled Areas) Act<br />
Primary Health Centre<br />
Pradhan Mantri Gram Sadak Yojana<br />
Revised Long Term Action Plan<br />
Right to Information Act<br />
Rajiv Gandhi Mission for Watershed Management<br />
Scheduled Caste<br />
Special Central Assistance<br />
Special Component Plan<br />
Self-Help Group<br />
Scheduled Tribe<br />
Triennium Ending<br />
Tribal Sub Plan<br />
United Nations’ Children Fund<br />
World Food Programme<br />
World Food Summit<br />
World Health Organization<br />
xvi
Executive Summary<br />
Executive Summary<br />
Food security is not just a matter of the availability of food, but more of the access of households and<br />
individuals to sufficient nutritious food. The nutritional status of an individual is also influenced by access<br />
to safe drinking water, facilities for hygiene and sanitation. Consequently, food security is analyzed along<br />
the axes of availability, access and absorption. The importance of entitlements in food security is further<br />
underlined by the Supreme Court’s judgments validating the Right to Food. As a signatory to the UN’s<br />
Millennium Development Goals (MDGs), the Government of India and all state governments have an<br />
obligation to reduce by half the proportion of people suffering from hunger by 2015.<br />
As a step towards the above goals, the Institute for Human Development (IHD), on behalf of the UN’s<br />
World Food Programme (WFP), has undertaken an analysis of the dimensions of food security at the<br />
sub-state or district level for 8 states of India – Orissa, Jharkhand, Chhattisgarh, Madhya Pradesh,<br />
Rajasthan, Bihar, Uttar Pradesh and Maharashtra. The purpose of this exercise is to:<br />
l<br />
l<br />
Identify the districts/regions and social groups most affected by food insecurity; and<br />
Suggest policy interventions for improving food security among food insecure regions and social<br />
groups.<br />
Recognizing that reduction of acute poverty is the key to reducing hunger, the analysis began by<br />
choosing likely variables that affect food security along the three axes of availability, access and<br />
absorption. A composite index is derived, based on twelve identified indicators reflecting these three<br />
dimensions. The availability-related variables considered here are agricultural production in per capita<br />
value terms, proportion of forest area, extent of irrigation and rural connectivity in terms of villages<br />
with access to paved roads. The six variables considered for access to food dimension include<br />
proportion of agricultural labourers, ratio of working-age population, monthly per capita consumption<br />
expenditure, casual wage rate of rural persons and female literacy rate. Access to safe drinking water<br />
and primary health services are the two variables considered for absorption index.<br />
The values of districts on each of these twelve variables were combined to develop a Food Security<br />
Index (FSI), on the basis of which each district was ranked. Districts were also ranked by their<br />
performance in food security outcome (FSO) measures, which include under-five mortality and proportion<br />
of underweight children.<br />
The most food insecure districts in Rajasthan are located in the sub-humid southern plains and western<br />
arid plain.<br />
The areas requiring priority attention are:<br />
l<br />
l<br />
whole southern region, including Banswara, Dungarpur, Rajsamand and Udaipur;<br />
8 out of 11 districts in the western arid region, including Barmer, Jaisalmer, Pali, Sirohi, Bikaner,<br />
Jalor, Nagaur and Jodhpur;<br />
EXECUTIVE SUMMARY<br />
1
l<br />
l<br />
6 districts namely Ajmer, Bhilwara, Karauli, Sawai Madhopur, Tonk and Dholpur, out of the<br />
total 12 districts in the notheastern region; and<br />
4 of the 5 districts of southeastern region, including Baran, Chittaurgarh, Jhalawar and Bundi.<br />
The irrigated north-western districts, parts of the humid southeastern plain and certain districts in the<br />
inland drainage region and the semi-arid eastern plain are relatively secure regions.<br />
Priority Districts for Food Security Intervention<br />
North Eastern South Eastern Southern Western<br />
Ajmer Baran Banswara Barmer<br />
Bhilwara Chittaurgarh Dungarpur Jaisalmer<br />
Karauli Jhalawar Rajsamand Pali<br />
Sawai Madhopur Bundi Udaipur Sirohi<br />
Tonk<br />
Bikaner<br />
Dhaulpur<br />
Jalor<br />
Nagaur<br />
Jodhpur<br />
Many of these districts are inharited by a high proportion of Scheduled Tribe (ST) population, while in<br />
some of these districts, there is also a high proportion of Scheduled Castes (SC). These areas also<br />
have a high proportion of agricultural labourers and low wage rates. Women's literacy rate is also<br />
dismal in these districts, which is taken as a proxy for women's status. Rural connectivity too is poor<br />
in most of these food insecure districts.<br />
The above social and economic characteristics together suggest that food security interventions need<br />
to be designed along the following lines:<br />
n<br />
Policy and enabling measures for development of livelihoods of hill-forest-based populations. This<br />
itself comprises a number of measures, including:<br />
• Implementation of the Forest Rights Protection Act so as to provide security of tenure<br />
• Investments to enable a shift to production of high value crops<br />
2 FOOD SECURITY ATLAS OF RURAL RAJASTHAN
• Expansion of irrigation in a manner appropriate to hill and plateau regions<br />
• Improvement of rural connectivity, to reduce transaction and transport costs and increase<br />
economic opportunities.<br />
n<br />
For Scheduled Castes, other agricultural labourers and small farmers in the plains:<br />
• Distribution of land to the landless (including women), large numbers of whom would be from<br />
the Scheduled Castes<br />
• Development of non-farm enterprises and agricultural diversification, so as to increase<br />
absorption of labour<br />
Rajasthan being a water-deficit state, in order to increase the income of small and marginal farmers<br />
and thus their access to food and also for the agricultural development of the state as a whole, it is<br />
necessary to pay attention to development of high-value crops, that use less water.<br />
Further, livestock plays an important role in the state’s economy. Increasing income from livestock,<br />
through a number of measures (improvement in breeds, developing production chains as for milk,<br />
improving marketing systems, improving management and productivity of grazing lands, etc.) are<br />
necessary for improving food security in its vast desert regions.<br />
Avenues to agricultural development in an environmentally difficult state such as Rajasthan are restricted.<br />
This calls for development of the secondary and tertiary sectors and the transfer of workers from the<br />
primary to these sectors, as part of the strategy to improve food security.<br />
Our analysis corroborates what is generally accepted in the development literature, that reducing gender<br />
inequality and empowering women is a key factor in the improvement of food security. For this, measures<br />
include:<br />
• Improvement in women’s literacy<br />
• Securing women’s right to land and other productive assets<br />
• Increasing women’s access to micro-finance<br />
All these are medium-term development measures that would have a positive impact on access to<br />
food by the poorest. There is an urgent need to widen the reach and improve the functioning of shortterm<br />
food access measures, such as under the National Rural Employment Guarantee Act (NREGA),<br />
EXECUTIVE SUMMARY<br />
3
or the Mid-Day Meals Scheme, and link them with the medium term development interventions. It is<br />
through such schemes of employment and schooling; the PDS and ICDS, that the Right to Food is<br />
currently realizable. The challenge is to link schemes of short-term food access with medium-term<br />
development interventions, which alone can provide a stable basis for food security. Realizing the Right<br />
to Food is not just about improving the functioning of government schemes or the administration but<br />
about mobilizing more and more people, women and men, to assert their democratic will over the<br />
political and administrative processes. Rajasthan, through its pioneering initiatives on the Right to<br />
Information and Social Audits (Jan Sunvais) has made a good beginning in this area; steps that can be<br />
consolidated in realizing food security and the Right to Food.<br />
4 FOOD SECURITY ATLAS OF RURAL RAJASTHAN
1. Introduction<br />
1. Introduction<br />
India has seen in impressive growth rate in the last decade with the GDP averaging more than 7 per<br />
cent per annum. Despite this rapid growth, India is still home to more than a quarter of the hungry<br />
people in the world. Rapid growth has not translated into a commensurate reduction in poverty and<br />
hunger. The current turmoil in world food markets, with sharp rises in food prices, and the recent global<br />
economic downturn together threaten to make the food security situation in India even worse. Despite<br />
significant achievements in food grain production, high incidence of hunger and undernutrition continue<br />
to plague the country.<br />
These vicissitudes bring home the stark truth that food security is a critical and continuing challenge<br />
and there is no place for complacency on this front. In 1996, the World Food Summit (WFS) and<br />
subsequently the Millennium Development Goals (MDGs) recognized the importance of achieving<br />
food security and reducing hunger by half by the year 2015.<br />
As a following to the WFS, a 2002 assessment called ‘World Food Summit — Five Years Later,’ pointed<br />
out that there has been a decrease in hunger at the rate of 8 million people per year across the world.<br />
But in order to achieve the goal of reducing world hunger by half by 2015, it is necessary to reduce the<br />
incidence of malnutrition by 15 million per year. Continuing to implement the current economic, political<br />
and social policies will not enable the world to reach this goal by 2015. A mid-course correction in<br />
these policies is needed in order to achieve the above stated goals.<br />
Despite India recording a high rate of economic growth in recent years, there is a major concern with the<br />
failure of that growth to translate into a somewhat proportionate reduction in poverty and malnutrition.<br />
The problem of large-scale famine-related starvation deaths seems to have been largely resolved, partly<br />
due to combined efforts from vigilant civil society and media. Nonetheless, there are periodic reports of<br />
malnutrition and starvation from different parts of the country; particularly from the politically marginal<br />
social groups, the Scheduled Tribes (STs) and Scheduled Castes (SCs). Besides this problem of starvation<br />
among the STs, there is the pervasive incidence of malnutrition, particularly of children and women. Even<br />
sustained increases in income have not resulted in commensurate improvements in their nutritional status.<br />
The persistence of malnutrition and the reported occurrence of starvation deaths together define the<br />
nature of the current problem of food insecurity within a situation of overall adequate availability of<br />
foodgrains. The fact that they occur within a situation of adequate foodgrain availability (domestic<br />
foodgrain production plus amounts released from government stocks plus imports made possible by<br />
India’s burgeoning foreign exchange reserves), serves to underline the importance of framing adequate<br />
policies and interventions to ensure food security, or access to food, for not just households, but also<br />
individuals. It also provides the rationale for this report, prepared by the Institute for Human Development<br />
(IHD), on behalf of the United Nations’ World Food Programme (WFP).<br />
The UN World Food Programme and the M S Swaminathan Research Foundation (MSSRF) earlier<br />
collaborated in analyzing the food insecurity situation in various states in the country. Using chosen<br />
indicators to map the relative standing of states with regard to food security, MSSRF and WFP prepared<br />
INTRODUCTION<br />
5
the Food Insecurity Atlas of Rural India in 2001. This was followed by the Food Insecurity Atlas of Urban<br />
India in 2002. The third in the series, the Atlas of Sustainability of Food Security was launched in 2004.<br />
In 2009, UN WFP & MSSRF brought out an update of food insecurity atlas of rural India. The Atlases<br />
raised the bar in the analysis and understanding of food security across states, while also posing fresh<br />
challenges at the same time. They brought into focus the need for analysis at the sub-state level. States<br />
in India are typically large and diverse. Intra-state disparities in the socio-economic development impact<br />
the food security status of households. For effective policy and focused intervention, identifying and<br />
mapping the worst-off areas is important. Following the path-breaking national-level Atlases, it was<br />
decided to extend the analysis to the district level, the level at which food security interventions should<br />
be planned and implemented.<br />
The need for such disaggregated analysis is only matched by the dearth of data at such levels. To<br />
take just one example, we do not have estimates of an important indicator like poverty for a district.<br />
Strengthening planning and performance requires that more data is available at the district level. In<br />
this regard, the District Level Household Surveys (DLHS) show welcome progress. These surveys<br />
provide valuable demographic data and information relating to reproductive and child health.<br />
The main objectives of this report are to analyze the nature and dynamics of the food security situation<br />
at the sub-state level and suggest location- specific strategies. It is hoped that this Atlas will stimulate<br />
stragetic action and further desired analysis. Food security must be brought to the forefront of the<br />
development and political agenda not only at the Centre, but in a vibrant federal structure like India,<br />
in the states as well.<br />
1.1 What is Food Security?<br />
What constitutes food security has gone through two phases of understanding or definition. In the<br />
1970s, food security was understood as the ‘availability at all times of adequate world food supply of<br />
basic foodstuffs…’ (UN, 1975). But the 1981 publication of Amartya Sen’s Poverty and Famines: An<br />
Essay on Entitlement and Deprivation brought forward a new understanding of the problem of hunger<br />
or food security. Rather than just the ‘availability’ of food, Sen emphasized ‘access’ to food through<br />
what he called ‘entitlements’ – a combination of what one can produce, exchange in the market plus<br />
state or other socially provided supplies. What Sen posited is that availability or supply of food does<br />
not itself create entitlements for food. In a sense, Sen’s emphasis on entitlements is similar to Keynes’<br />
notion of ‘effective demand’. Both entitlement and effective demand are quite different from need.<br />
Since Keynes was dealing with a fully capitalist market economy, with only two classes, employers<br />
and workers, all effective demand was related to monetary income. But Sen is dealing with a ‘mixed<br />
economy’ with at least three classes, employers, workers and peasants or other own-account<br />
producers. For those who produce food, part, if not all, of their entitlement is due to their own<br />
production. This portion of the consumption of food is not mediated by the market. Consequently,<br />
this is not captured by the market-based notion of effective demand.<br />
6 FOOD SECURITY ATLAS OF RURAL RAJASTHAN
What an individual or household can consume or access depends on the individual’s or household’s<br />
entitlements. Entitlements draw attention to the conditions under which people access food, whether<br />
from direct production (or exchange with nature), market exchange (income from either goods produced<br />
or wage labour) and social security measures. Entitlements also draw attention to the rules that govern<br />
intra-household allocation, as a result of which women and girls may face hunger or deprivation even<br />
though they are part of households whose general entitlements are sufficient.<br />
Food, of course, is not an end in itself. Food is consumed for nutrition. Instead of focusing attention on<br />
the commodity, one can look at the objective for which food is consumed, that is providing nutrition for<br />
the body. The purpose of nutrition itself is not just to survive, but to lead a healthy and meaningful life<br />
– to be in the state one wants to be (well-being) and to do various things one wants to do.<br />
At one level, some health issues, like the prevalence of intestinal parasites, affect the very ability of the<br />
human body to absorb nutrients. Thus, health concerns, focused on the availability of clean water and<br />
access to health facilities, are very much part of the very concept of food security itself. At another<br />
level, health issues, like AIDS most dramatically but also endemic malaria, affect the ability of the<br />
individual/household to engage in those livelihood activities that could ensure food security.<br />
Consequently, in order to deal with food security, it is not sufficient to pay attention to food alone, but<br />
also access to, at least, clean water and sanitation, which affect the ability to absorb food, or turn<br />
consumption of food into nutrition. It may thus be seen that all these factors affect food security in one<br />
way or the other. Hence they can be used as components of elementary well-being needed to lead a<br />
healthy and meaningful life.<br />
Entitlements point to the fact that hunger is situated within poverty, rather associated with extreme<br />
poverty, as a result of which households and individuals do not have adequate entitlements to food.<br />
Thus, the elimination of hunger is the first landmark in reducing poverty.<br />
Capabilities are a combination of two factors – states of well-being (like being well nourished, being<br />
healthy, and so on) and activities (achieving self-respect, or being socially integrated). Self-respect and<br />
social integration are in themselves goals of a meaningful life. But they are also instrumentally important,<br />
in that those without self-respect or the socially marginalized may not be able to achieve food security.<br />
Consequently, achieving self-respect or playing a meaningful part in social life may both be necessary<br />
to achieve food security.<br />
Given women’s general responsibility for food security in rural areas of developing countries, and given<br />
the pervasive gender bias in these societies, reduction of poverty translates into the empowerment of<br />
poor women. Consequently, food security approaches have been increasingly paying attention to the<br />
elimination of gender inequality and women’s empowerment as important preconditions for food security.<br />
Empowerment of poor women, or of the poor as a whole, is not only a matter of individual agency<br />
(which itself might be dependent on collective mobilization) but also of the poor putting their stamp on<br />
INTRODUCTION<br />
7
economic policies. This is necessary in order to bring about the much-needed political will that is<br />
often lacking, to focus adequate attention on food security policies. Without adequate political pressure<br />
for reform, proper food security policies are unlikely to be adopted. There can be no question that<br />
the political mobilization of the poor is required for such a food security policy to be implemented.<br />
All these changes in the understanding and context meant that 20 years after the 1975 World Food<br />
Summit, there was a substantial shift in understanding the meaning of food security. From the 1975<br />
emphasis on adequate food supply, the 1996 World Food Summit declared ‘…food security, at the<br />
individual, household, national, regional and global levels …exists when all people, at all times, have<br />
physical and economic access to sufficient, safe and nutritious food to meet their dietary needs and<br />
food preferences for an active and healthy life.’ (FAO, 1996, 3, emphasis added). The declaration further<br />
recognized that ‘poverty eradication is essential to improve access to food.’<br />
The international discourse on food security has further developed along the lines of the right to food.<br />
This right to food (as discussed in greater detail in the Appendix on Right to Food) derives from the<br />
1948 UN Declaration on Universal Human Rights. Through subsequent instruments, the meaning of<br />
the right to food has been spelt out. In particular, the 1999 International Covenant on Economic, Social<br />
and Cultural Rights clarified the obligations of states in the context of the realization of the right to<br />
food. As put forward in General Comment 12, the right to food identifies three kinds of obligations of<br />
states: not to adopt measures that would prevent access to food; to adopt measures to ensure that no<br />
individuals are deprived of access to adequate food; and to proactively engage in activities that<br />
strengthen people’s access to food, including means to ensure their livelihood and food security. There<br />
is also an obligation of states to fulfil that right directly, when people cannot obtain adequate food through<br />
the means at their disposal (or, normal entitlements) (Charlotte McClain Nhalpo, 2004).<br />
In India, following the case filed by the People’s Union for Civil Liberties (PUCL), the Supreme Court<br />
has passed a number of judgments and orders on realizing the right to food (see Appendix on Right to<br />
Food for details). These include orders to implement the Mid-Day Meals Scheme (MMS) in primary<br />
schools in all states, the provision of work, etc. Consequently, it is in the context of the international<br />
and national obligations, following the acceptance of the right to food, that this Report looks at the<br />
ways to realize food security.<br />
1.2 Structure of the Report<br />
This report is an effort to provide a district level profile of food security in Rajasthan. As the country<br />
moves towards greater devolution and decentralization, data at disaggregated levels remains a<br />
stumbling block. District-level data is notoriously inadequate and this report urges that greater<br />
attention be paid to data collection and dissemination at the sub-state levels. While Chapter 1<br />
introduces the concept of food security, Chapter 2 provides an overview of the state and places it in<br />
the context of other states in the country. In line with the current and correct approach that emphasizes<br />
8 FOOD SECURITY ATLAS OF RURAL RAJASTHAN
outcomes rather than inputs, Chapter 3 derives a composite index of food security outcomes and<br />
provides a brief methodological note. It draws a distinction between the Food Security Outcome<br />
Index (FSOI) that is based on outcome measures on the one hand, and the Food Security Index (FSI)<br />
that is a composite index of the factors that are critical to food security on the other hand. Chapters<br />
4 to 6 analyze the food security situation along the dimensions of availability, access and absorption.<br />
The most food insecure districts both in terms of outcomes and in terms of the factors that contribute<br />
to it are given in Chapter 7. This chapter also discusses strategies for action that emerge from our<br />
analysis, in the context of the broader state and national strategic interventions already in place.<br />
This is most significant from the perspective of policy. Chapter 8 wraps up with the final conclusions.<br />
INTRODUCTION<br />
9
2. A Profile of the State of Rajasthan<br />
2. Profile of the State of Rajasthan<br />
An overview of the socio-economic profile of the state and the important changes that have taken place<br />
in its economy are important to understand and map the multiple dimensions of food security in<br />
Rajasthan. This chapter highlights the geographical features of the state, and discusses its relative<br />
position in key areas of the economy.<br />
2.1 Agro-Climatic Regions<br />
On the basis of climatic conditions and agricultural produce, Rajasthan has been divided into nine agroclimatic<br />
zones, each one having special characteristics of its own.<br />
(i) Arid Western Plain<br />
This region comprises Bikaner, Jaisalmer and Barmer districts, and some tehsils of Jodhpur and Churu<br />
districts. This is the most arid part of the state where the annual rainfall varies from 10 to 40 cms, and<br />
is quite erratic, so much so, that the entire rainfall of the year may fall on a single day and the rest of the<br />
year may be dry.<br />
(ii) Irrigated North-Western Plains<br />
Hanumangarh and Ganganagar districts which consist of an alluvial and aeolian plain form this agroclimatic<br />
zone. A part of this region which is arid, is the northern extension of the Indian Thar Desert<br />
covered with wind-blown sand. Extreme aridity marked with high summer and low winter temperatures<br />
is its usual climatic characteristic. Due to abundance of canal water irrigation, this region has today<br />
become the granary of Rajasthan.<br />
(iii) Transitional Plain of Inland Drainage<br />
This zone comprises Nagaur, Sikar and Jhunjhunu districts and some tehsils of Churu district. The area<br />
is covered with sand dunes and inter-dunal sandy plains. Climatically, this zone is slightly more wet as<br />
compared to the adjoining Arid Western Plain.<br />
(iv) Transitional Plain of Luni Basin<br />
This area lies between the Aravalli ranges and western arid region. The region encompasses the entire<br />
districts of Jalore and Pali and some tehsils of Sirohi and Jodhpur districts. The region has semi-arid<br />
climate with an annual rainfall of 30 to 50 cms. It is drained by the river Luni which flows only during the<br />
rainy season.<br />
(v) Semi-Arid Eastern Plain<br />
This region comprises of four districts namely, Jaipur, Dausa, Tonk and Ajmer, which form a rich fertile<br />
plain. On the western side, the region is flanked by the low Aravalli hills which extend from the southwest<br />
to the north-east.<br />
10 FOOD SECURITY ATLAS OF RURAL RAJASTHAN
(vi) Flood Prone Eastern Plains<br />
This region comprises the districts of Alwar, Karauli Bharatpur and Dhaulpur and the northern part of<br />
Sawai Madhopur. The region has rich alluvial soil, the fertility of which is replenished every year by the<br />
flood water of the rivers.<br />
(vii) Sub-Humid Southern Plains and the Aravalli Hills<br />
Bhilwara district, most of the tehsils of Udaipur and Chittorgarh districts and some tehsils of Sirohi<br />
districts form this agro-climatic zone. The region has a moderately warm climate in summer and mild<br />
winters.<br />
(viii) Humid Southern Plains<br />
The districts of Dungarpur and Banswara, parts of Udaipur and Chittorgarh are included in this region.<br />
The area comprises of low Aravalli hills with intrusions of black lava rocks. The area has a humid climate<br />
with an average rainfall of more than 70 cms per year. Besides, there are a number of surface water<br />
streams which have made this area very fertile. Cotton and sugarcane are the chief cash crops grown<br />
in the black soil region.<br />
(ix) Humid South-Eastern Plains<br />
This region includes the districts of Kota, Baran, Bundi and Jhalawar and two tehsils of Sawai Madhopur.<br />
The black soil region of this plateau is fertile and is used for cultivation of sugarcane, cotton and opium.<br />
2.2 National Sample Survey Regions<br />
According to the National Sample Survey (NSS), the state has been classified in to four geographical<br />
regions (see Map 2.1). In general, each region has its peculiarities in terms of geo-physical characteristics<br />
that determine the economic and living conditions of the people. These regions are as follows:<br />
(i)<br />
Western Region: Comprises of the districts of Barmer, Bikaner, Churu, Ganganagar,<br />
Hanumangarh, Jaisalmer, Jalore, Jodhpur, Nagaur, Pali and Sirohi.<br />
(ii) Southern Region: This region comprises of the districts of Banswara, Dungarpur, Rajsamand<br />
and Udaipur.<br />
(iii) North-East Region: Ajmer, Alwar, Bharatpur, Bhilwara, Jaipur, Dausa, Jhunjhunu, Karauli, Sawai<br />
Madhopur, Sikar and Tonk fall in this region.<br />
(iv) South Eastern Region: This region covers the districts of Bundi, Chittaurgarh, Jhalawar, Kota,<br />
Baran and Sawai Madhopur.<br />
A PROFILE OF THE STATE OF RAJASTHAN<br />
11
Map 2.1: Rajasthan: National Sample Survey Regions<br />
2.3 Economy<br />
Rajasthan is the largest state of the country with a geographical area of 34 million hectares and a<br />
population of 56 million. The state is noted as one of the developing states in the country. In terms of<br />
rural poverty ratio the state occupies the fifth rank among the major states 1 while in terms of per capita<br />
income it lies above Assam, Chhattisgarh, Jharkhand, Madhya Pradesh, Orissa and Bihar (Table 2.1).<br />
In terms of Net State Domestic Product, Rajasthan ranks 6th after Maharashtra, Uttar Pradesh, West<br />
Bengal, Tamil Nadu and Andhra Pradesh.<br />
2.3.1 Sectoral Composition of State Economy<br />
The sectoral composition of the economy is a valid indicator of the level of economic development<br />
of the state. The performance of tertiary sector of Rajasthan is quite good and it draws about 45 per<br />
cent of its income from this sector, lying only eight percentage points below the national average.<br />
The secondary sector accounts for one-fourth of the state economy and the state occupies the fifth<br />
position in this respect among all states. The contribution of this sector was above the national average<br />
1. Major states have been defined as those states with a total population of 20 million or above. In all analyses only the major states with this criterion have been<br />
discussed, unless otherwise specified.<br />
12 FOOD SECURITY ATLAS OF RURAL RAJASTHAN
Table 2.1: Net State Domestic Product (NSDP) and Rural Poverty Status, 2004-05<br />
State NSDP Per Capita Income Poverty Ratio<br />
(TE 2004-05) (TE 2004-05) (2004-05)<br />
(‘000 Million Rs.) Rank (Rs.) Rank Rank<br />
Andhra Pradesh 911 5 11080 8 11.2 2<br />
Assam 181 17 6281 15 22.3 8<br />
Bihar 320 14 3609 17 42.1 15<br />
Chhattisgarh 309 15 7678 12 40.8 14<br />
Gujarat 835 7 14850 4 19.1 6<br />
Haryana 349 13 14897 3 13.6 4<br />
Jharkhand 218 16 7273 14 46.3 1<br />
Karnataka 703 11 12563 6 20.8 7<br />
Kerala 811 9 11565 7 13.2 3<br />
Madhya Pradesh 835 7 7666 13 36.9 13<br />
Maharashtra 2,951 1 15567 2 29.6 11<br />
Orissa 461 12 5985 16 46.8 17<br />
Punjab 723 10 15611 1 9.1 1<br />
Rajasthan 888 6 8788 11 18.7 5<br />
Tamil Nadu 1,511 4 12719 5 22.8 9<br />
Uttar Pradesh 1,876 2 8809 10 33.4 12<br />
W. Bengal 1,705 3 10992 9 28.6 10<br />
Source: NSDP and Per capita Income – Computed from CSO, Various years; Poverty Ratio and BPL Population – Planning Commission Poverty Estimates,<br />
Computed from NSS 61 st Round, 2004-05.<br />
and is far ahead of other states like Assam, Bihar, Chhattisgarh, Kerala, Orissa, Uttar Pradesh and<br />
West Bengal. The share of the primary sector was about 29 per cent, which is similar to the national<br />
level.<br />
In an aggregated form, the secondary and tertiary sector together form only 70 per cent of the total<br />
NSDP of the state, while this figure is more than 85 per cent for states like Maharashtra and Tamil Nadu,<br />
with the national average exceeding 75 per cent (Table 2.2).<br />
The share of the primary sector in Gross State Domestic Product (GSDP) is declining at a faster rate<br />
(Table 2.4), as is the experience in other states too. During the recent years, from 1993-94 to 2004-05,<br />
the decrease has been recorded as 7 percentage points, from 36 to 29 per cent. Among the different<br />
constituents of the primary sector a faster decrease has been recorded in agriculture. At the same time,<br />
there is still a high dependence of the population (61 per cent) on agriculture (Table 2.5) reflecting its<br />
vulnerability. A slight increase has been noticed in mining and quarrying. The share of the secondary<br />
and tertiary sectors, however, has increased by about 2 to 5 percentage points. Interestingly, the<br />
contribution of the tertiary sector is considerable. In this, the contribution of trade, hotels and restaurants<br />
A PROFILE OF THE STATE OF RAJASTHAN<br />
13
Table 2.2: Sectoral Composition of NSDP (TE 2004-05)<br />
State Primary Rank Secondary Rank Tertiary Rank<br />
India 23.33 23.61 53.06<br />
Andhra Pradesh 28.31 11 20.3 11 51.39 6<br />
Assam 39.27 3 12.57 16 48.16 7<br />
Bihar 43.19 1 9.55 17 47.26 8<br />
Chhattisgarh 35.37 7 24.97 8 39.66 15<br />
Gujarat 20.45 14 34.15 1 45.41 12<br />
Haryana 28.96 10 25.04 7 46.01 10<br />
Jharkhand 39.67 2 32.26 2 28.07 17<br />
Karnataka 21.11 13 25.56 4 53.33 5<br />
Kerala 17.55 15 19.44 13 63.01 1<br />
Madhya Pradesh 34.23 8 23.25 9 42.52 14<br />
Maharashtra 14.27 17 25.31 6 60.42 2<br />
Orissa 38.8 5 14.01 15 47.19 9<br />
Punjab 39.01 4 21.5 10 39.49 16<br />
Rajasthan 29.11 9 25.4 5 45.49 11<br />
Tamil Nadu 14.85 16 28.64 3 56.51 3<br />
Uttar Pradesh 36.86 6 19.56 12 43.59 13<br />
West Bengal 25.36 12 19.09 14 55.55 4<br />
* Net State Domestic Product (NSDP) at Factor Cost at 1993-94 prices.<br />
Source: Computed from Central Statistical Organization (Various Years).<br />
was substantial (about 13 per cent) followed by transport, storage & communication (about 8 per cent)<br />
(Table 2.3).<br />
Besides, the share of different sectors, it is important to note the growth estimates of different sectors<br />
in GSDP, as that has a strong implication for the food security scenario in the state. During the decade<br />
1993-94 to 2004-05, the annual average growth was between 7 to 8 per cent. In the primary sector,<br />
growth of 8 per cent and more has been recorded in agriculture and mining & quarrying and it is around<br />
3 to 4 per cent among forestry and fishing. The growth rate in agriculture is very good, with only<br />
manufacturing and services growing faster. But it is a moot point whether this growth rate in agriculture<br />
can be maintained over a longer period of time.<br />
2.3.2 Participation of Workers and Gross State Domestic Product<br />
In the present section, an attempt has been made to understand the workers’ participation status,<br />
their principal status (PS) as well as their usual principal and subsidiary status (UPSS) in different<br />
sectors of the economy. The participation of principal status workers in the primary sector is about<br />
59 per cent (Table 2.5) while their participation in secondary and tertiary sector is in equal proportion,<br />
14 FOOD SECURITY ATLAS OF RURAL RAJASTHAN
Table 2.3: Share (per cent) of Different Sectors to Total GSDP at 1993-94 Prices<br />
Sector 1993-94 1999-00 2004-05<br />
Agriculture 32.07 26.52 24.77<br />
Forestry & logging 1.79 1.32 1.26<br />
Fishing 0.11 0.07 0.08<br />
Mining & quarrying 2.30 2.43 2.71<br />
Sub total of primary 36.27 30.32 28.82<br />
Manufacturing 12.27 16.61 13.24<br />
Manu-registered 6.39 11.17 7.53<br />
Manu-unregistered 5.89 5.44 5.70<br />
Construction 9.02 9.67 10.20<br />
Electricity, gas and water supply 3.67 3.90 4.13<br />
Sub total of secondary 24.96 30.19 27.57<br />
Transport, storage & communication 5.12 5.83 7.51<br />
Railways 1.64 1.43 1.66<br />
Transport by other means 2.56 2.47 2.68<br />
Storage 0.09 0.10 0.10<br />
Communication 0.83 1.83 3.07<br />
Trade, hotels and restaurants 12.96 12.75 13.30<br />
Banking & insurance 2.92 3.39 4.27<br />
Real estate, ownership of dwellings and 6.98 5.93 6.10<br />
business services<br />
Public administration 4.03 4.09 3.76<br />
Other services 6.77 7.47 8.66<br />
Sub total of tertiary 38.77 39.47 43.61<br />
Source: CSO, relevant years<br />
i.e. about 20 per cent each. The participation of main and marginal workers in the primary sector is<br />
also considerably higher as compared to others i.e. 63 per cent. But their participation in the secondary<br />
and tertiary sectors is about 19 and 18 per cent respectively, which was also slightly lower than that<br />
of the PS workers. Productivity and correspondingly access to food are much lower for workers<br />
engaged in agriculture than in manufacturing or services.<br />
The tertiary sector is the major contributor to GDP with about 44 per cent share followed by agriculture<br />
and secondary sectors with shares of about 29 and 28 per cent respectively. It emerges from the analysis<br />
that agriculture is the major absorber of the labour force while its contribution to GSDP is comparatively<br />
lower. The contribution of the tertiary sector in GSDP is larger while the participation of the labour force<br />
is less than one-fifth. It can be concluded that a shift of the agricultural labour force to other sectors<br />
would improve the productivity of labour.<br />
A PROFILE OF THE STATE OF RAJASTHAN<br />
15
Table 2.5: Percentage of GSDP and Workers in Rajasthan, 2004-05<br />
Sector PS UPSS GSDP<br />
Agriculture, etc. 57.61 61.70 26.11<br />
Mining & Quarrying 1.25 1.08 2.71<br />
Primary 58.87 62.78 28.82<br />
Manufacturing 9.26 9.05 13.24<br />
Elecetricity, Gas & Water supply 0.56 0.48 4.13<br />
Construction 10.83 9.66 10.20<br />
Secondary 20.65 19.19 27.57<br />
Trade, Hotel & Restaurants 8.61 7.56 13.30<br />
Transport, Storage & Communication 3.33 2.89 7.51<br />
Finance, Business, Real Estate, etc 1.32 1.18 10.37<br />
Public Admn., Health, education, etc. 7.21 6.40 12.43<br />
Tertiary 20.48 18.03 43.61<br />
Total (number) 20,597,868 24,012,282 6685282<br />
Source: CSO, relevant years.<br />
Table 2.4: Average Annual Growth Rate of GSDP in Rajasthan, 1994-05<br />
Sector Average Annual Sector Average Annual<br />
Growth Rate<br />
Growth Rate<br />
Agriculture 8.05 Railways 6.76<br />
Forestry & logging 3.30 Transport by other means 8.24<br />
Fishing 3.75 Storage 9.13<br />
Mining & quarrying 8.55 Communication 20.33<br />
Sub total of primary 7.11 Trade, hotels and restaurants 7.39<br />
Manufacturing 8.27 Banking & insurance 10.63<br />
Manufacturing-registered 10.25 Real estate, ownership of<br />
Manufacturing-unregistered 6.69 dwellings & business services 5.50<br />
Construction 8.15 Public administration 6.14<br />
Electricity, gas and water 8.94 Other services 9.08<br />
supply<br />
Sub total of secondary 7.96 Sub total of tertiary 7.84<br />
Transport, storage & 10.59 Calculated State 7.00<br />
communication<br />
Domestic Product<br />
Source: CSO, relevant years.<br />
2.3.3 Poverty Status<br />
In Rajasthan, there is reduction in the incidence of poverty, compared to the country as a whole. However,<br />
there are wide variations in the poverty status across different regions of the state. In the southern region,<br />
16 FOOD SECURITY ATLAS OF RURAL RAJASTHAN
Figure 2.1: Region-wise Percentage Share of Poor Households<br />
by Social Group for Rural Rajasthan (2004-05)<br />
Source: Calculated from NSS 61st Round, 2004-05.<br />
conditions of the households are worse due to high poverty ratio compared to rest of the regions. This<br />
ratio is more than one-third higher than that at the state level, because of factors such as a concentration<br />
of tribal population which has a limited access to the productive resources, limited size of land holdings,<br />
etc. (Sagar and Ahuja 1987). The south-eastern and north-eastern regions have a lower poverty ratio<br />
because these regions are endowed with land and water resources and favourable agro-climatic<br />
conditions, which have all aided in enhancing agricultural production.<br />
Figure 2.1 shows the region-wise percentage share of poor households by Social Groups for Rural<br />
Rajasthan (2004-05). The poverty rate of the Scheduled Tribe population is highest in southern Rajasthan<br />
whereas in the western region of Rajasthan, both Scheduled Castes and Scheduled Tribes show a high<br />
incidence of poverty.<br />
2.4 Environmental Conditions<br />
The state has a very limited coverage of forests i.e. less than 5 per cent. As per the available estimates<br />
of the state Forest Department, 1.85 and 2.85 per cent are categorized as dense and degraded forests<br />
respectively. At the same time, wastelands cover almost 30 per cent of the total geographical area. As<br />
a result, the extent of net area cultivated is about 44 per cent of the total area of the state, which is<br />
slightly lower than the national average of 45 per cent (Table 2.6). The water scarcity and fluctuations<br />
in rainfall across agro-climatic regions are the major constraints for further expansion of area under<br />
cultivation. It also points to the necessity of switching from a water- intensive to a less water-consuming<br />
cropping pattern (Vyas, 2005). This is important in determining household income and thus access to<br />
food. Rajasthan is below the all-India average in agricultural productivity.<br />
A PROFILE OF THE STATE OF RAJASTHAN<br />
17
In Rajasthan, while livestock has increased, the area available for grazing has remained stagnant. This<br />
has reduced the productivity of the Common Property Resources (CPRs) in a process referred to as<br />
desertification: ‘Desertification is the process of land degradation that affects dryland areas and is caused<br />
by poverty, unsustainable land management and climate change.’ (see IFAD, Desertification, ifad.org)<br />
Rajasthan accounts for approximately10 per cent of India’s land area, but only 1 per cent of its water<br />
resources. Of its land area, 60 per cent approximately is desert (Table 2.6). These two factors together<br />
severely limit the extent of agricultural development; they also influence the nature of possible<br />
agricultural development – towards less water-using but high value crops and livestock development<br />
(see also World Bank, 2006).<br />
2.5 Socio-Economic Status<br />
Table 2.6: Environmental Limitations to Agricultural Development<br />
States % of Wastelands Rainfall Deviation Forest Area Agricultural<br />
to total area from Norm (%) Extent 2 (%)<br />
2003 Rank TE 2004-05 Rank 2003 Rank TE 2001-04 Rank<br />
Andhra Pradesh 16.46 14 -8.3 11 16.2 9 36.62 13<br />
Assam 17.89 15 6.7 1 35.5 15 35.34 14<br />
Bihar 5.78 5 3.0 3 5.9 5 60.90 5\<br />
Chhattisgarh 5.61 4 -1.0 4 41.4 17 34.69 15<br />
Gujarat 10.4 9 -4.3 7 7.6 6 50.83 9<br />
Haryana 7.39 8 -6.0 9 3.4 2 80.48 2<br />
Jharkhand 14.01 12 -5.7 8 28.5 13 22.20 17<br />
Karnataka 7.06 7 -16.0 14 19.0 11 52.00 8<br />
Kerala 4.6 2 -18.0 15 40.1 16 56.37 7<br />
Madhya Pradesh 18.53 16 -8.3 11 24.8 12 33.31 16<br />
Maharastra 16.01 13 -13.7 13 15.3 8 57.04 6<br />
Orissa 12.17 10 -3.0 6 31.1 14 37.08 11<br />
Punjab 2.33 1 -24.3 16 3.1 1 84.38 1<br />
Rajasthan 29.64 17 -27.0 17 4.6 3 43.74 10<br />
Tamil Nadu 13.3 11 -2.0 5 17.4 10 37.05 12<br />
Uttar Pradesh 7.05 6 -8.0 10 5.9 4 68.97 3<br />
West Bengal 4.95 3 6.0 2 13.9 7 62.50 4<br />
Total 17.45 -7.7 20.6 45.30<br />
Source: Wasteland – Wasteland Atlas, 2003; Forest – State of Forest Report, 2003; Rainfall and NAS – Ministry of Agriculture.<br />
The agricultural and consequently economic development of the state is also reflected in the socioeconomic<br />
status of the rural population. Rajasthan was formed out of 16 princely states and 3 chiefdoms.<br />
2. Agricultural Extent = Net area sown / Total Reporting Area x 100<br />
18 FOOD SECURITY ATLAS OF RURAL RAJASTHAN
Table 2.7: Socio-Economic Status of Major States (All Figures in Percentages)<br />
Level of Rural Female Proportion Proportion Proportion<br />
Urbanization Literacy of Rural of Rural of<br />
Scheduled Scheduled Agricultural<br />
Castes Tribes Labourers<br />
Value Rank Value Rank Value Rank Value Rank Value Rank<br />
India 27.8 – 46.1 – 17.9 – 10.4 – 33.0 –<br />
Andhra Pradesh 27.3 8 43.5 12 18.4 11 8.4 8 47.5 16<br />
Assam 12.9 16 50.7 6 6.7 1 13.6 11 14.9 2<br />
Bihar 10.5 17 29.6 17 16.4 8 1.0 4 51.0 17<br />
Chhattisgarh 20.1 14 47.0 10 11.4 5 37.6 17 36.1 12<br />
Gujarat 37.4 3 47.8 9 6.9 2 21.6 13 33.2 9<br />
Haryana 28.9 6 49.3 7 21.4 13 0 1 19.0 3<br />
Jharkhand 22.2 12 29.9 16 12.4 6 31.0 16 32.8 7<br />
Karnataka 34.0 4 48.0 8 18.4 11 8.4 8 34.5 11<br />
Kerala 26.0 10 86.7 1 10.8 3 1.5 5 19.6 4<br />
Madhya Pradesh 26.5 9 42.8 13 15.6 7 25.8 15 34.1 10<br />
Maharashtra 42.4 2 58.4 2 10.9 4 13.4 10 37.8 13<br />
Orissa 15.0 15 46.7 11 17.2 9 24.6 14 39.1 14<br />
Punjab 33.9 5 57.7 3 33.0 17 0 1 21.9 5<br />
Rajasthan 23.4 11 37.3 14 17.9 10 15.5 12 12.3 1<br />
Tamil Nadu 44.0 1 55.3 4 23.8 15 1.6 6 42.9 15<br />
Uttar Pradesh 20.8 13 36.9 15 23.4 14 0.1 3 28.9 6<br />
West Bengal 28.0 7 53.2 5 26.9 16 7.2 7 33.1 8<br />
Source: Census of India, 2001.<br />
This feudal background meant that Rajasthan, compared to other states in India, was a latecomer to<br />
the development process (World Bank, 2006) and this feudal background has yet to be fully overcome<br />
in many economic and social aspects.<br />
Among all major states, Rajasthan occupies the mid position in terms of urbanization levels. The rate<br />
of urbanization in the state is lower than the national level by about 4 per cent (Table 2.7). During recent<br />
years, there has been a faster increase in urbanization. This can be attributed to various factors such<br />
as continuous drought conditions that led to crop failure, and limited employment opportunities in the<br />
rural areas that pushed the rural households to migrate to urban areas for livelihood. Besides, sharp<br />
improvements in infrastructure in urban areas encouraged the rural households in general and the poor<br />
in particular to migrate from rural to urban areas.<br />
A PROFILE OF THE STATE OF RAJASTHAN<br />
19
It is generally accepted that there is a need to pay due attention to gender relations in order to<br />
strengthen women’s agency in dealing with food security. Taking women’s literacy rate as an indicator<br />
of gender, rural Rajasthan has lower rural women’s literacy rate in comparison to the national average.<br />
Other than the three states of Uttar Pradesh, Jharkhand and Bihar, Rajasthan is lagging behind in<br />
education of females (Table 2.7). The low education level among females can be attributed to various<br />
socio-economic factors such as the pastoral economy of the state that requires grazing labour, the<br />
tradition of child marriage etc. (Singh, 1999).<br />
2.5.1 Social Group-wise Composition of Households<br />
Tribals constitute about 16 per cent of the total population in the state. The figure is higher than the<br />
national proportion, and only below other tribal-dominated states such as Madhya Pradesh, Orissa,<br />
Jharkhand and Chhattisgarh. Thus Rajasthan emerges as one of the tribal populated states of the<br />
country among the major states (Table 2.7). The proportion of Scheduled Castes in Rajasthan is at the<br />
national level of 17.9 per cent.<br />
Poverty is high among the SC and ST categories as compared to national estimates. In Rajasthan,<br />
more than one-fourth, i.e. about 26 per cent of the poor households belong to the ST category, whereas<br />
the national level estimates for the same category were 18 per cent (Table 2.8). One-third and slightly<br />
less than that of the poor households belong to the SC and ‘Other Backward Class’ (OBC) categories.<br />
Only 8 per cent of poor households belonged to the ‘other’ category.<br />
Table 2.8: Region-wise Percentage Share of Poor and<br />
All Households by Social Group for Rural Rajasthan (2004-05)<br />
Region ST SC OBC Others All*<br />
Poor Households<br />
Western 9.2 47.4 32.1 11.2 100.0<br />
North-Eastern 8.1 38.0 45.6 8.3 100.0<br />
Southern 87.6 1.9 7.2 3.3 100.0<br />
South-Eastern 24.7 17.4 54.7 3.2 100.0<br />
Rajasthan 26.6 33.0 32.3 8.1 100.0<br />
Rural India 18.1 28.4 38.0 15.4 100.0<br />
All Households<br />
Western 6.4 26.3 50.5 16.8 100.0<br />
North-Eastern 9.3 22.8 49.9 18.0 100.0<br />
Southern 56.8 5.6 20.1 17.4 100.0<br />
South-Eastern 16.7 21.0 48.7 13.7 100.0<br />
Rajasthan 15.9 21.3 45.7 17.0 100.0<br />
Rural India 10.9 21.4 42.0 25.6 100.0<br />
Source: NSS, 61st Round, 2004-05.<br />
20 FOOD SECURITY ATLAS OF RURAL RAJASTHAN
Across the regions, there exists a vast variation in the distribution of poor households among the<br />
different social groups. In the western region, a major proportion of households, i.e. 47 per cent<br />
belonged to the SC category. Nearly, one-third of the total households are in the OBC category. Northeastern<br />
Rajasthan is dominated by OBC poor followed by SC poor households. The southern region<br />
is dominated by ST poor households – about 88 per cent – while more than half of the poor households<br />
belong to OBC category in south-eastern region (Table 2.8).<br />
2.5.2 Occupation-wise distribution of Households<br />
The occupational pattern among households in general, and the poor in particular, shows their<br />
dependence on varied sources of livelihood. Overall, about half of the households are self-employed<br />
in the agriculture sector, followed by other labour which is substantially higher than national level<br />
estimates (Table 2.9). The dependence of poor households on wage employment as agricultural<br />
labourers is three times lower than at the national level. Inter-regional comparison shows that except<br />
in the southern region, the agriculture sector is the major source of livelihood. In the southern region,<br />
the non-farm sector absorbs about one-third of the total labour force deployed.<br />
Among the poor households, agriculture is the major source of employment followed by other activities,<br />
whereas about one-third of them are dependent on wage employment in other sectors. In the southeastern<br />
and north-eastern regions, which are well endowed with a good natural resource base,<br />
Table 2.9: Region-wise Distribution of Poor and All Households<br />
by Household Type for Rural Rajasthan (2004-05) (%)<br />
Region Self-employed Agricultural Other Self-employed Others Total<br />
in non-agriculture labour labour in agriculture<br />
Poor Households<br />
Western 11.2 19.3 27.2 32.5 9.7 100.0<br />
North-Eastern 14.4 13.2 23.6 46.9 1.8 100.0<br />
Southern 0.3 4.3 67.9 25.7 1.8 100.0<br />
South-Eastern 3.8 17.4 4.1 73.5 1.2 100.0<br />
Rajasthan 9.3 14.3 33.2 38.1 5.2 100.0<br />
Rural India 12.8 41.5 12.1 26.5 7.1 100.0<br />
All Households<br />
Western 16.9 8.5 15.3 48.8 10.4 100.0<br />
North-Eastern 16.3 6.0 14.5 51.5 11.7 100.0<br />
Southern 12.0 3.9 46.2 31.5 6.3 100.0<br />
South-Eastern 10.9 9.4 3.9 69.9 5.8 100.0<br />
Rajasthan 15.3 7.0 18.0 49.9 9.8 100.0<br />
Rural India 15.6 26.7 10.7 35.5 11.4 100.0<br />
Source: NSS, 61 st Round, 2004-05.<br />
A PROFILE OF THE STATE OF RAJASTHAN<br />
21
agriculture is the major source of employment; while in other regions wage employment is the major<br />
source of livelihood. The availability of wage employment in the agriculture sector is considerably lower<br />
than at the national level. This may be due to limited availability of irrigation facilities and lower size of<br />
land holdings.<br />
2.5.3 Urbanization<br />
The level of urbanization has strong implications for migration from the rural areas. Urbanization<br />
increases opportunities for a variety of livelihood options. But the livelihoods in which one can enter<br />
depend very much on the person’s education and skills. Unskilled, illiterate persons can only take up<br />
low income options which may not do much more than reduce the burden on feeding in the village<br />
household. But, in vulnerable conditions like drought and flood, such options play a considerable role<br />
in terms of livelihood.<br />
Some districts, like Kota and Jaipur, were leading in urbanization. In recent years, Kota city is growing<br />
towards a metro city and there has been huge infrastructure investment, including on education, which<br />
has resulted in a variety of livelihood opportunities. This city is also known as the education hub of<br />
the country. This has attracted a particular class not only from within the state but also from other<br />
Table 2.10: Status of Urbanization<br />
High Moderate Low Very Extremely<br />
Low<br />
Low<br />
District Value District Value District Value District Value District Value<br />
Kota 53.5 Ajmer 40.1 Jodhpur 33.9 Ganganagar 25.3 Chittaurgarh 16<br />
Jaipur 49.4 Bikaner 35.5 Churu 27.9 Pali 21.5 Jaisalmer 15<br />
Source: Census of India, 2001.<br />
Tonk 20.9 Alwar 14.5<br />
Sikar 20.7 Jhalawar 14.3<br />
Bhilwara 20.6 Karauli 14.2<br />
Jhunjhunun 20.6 Rajsamand 13<br />
Hanuman- 20 Dausa 10.3<br />
garh<br />
Bharatpur 19.5 Jalor 7.6<br />
Sawai 19 Barmer 7.4<br />
Madhopur<br />
Bundi 18.7 Dungarpur 7.3<br />
Udaipur 18.6 Banswara 7.1<br />
Dhaulpur 18<br />
Sirohi 17.7<br />
Nagaur 17.2<br />
Baran 16.8<br />
22 FOOD SECURITY ATLAS OF RURAL RAJASTHAN
Map 2.2: Level of Urbanization<br />
states of the country. Similarly, a substantial infrastructure investment has attracted MNCs. A<br />
moderate level of urbanization is found in Ajmer and Bikaner districts. In districts located in the<br />
southern and western parts of the states, the level of urbanization is less than 10 per cent. These<br />
are districts with poor environmental conditions and inhabited by tribal populations, leading to low<br />
purchasing power, and limited scope for urbanization. The status of urbanization has been presented<br />
in Table 2.10 and Map 2.2.<br />
2.6 Health and Nutritional Status<br />
It is well known fact that a healthy person has a higher capacity to work. The goal of any economic<br />
activity is human well-being, an important component of which is health. Health and nutritional status<br />
can be measured through a number of indicators. While mortality under age one [infant mortality] is an<br />
indicator of poor reproductive health facilities, ante-natal care and post-natal care; mortality under age<br />
five is closely linked with immunization and overall poverty levels. The latter is also useful for assessing<br />
both social practices and public policy and can be taken as a comprehensive indicator for the overall<br />
quality of life.<br />
Table 2.11 shows the comparative mortality as well as nutritional status of children for the states with<br />
an under-five mortality figure higher than 80 per 1000 live births. While Uttar Pradesh shows the highest<br />
A PROFILE OF THE STATE OF RAJASTHAN<br />
23
figure (96) in terms of under-five mortality, Rajasthan under-five mortality is 85.4 per thousand live<br />
births. For all malnutrition indicators, the figures for Rajasthan remain poor and near the national<br />
average. High malnutrition levels, coupled with high mortality among children also possibly point<br />
towards poor feeding practices. Poor access to food emanating from grave economic conditions, as<br />
already seen earlier, is the prime reason for such a situation.<br />
2.6.1 Nutritional status<br />
Table 2.11: Mortality and Nutritional Status of Children and Women *<br />
Under- Infant Under- Wasted Stunted Anemic Thin<br />
five Mortality weight Children Children Children Women<br />
mortality<br />
Children<br />
India 74.3 57 42.5 19.8 48.0 69.5 35.6<br />
Uttar Pradesh 96.4 72.7 42.4 14.8 56.8 73.9 36.0<br />
Madhya Pradesh 94.2 69.5 60.0 35.0 50.0 74.1 41.7<br />
Jharkhand 93.0 68.7 56.5 32.3 49.8 70.3 43.0<br />
Orissa 90.6 64.7 40.7 19.5 45.0 65.0 41.4<br />
Chhattisgarh 90.3 70.8 47.1 19.5 52.9 71.2 43.4<br />
Rajasthan 85.4 65.3 39.9 20.4 43.7 69.7 36.7<br />
Assam 85.0 66.1 36.4 13.7 46.5 69.6 36.5<br />
Bihar 84.8 61.7 55.9 27.1 55.6 78.0 45.1<br />
Maharashtra 46.7 37.5 37.0 16.5 46.3 63.4 36.2<br />
Best State 16.3 15.3 22.9 9.2 24.5 44.5 18.0<br />
(Kerala) (Kerala) (Kerala) (Punjab) (Kerala) (Kerala) (Kerala)<br />
Worst State 96.4 72.7 60 35.0 56.8 78.0 45.1<br />
(UP) (UP) (MP) (MP) (UP) (Bihar) (Bihar)<br />
Source: National Family Health Survey, 2005-06.<br />
Note:* Only those states have been selected that have under-five mortality higher than 80 per thousand live births.<br />
An encouraging picture has emerged in food consumption levels in the case of Rajasthan. It lies far<br />
ahead of the national average in terms of per capita per day intake of calories and proteins. But, service<br />
delivery for mitigating under nutrition and micro-nutrient deficiencies among children under the<br />
Integrated Child Development Services (ICDS) programme, is considerably lower than that of national<br />
level estimates. In Rajasthan, percentage of children below five years who have received Vitamin A<br />
and Iron supplements is only 10 per cent and 1 per cent respectively against the national average of<br />
18.2 per cent and 4.7 per cent respectively. Similarly, percentage of children who received food<br />
supplement under ICDS programme in Rajasthan is only 17.3 per cent against the national average of<br />
26.3 per cent (Table 2.12).<br />
The status of nutrition among the children below the age of three years in terms of stunted and wasted<br />
children was slightly lower or at par with the national level (Table 2.13).<br />
24 FOOD SECURITY ATLAS OF RURAL RAJASTHAN
Table 2.12: Status of Consumption<br />
Per Capita Per Capita % given Vitamin % given iron % Received<br />
per Day per Day A supplements supplements food<br />
Intake Intake in last in last supplements<br />
of Calorie Protein 6 month 7 days under ICDS<br />
(kcal) (gm) (Children (Children Programme<br />
< 5yrs) < 5yrs)<br />
India 2047 57.0 18.2 4.7 26.3<br />
Uttar Pradesh 2200 65.9 6.1 1.5 14.7<br />
Madhya Pradesh 1929 58.8 14.1 3.5 36.4<br />
Jharkhand 1961 51.2 20.1 3.5 36.5<br />
Orissa 2023 48.3 21.9 5.2 52.5<br />
Chhattisgarh 1942 47.4 9.1 3.1 58.4<br />
Rajasthan 2180 69.6 10.0 1.0 17.3<br />
Assam 2067 52.7 12.9 0.8 28.0<br />
Bihar 2049 57.8 26.4 2.9 4.2<br />
Maharashtra 1933 55.7 25.2 7.1 42.4<br />
Best State 2240 69.6 38.5 12.5 58.4<br />
(Punjab) (Haryana) (TN) (Karnataka) (Chhattisgarh)<br />
Worst State 1842 44.9 6.1 0.8 4.2<br />
(TN) (TN) (UP) (Assam) (Bihar)<br />
Source: Calorie and Protein intake from NSSO, 61 st Round (2004-05); Rest – National Family Health Survey, 2005-06.<br />
2.6.2 Immunization of Children<br />
Table 2.13: Nutritional Status of Children (NFHS II, III)<br />
Variable NFHS III NFHS II<br />
Total Urban Rural Total<br />
Rajasthan<br />
Children under 3 year who are stunted (%) 40.1 29.4 42.8 59.0<br />
Children under 3 year who are wasted (%) 22.5 19.6 23.3 16.2<br />
Children under 3 year who are underweight (%) 36.8 26.1 39.5 46.7<br />
India<br />
Children under 3 year who are stunted (%) 44.9 37.4 47.2 51.0<br />
Children under 3 year who are wasted (%) 22.9 19.0 24.1 19.7<br />
Children under 3 year who are underweight (%) 40.4 30.1 43.7 42.7<br />
Source: NFHS II (1998-99) and NFHS III (2005-06)<br />
Immunization of children is an important contributor to child survival. The focus is on six serious but<br />
preventable diseases viz: tuberculosis, diphtheria, pertussis, tetanus, polio and measles. As per the<br />
available information, about 17 per cent of the children in the state in the age group of 1 to 2 years<br />
A PROFILE OF THE STATE OF RAJASTHAN<br />
25
Table 2.14 Immunization of Children<br />
Variables NFHS III NFHS II<br />
Total Urban Rural Total<br />
Rajasthan<br />
Children 12-23 months fully immunized<br />
(BCG, Measles, and 3 doses each of polio/DPT) (%) 26.5 44.3 22.1 17.3<br />
Children 12-23 months who have received BCG (%) 68.5 76.1 66.7 53.9<br />
Children 12-23 months who have received<br />
3 doses of polio vaccine (%) 65.2 73.9 63.0 44.6<br />
India<br />
Children 12-23 months fully immunized<br />
(BCG, Measles, and 3 doses each of polio/DPT) (%) 43.5 57.6 38.6 42.0<br />
Children 12-23 months who have received BCG (%) 78.1 86.9 75.1 71.6<br />
Children 12-23 months who have received<br />
3 doses of polio vaccine (%) 78.2 83.1 76.5 62.8<br />
Source: NFHS II, III<br />
were fully vaccinated in 1993-94. This proportion increased to more than one-fourth in 2005-06. In<br />
rural areas there was an improvement in full vaccination from 11 per cent to 22 per cent during this<br />
period. Earlier, there was a limited reach of the measles vaccination and the third dose of DPT. The<br />
effect of the pulse polio immunization campaign is visible over time (Table 2.14).<br />
This chapter has given a brief overview of the economic, health and nutritional status of Rajasthan<br />
as compared to other states and the national average. The ensuing chapter relate these to the food<br />
security issues in terms of inputs and outcomes to food security and measures taken and to be taken<br />
to address food insecurity.<br />
*****<br />
26 FOOD SECURITY ATLAS OF RURAL RAJASTHAN
3. Analysis of Food Security<br />
3. Analysis of Food Security<br />
Food security is the condition of sufficient nutrition, which is due to a combination of food access of<br />
the household and the individual, and of the ability of the body to absorb nutrients. In more detail, food<br />
security of an individual is the result of:<br />
1. Food availability, which refers to the quantity of food available, whether through own production or<br />
from the market and government programmes. In India food availability is usually measured with<br />
respect to foodgrains, which are the chief source of energy, particularly of the poor.<br />
2. The food accessed by the household through own production, market purchase and government<br />
entitlements and distributed among household members on the basis of various social norms and<br />
bargaining positions, including gender relations among the household members.<br />
3. The food consumed by an individual translated into nutrition on the basis of access to safe water,<br />
the absence of parasitic diseases, and the overall health status, all of which would affect the body’s<br />
capacity to absorb consumed food.<br />
3.1 Measuring Food Security Status<br />
Given this definition of food security, how can its attainment be measured? Food security is a combination<br />
of access to food and its absorption by the body, which depends on a number of non-food factors<br />
such as sanitation, access to clean drinking water, access to health facilities, and so on. The outcome<br />
of food security can be taken to be the nutritional status of the individual, with the understanding that<br />
food intake is the basic, though not the only factor that affects nutritional status.<br />
In developing countries, the rural population, particularly children, are vulnerable to malnutrition because<br />
of low dietary intake, poor quality of diet, lack of appropriate care and inequitable distribution of food<br />
within the household. The measurement of the nutritional status of children is done through<br />
anthropometric methods; these include weight-for-age, height-for-age and weight-for-height. Each of<br />
these indices provides somewhat different information about the nutritional status of children. The heightfor-age<br />
index measures linear growth retardation. Children who are more than two standard deviations<br />
below the median of the reference population in terms of height-for-age are considered short for their<br />
age or ‘stunted’. The proportion in this category indicates the prevalence of ‘chronic under-nutrition’,<br />
which often results from a failure to receive adequate nutrition over a long period of time or from chronic<br />
or recurrent diarrhoea (NFHS, 2007).<br />
The weight-for-height index examines body mass in relation to body length. Children who are more<br />
than two standard deviations below the median of the reference population for the same index are<br />
considered too thin or ‘wasted’ and this indicates prevalence of acute under-nutrition. Wasting is<br />
associated with the failure to receive adequate nutrition in the period immediately before the survey and<br />
may be the result of seasonal variations in food supply or recent episodes of illness (NFHS, op cit).<br />
ANALYSIS OF FOOD SECURITY<br />
27
Children who are more than two standard deviations below the reference median on the index of weightfor-age<br />
are considered to be ‘underweight’. We have opted for the proportion of underweight children<br />
as the indicator for capturing malnutrition among children. Primarily because weight-for-age takes into<br />
account both chronic and acute under-nutrition. Secondly, while information on stunting and wasting<br />
are available at the state-level from the NFHS, the same is not available at the district-level. The<br />
Reproductive and Child Health Survey through its District Level Household Survey (DLHS) does give<br />
information at the district level but only for the index on weight-for-age. Therefore, we have selected<br />
this index as one of the two indicators for measuring food insecurity status.<br />
Malnutrition in children weakens their immune system, making them more susceptible to disease and<br />
less able to fight off infection. It has been estimated that a child is almost ten times more likely to die<br />
from key diseases if he/she is severely underweight, and two and a half times more likely to die if he/<br />
she is moderately underweight, as compared to an average weight child (Black et al., 2008). Given the<br />
fact that more than 3.5 million children die globally on account of under-nutrition, it emerges as a major<br />
factor leading to child deaths.<br />
Therefore, under-five mortality has been taken as the second indicator for measuring food insecurity.<br />
The under-five mortality rate indicates the probability of dying between birth and five years of age,<br />
expressed per thousand live births. There are a number of advantages of using the under-five mortality<br />
ratio as an indicator of food insecurity. Under-five mortality is known to be the ‘outcome’ of the<br />
development process rather than an ‘input’, such as per capita calorie or protein consumption or access<br />
to medical facilities which are means to an end. Under-five mortality is known to be the outcome of a<br />
wide variety of factors, for instance, nutritional status of the child and its mother, food availability in the<br />
family, level of immunization, availability of maternal and child health services, economic status,<br />
availability of safe drinking water, basic sanitation, and so on (UNICEF, 2005). Thus, under-five mortality<br />
encompasses a number of facets, most of which have been used as explanatory indicators, as already<br />
enumerated and as discussed later.<br />
The significance of under-five mortality as an indicator lies in the fact that it is less susceptible to the<br />
fallacy of averages than, for instance, per capita income. This is because the natural scale does not<br />
allow children of the rich to be 1000 times as likely to survive, even if the human-made scale does permit<br />
them to have 1000 times as much income. To put it simply, it is much more difficult for a wealthy minority<br />
to affect a region’s under-five mortality ratio, and therefore it puts forward a more accurate picture of<br />
the health and nutritional status of the children of that region (UNICEF, 2007a).<br />
The UN explicitly mentions reduction of child mortality (children under five) by two-thirds by 2015 as<br />
one of its primary MDGs (MDG–4). The interrelation between nutritional status and under-five mortality<br />
can be gauged from the fact that under-nutrition contributes up to 50 per cent of all child deaths (WHO<br />
and UNICEF, 2006). Improving nutrition and achieving MDG–1 (eradicate extreme poverty and hunger)<br />
would substantially help avert child deaths from diarrhoea, pneumonia, malaria, HIV, or measles. Thus,<br />
improving nutritional status is a prerequisite for achieving MDG–4 (UNICEF, 2006).<br />
28 FOOD SECURITY ATLAS OF RURAL RAJASTHAN
Box 3.1: Towards MDG - 4<br />
India accounts for 2.1 million (21 per cent) of a total of 9.7 million children dying globally before they reach the age of five.<br />
This is despite the fact that child mortality has declined by 34 per cent between 1990 and 2006. A study conducted by<br />
Save the Children, which compares child mortality in a country to its per capita income, shows that India lags far behind its<br />
poorer neighbours like Bangladesh and Nepal, when it comes to reducing child deaths. A new Wealth and Survival Index,<br />
which is part of the study, has ranked 41 countries on the criterion of how well they use their resources to boost child survival<br />
rates. While Bangladesh and Nepal are listed in the top ten performers, India stands at a low 16th in the index.<br />
This can be elucidated by comparing India and Bangladesh. While India’s per capita income (GNI) increased by 82 per cent from<br />
2000 to 2006, its child mortality rate declined from 94 to 76 per 1000 live births. As against that, over the same period, Bangladesh<br />
saw a much smaller increase in per capita income – only 23 per cent – but its child mortality dropped from 92 to 69.<br />
As per the estimates of the Inter-Agency Group for Child Mortality Estimation, only seven of the 60 priority countries with<br />
high child mortality can be considered to be on track to achieve the MDG-4 (Bangladesh, Brazil, Egypt, Indonesia, Mexico,<br />
Nepal and the Philippines). Thus, the global progress made so far has been found to be insufficient to achieve the goal. To<br />
actually achieve the goal, most of the remaining countries have to progress at an average annual rate of reduction of at<br />
least 10 per cent till 2015. Given the fact that the global rate so far (1990-2006) has just been a little over 1.5 per cent, the<br />
achievement of this goal seems to be unrealistic.<br />
The State of the World’s Children-2008 suggests early and exclusive breastfeeding for the first six months, appropriate<br />
complementary feeding from six months to two years, skilled care at birth and special care for low-birth weight babies as<br />
key preventive measures to reduce child mortality. Thus, adequate food security of the child is necessary for its survival<br />
beyond the age of five.<br />
Ref: UNICEF (2007b), Save the Children (2008).<br />
As many as 60 countries across the globe have been prioritized for urgent action, based on two criteria:<br />
countries with more than 50 per thousand deaths of children under five and countries with an annual<br />
under-five mortality of at least 90 per 1000 live births. In 2005, these 60 countries accounted for 93 per<br />
cent of all deaths of children under five. India figures prominently among these countries and shares<br />
place along with four other South Asian countries. Regrettably, India does not appear to be on track to<br />
achieve the MDG–4 (UNICEF, 2006) (See Box 3.1).<br />
A statistical analysis of the NFHS–3 data across states reveals that micro-nutrient intake bears a<br />
significant negative correlation with proportion of underweight children as well as under-five mortality.This<br />
implies that an increased intake of micronutrient are associated with reduced risks of under-nutrition,<br />
which in turn, contributes to reduction in under-five mortality (Table 3.1).<br />
Table 3.1: Correlation between Micronutrient Intake and Under-nutrition and Mortality Status<br />
Under 5 Underweight Vitamin Iron<br />
Mortality Children Intake Intake<br />
Under 5 Mortality 1.00 0.714** - 0.501** - 0.523**<br />
Underweight Children 1.00 - 0.227 - 0.450*<br />
Vitamin Intake 1.00 0.555**<br />
Iron Intake 1.00<br />
** Correlation significant at 0.01 level. * Correlation is significant at 0.05 level.<br />
ANALYSIS OF FOOD SECURITY<br />
29
Table 3.2: Indicators used to compute Food Security Outcome Index (FSOI)<br />
Under-Five Mortality Under-weight Children FSOI<br />
Districts Value Rank Value Rank Value Rank<br />
Ajmer 121.2 17 69.1 29 0.469 23<br />
Alwar 103.3 10 57.6 15 0.605 9<br />
Banswara 168.7 31 41.7 1 0.493 19<br />
Baran 130.3 20 66.9 25 0.453 25<br />
Barmer 120.9 16 72.6 32 0.446 26<br />
Bharatpur 112.4 13 45.4 3 0.656 6<br />
Bhilwara 152.8 28 50.2 5 0.489 20<br />
Bikaner 73.6 1 70.2 31 0.620 7<br />
Bundi 123.1 19 63.9 21 0.497 18<br />
Chittaurgarh 154.7 29 65.2 22 0.383 31<br />
Churu 89.9 6 66.9 25 0.588 11<br />
Dausa 117.8 14 54.2 11 0.579 12<br />
Dhaulpur 133.1 21 61.6 18 0.479 22<br />
Dungarpur 173.9 32 57.0 14 0.374 32<br />
Ganganagar 81.0 5 50.6 7 0.726 3<br />
Hanumangarh 75.5 3 50.5 6 0.745 2<br />
Jaipur 101.7 9 56.9 13 0.615 8<br />
Jaisalmer 108.6 12 69.6 30 0.507 17<br />
Jalor 134.9 23 51.8 8 0.538 15<br />
Jhalawar 118.4 15 52.6 10 0.588 10<br />
Jhunjhunu 74.9 2 58.7 16 0.692 4<br />
Jodhpur 95.6 7 52.1 9 0.667 5<br />
Karauli 122.1 18 58.7 16 0.535 16<br />
Kota 103.6 11 63.1 20 0.567 13<br />
Nagaur 100.4 8 68.6 28 0.541 14<br />
Pali 159.9 30 48.1 4 0.480 21<br />
Rajsamand 144.2 26 66.2 23 0.411 30<br />
Sawai Madhopur 137.4 24 66.5 24 0.432 28<br />
Sikar 79.0 4 44.3 2 0.775 1<br />
Sirohi 134.0 22 68.5 27 0.430 29<br />
Tonk 143.6 25 62.1 19 0.441 27<br />
Udaipur 150.4 27 54.5 12 0.469 23<br />
Source: Underweight Children - RCH-DLHS (2002-04): Under Five Mortality – Computed from Census (1991 and 2001) by F. Ram, Usha Ram and Chander<br />
Shekhar for ‘Strengthening State Plans for Human Development’ (IIPS).<br />
30 FOOD SECURITY ATLAS OF RURAL RAJASTHAN
It follows from the preceding discussions, that child under-nutrition status and mortality appear to be<br />
an overall outcome of food insecurity. It thus necessitates to combine these two indicators to compute<br />
an overall index of food security outcome in Rajasthan (see Table 3.2).<br />
The under-five mortality has been found to be lowest (73.6) in Bikaner district, whereas Dungarpur district<br />
has the highest (173.9) under-five mortality. As far as the underweight children in different districts are<br />
concerned, the lowest proportion (41.7) has been found in Banswara and the highest proportion (72.6)<br />
of such children is in Barmer. The Food Security Outcome Index has been calculated based on these<br />
two indicators. However, since both the indicators are negative indicators, meaning that their high values<br />
are associated with a more insecure outcome, the FSO index has been reversed so as to get high value<br />
for secure region.<br />
Districts have been divided into five groups on the basis of this index – secure, moderately secure,<br />
moderately insecure, severely insecure, and extremely insecure – each category representing the relative<br />
severity of the outcome of food insecurity (Table 3.3 and Map 3.1).<br />
The FSO index shows that eight districts are secure and moderately secure. Sikar, Hanumangarh,<br />
Ganganagar are among the secure districts in terms of food security outcome. Broadly, these districts<br />
are agriculturally developed and equipped with infrastructure like good road connectivity, etc. Most<br />
districts, however, are in the category of food insecurity. Eight districts are extremely food insecure,<br />
nine districts are severely insecure and only seven districts are in the moderate food insecure position.<br />
The districts in the southern parts of the states are extremely food insecure. Baran, Barmer, Tonk, Sawai<br />
Madhopur, Sirohi, Rajsamand, Chittaurgarh and Dungarpur are some of the extremely insecure districts.<br />
What this shows is that most of the state of Rajasthan requires attention to improve the food security<br />
outcomes.<br />
Table 3.3: Status of Districts in Terms of FSOI<br />
Secure Moderately Moderately Severely Extremely<br />
Secure Insecure Insecure Insecure<br />
Sikar Jhunjhunu Alwar Karauli Baran<br />
Hanumangarh Jodhpur Jhalawar Jaisalmer Barmer<br />
Ganganagar Bharatpur Churu Bundi Tonk<br />
Bikaner Dausa Banswara Sawai Madhopur<br />
Jaipur Kota Bhilwara Sirohi<br />
Nagaur Pali Rajsamand<br />
Jalor Dhaulpur Chittaurgarh<br />
Ajmer<br />
Dungarpur<br />
Udaipur<br />
ANALYSIS OF FOOD SECURITY<br />
31
Map 3.1: Food Security Outcome Map of Rajasthan<br />
32 FOOD SECURITY ATLAS OF RURAL RAJASTHAN
3.2 Explaining Food Security<br />
Taking the child mortality and child malnutrition rates as the outcomes of food security, one could rank<br />
districts on the basis of this index, as done above. If the objective of the exercise were merely to decide<br />
on the districts in which to concentrate food security interventions, then such a ranking would be<br />
sufficient. But this would say nothing about the types of interventions that should be undertaken specific<br />
to region in order to improve food security, which is one of the key objectives of the study.<br />
Food security indicators can draw attention to the factors that distinguish the food secure from the<br />
food insecure districts. These indicators can point out the specific areas in which the food insecure<br />
districts differ the most from food secure districts. However, such association between indicators in an<br />
index cannot tell us their exact causal relation with food security. For instance, if we find that adult female<br />
literacy is consistently higher in food secure districts and consistently lower in food insecure districts<br />
that only show a correlation between adult female literacy and food security. Why such a relation holds<br />
is something that is a matter for analysis. Whether it is due to an enhanced women’s agency contributing<br />
to a better utilization of household income, or through literate women having a better knowledge of<br />
improved nutritional practices, or some other relation, it is for analysis to bring out these relations. But<br />
the indicators can draw attention to the issues for which significant differences exist. It would even be<br />
possible to rank these variables, a rank that would point to the extent to which these variables are different<br />
between districts. Such an analysis could also point to variations between food insecure districts – the<br />
same variables may not contribute the most to the low index in all districts, or some of them may even<br />
move in opposite directions.<br />
Food security is the ability of a household to command food (its food entitlements), generally acquired<br />
through the net result of its livelihood activities (plus any other non-livelihood-based entitlements), that<br />
is crucial in determining food security of the household. These livelihood activities, from the point of<br />
view of food security, are valued not only for the food they might directly produce, if at all they produce<br />
food, but also from the point of the command over food that they give to the household. It is at this<br />
level of effective demand for food (both consumed out of self-production and purchased) that market<br />
failures take place, requiring public intervention of different kinds. Food production, or agricultural<br />
production more broadly, then enters as a part, even the main part, of rural livelihood activities that<br />
provide command over food.<br />
Within a household, it is known that there are gender differences in entitlements. Consequently, it is<br />
necessary to deal with not just factors influencing household entitlements, but also those influencing<br />
individual entitlements within the household. Factors of gender differentiation and discrimination come<br />
into the picture in influencing individual entitlements of women and men, girls and boys. Further, there<br />
could be a substantial imbalance between the use of energy and its replacement through food. Given<br />
that women generally work longer hours than men and that women also get less nutrition than men,<br />
this imbalance could itself be a factor in nutritional shortfalls for women.<br />
ANALYSIS OF FOOD SECURITY<br />
33
Entitlements are not only based on an individual’s or household’s own economic attainments. There<br />
are also government – or community-based – entitlements. Government-organized entitlements have<br />
been gaining importance, while community-based entitlements are on decline, even among adivasis.<br />
The operation of various schemes, such as the Mid-Day Meal Scheme in schools, bear substantial impact<br />
on the access of children, girls and boys, to food. The performance of these schemes depends<br />
substantially on demand from community for provision of these services, and also on the involvement<br />
of women in local governance. But, the entitlements that come through special interventions have been<br />
separated in this analysis from those that provide the ‘normal’ entitlements to food. Of course, we also<br />
try to see whether there is a connection, as there ought to be, between the food security status of a<br />
district and the public interventions in that district.<br />
It therefore emerges that there are a number of indicators that influence food insecurity in one way or<br />
the other. We have combined these indicators into a set of three broad food security indices:<br />
1. Production factors (at the district level) influencing availability;<br />
2. Household and individual access to food; and<br />
3. Ability to absorb food.<br />
3.2.1 Food Availability<br />
The concern for food availability stems from production and related aspects that sustain a desired level<br />
of food production. Foodgrains are considered to be of paramount significance for household food and<br />
nutritional security, the reason being that cereals and pulses are staple foods and there are no perfect<br />
substitutes for them (Chand, 2007). Foodgrains are also the cheapest source of energy compared to<br />
other foods and are indispensable for the food security of low income classes (Chand and Kumar, 2006).<br />
In our analysis, the following indicators have been chosen to determine a broad picture of food availability:<br />
1. Per Capita Value of Agricultural Production: Agricultural output is an indicator reflecting<br />
availability of food. Since agriculture is dependent on climate, it is advisable to take an average<br />
of three to five years’ data of agricultural production to take into account the variability of<br />
production. Food and non-food production both would be included since non-food production<br />
would contribute to the income of households and therefore have an impact on food security.<br />
To account for variations in population across districts, the per capita value of agricultural<br />
production has been used.<br />
2. Proportion of Forests: Forests are a form of common property resource. Availability of forest<br />
area can affect food security as access to forest products provides income and supports<br />
nutrition, depending on the type and magnitude of the produce. But there are both legal and<br />
34 FOOD SECURITY ATLAS OF RURAL RAJASTHAN
geographical restrictions on developing production in forest areas. Thus, it can be assumed<br />
that forest area is negatively associated with food security, since it limits the extension of<br />
agricultural production.<br />
3. Irrigation Extent: Irrigation has a key role in both stabilizing agricultural production and, through<br />
an increase in cropping intensity and an associated increase in productivity, improving a district’s<br />
food security position. It would also provide a better prospect in terms of rural employment.<br />
4. Rural Connectivity: Access to paved roads has a big role in development. It reduces<br />
transport costs and can reduce transaction costs, with possible positive results on the prices<br />
realized by farmers. By improving communication, roads can increase the options available<br />
to rural producers, connecting them with larger national, regional and even international<br />
markets. Studies of rural roads have shown that they raise the productivity and value of<br />
land for poor farmers (Jacoby 2000). It has been found that government spending on rural<br />
infrastructure, besides agricultural research and development, irrigation and rural<br />
development programmes targeted to the rural poor, have all contributed to reductions in<br />
rural poverty and increases in agricultural productivity. Marginal government expenditure<br />
on roads, in particular, has been found to have the largest positive impact on productivity<br />
growth (Fan et al., 1999).<br />
3.2.2 Food Access<br />
Access to food or food distribution has been regarded to be the most important factor determining<br />
food security. A household’s access to food depends on its own production of food and the food it can<br />
acquire through sale of labour power or commodities produced by it. These are linked to what Amartya<br />
Sen calls endowment and exchange entitlements: ‘A person starves either because he does not have<br />
the ability to command enough food, or because he does not use this ability to avoid starvation. The<br />
entitlement approach concentrates on the former, ignoring the latter possibility’ (Sen, 1981).<br />
The following indicators have been considered in order to take into account the aspect of food accessibility.<br />
1. Proportion of Agricultural Labourers: The total number of agricultural workers in the country<br />
has been estimated at 259 million as of 2004–05. Of these, more than one-third are wage workers<br />
and almost all of these are casual labourers. Agricultural labourers are characterized by extremely<br />
poor physical and human capital and also the highest poverty levels (NCEUS 2007) which limits<br />
their access to food. Thus, it is expected that higher is the proportion of agricultural labourers<br />
lower will be access to food security, i.e., the more the agricultural labourers in a district, the worse<br />
will be the food security situation.<br />
2. Proportion of Scheduled Tribes and Scheduled Castes: The ST and SC households are known<br />
to be generally more food insecure, largely on account of their economic and social deprivation<br />
ANALYSIS OF FOOD SECURITY<br />
35
– the former on account of geographical marginalization and the latter due to historical<br />
deprivation and exclusion from mainstream – all resulting in political marginalization. The<br />
proportion of ST and SC population in a district has been taken as an indicator of this<br />
marginalization. The assumption is that the greater the ST and SC population in a district the<br />
less it will be associated with food security.<br />
3. Proportion of Working Age Population: The ratio between the productive section of the<br />
population to the economically dependent part is a valid demographic indicator at the household<br />
level. A ratio higher than unity represents a positive scenario, with more productive population<br />
compared to the dependent population. 1 This ‘demographic dividend’, if effectively harnessed,<br />
leads to prosperity and hence food security (Chandrasekhar et al. 2006).<br />
4. Per Capita Consumption Expenditure: The NSS estimates of per capita consumption<br />
expenditure, adjusted for inequality, is a proxy for per capita income reflecting a significant<br />
dimension of access to food. This variable accounts for all sources of income, including those<br />
which are depicted through availability of food as measured in terms of value of agricultural<br />
output. For instance, a district with low value of agricultural output along with a high value of<br />
consumption would mean that non-agricultural income, including remittances from migrants,<br />
plays a role in enabling consumption to be higher than agricultural production. This is the only<br />
way in which we can indirectly bring migration, which is such a crucial component of households’<br />
food security strategies, into the picture.<br />
5. Rural Female Literacy: It is well-known that there are gender-based inequalities in food<br />
consumption within a household. Consequently, mere household consumption data or per<br />
capita household consumption data would not tell us the story of intra-household distribution<br />
of food and related facilities, such as access to medical services, which would affect the<br />
nutritional status of females, women and girls. That such gender-based inequalities in<br />
household food consumption exist is attested by numerous case studies (see those reviewed<br />
in Bina Agarwal, 1994). Further, very high incidence of anaemia among women and girls shows<br />
that females are nutritionally deficient even in households that are not otherwise poor or<br />
nutritionally deficient. We have used the rural female literacy rate as the variable to represent<br />
gender-based inequality in household consumption. The argument is that a higher literacy<br />
rate for women is more likely to enable women to enhance their roles in family decision-making<br />
and increase their share of household consumption. At the same time, higher women’s literacy<br />
is also likely to lead to better knowledge of nutritional systems and improved health practices<br />
in the household.<br />
1. One of the traits of any developed economy is a lower fertility rate, which leads to a ‘bulge’ in the working age group, thus improving the dependency ratio (reverse<br />
of working age group ratio), making it less than unity.<br />
36 FOOD SECURITY ATLAS OF RURAL RAJASTHAN
6. Wage Rate of Rural Persons: Casual wage workers constitute about one-fifth of the workers<br />
in the unorganized non-agricultural sector while almost all agricultural labourers are casual<br />
workers (NCEUS 2007). Casual workers tend to be the least protected and have the lowest level<br />
of earnings. The understanding is that agricultural labour, without the backing of self-produced<br />
food, is particularly vulnerable to food insecurity. There is, therefore, a particular concern with<br />
the earnings of agricultural labour.<br />
3.2.3 Food Absorption<br />
The ability of the body to translate food intake into nutritional status is mediated by a number of factors,<br />
some genetic and others related to hygiene and morbidity.<br />
The following indicators have been chosen to determine a broad picture of food absorption:<br />
1. Access to Safe drinking Water: Reduction of the proportion of people without access to safe<br />
drinking water by half has been mentioned as part of the seventh Millennium Development Goal.<br />
Polluted and contaminated water undermines the safety and nutritional well-being of individuals.<br />
Studies have shown that water and sanitation account for a substantial portion of the difference<br />
in infant and child mortality rates experienced by the rich and the poor (Leipziger et al. 2003).<br />
Clean and safe water supply is an essential element for achieving food security and good<br />
nutrition.<br />
Though India has taken huge strides in terms of provision of safe drinking water since<br />
Independence, the fact remains that more people in India lack this basic minimum necessity<br />
now than 50 years ago. This is besides the fact that more people are vulnerable to water-borne<br />
diseases (Gujja & Shaik 2005). Empirical studies have shown that water quality is a big problem<br />
in rural areas (Krishnan et al. 2003). Almost two million children die each year because of lack<br />
of clean water and sanitation (UNICEF 2007c). The availability and quality of potable water is<br />
a big factor that affects food insecurity. As there is no direct method for calculating access to<br />
safe drinking water, we have considered access to a tubewell, tap and handpump as three<br />
ways of acquiring safe drinking water.<br />
2. Access to Primary Health Services: Public health services, which reduce a population’s<br />
exposure to disease through such measures as sanitation and vector control, are an essential<br />
part of a country’s development infrastructure. The health infrastructure prevents the local<br />
inhabitants from exposure to diseases, for instance, through assuring food safety, vector control<br />
and health education to improve personal health behaviour (Gupta 2005). In rural areas, all the<br />
health services are pivoted around the PHCs, hence we have taken access to them as an<br />
indicator determining food absorption.<br />
ANALYSIS OF FOOD SECURITY<br />
37
Table 3.4: Rajasthan - Indicators Used to Analyze Food Security<br />
Name of Variable and Description Sources Ref. Year<br />
(a)<br />
Availability<br />
1. Proportion of net irrigated area to net sown Agricultural Statistics of 2003-04<br />
area Rajasthan, 2003-04<br />
2. Per capita value of agricultural output Department of Agriculture, 2002-03 to<br />
Government of Rajasthan 2004-05<br />
http://rajasthankrishi.<br />
gov.in/Departments/Agriculture/<br />
main.asp?t=statics_top.<br />
htm&p=statics_index_new.htm<br />
3. Percentage of inhabited villages having Census of India, 2001 2001<br />
access to paved roads<br />
4. Percentage of forest area to total Department of Forest, 2003<br />
geographical area<br />
Government of Rajasthan<br />
(b) Access<br />
1. Percentage of agricultural labour to total Census of India, 2001 2001<br />
workers*.<br />
2. Proportion of ST and SC population Census of India, 2001 2001<br />
to total population*<br />
3. Working Age Population Census of India, 2001 2001<br />
4. Per capita monthly consumption expenditure 61 st NSS round 2004-05<br />
(inequality adjusted)<br />
5. Rural casual wage rate 61 st NSS round 2004-05<br />
6. Female literacy rate (7+) Census of India, 2001 2001<br />
(c) Utilization<br />
1. Percentage of households having access to Census of India, 2001 2001<br />
safe drinking water<br />
2. Percentage of inhabited villages having Census of India, 2001 2001<br />
access to PHCs<br />
(d) Public Entitlement<br />
1. Percentage of ICDS beneficiaries to total Department of Women 2006<br />
project population<br />
and Child Development,<br />
Government of Rajasthan<br />
* These indicators are inversely related to food security. The direction of their indices has been reversed to have a positive association with food security.<br />
** These variables are not used for calculation of indices. They are used for analysis of the indices.<br />
38 FOOD SECURITY ATLAS OF RURAL RAJASTHAN
3.3 Food Security Index (FSI)<br />
The FSI is a composite index covering three dimensions, i.e., Availability, Access, and Absorption<br />
discussed above. Districts having higher index value are considered relatively more food secure<br />
compared to districts with lower index values. All variables included in the index are for rural areas,<br />
unless otherwise specified.<br />
Besides these three dimensions, an additional component, i.e. public entitlement, has been used to explain<br />
how this influences food security. But the public entitlement factor is not included in the index of food<br />
security. The reason is that public entitlements enter to make up for deficiencies in normal, private<br />
entitlements. The lower the level of food security, the greater should be public entitlement.<br />
For each of the dimensions, as discussed earlier, some relevant variables have been chosen. All<br />
indicators used to calculate the composite index should be positively related to the index. In order to<br />
do that, some of the variables have been reversed. Table 3.4 gives the indicators, source of information<br />
and the reference year. (See Appendix 2 Table A2.1 for a description of the variables).<br />
*****<br />
ANALYSIS OF FOOD SECURITY<br />
39
4. Food Availability<br />
4. Food Availability<br />
This chapter analyses food availability across a number of component dimensions. Broadly these<br />
dimensions are production and productivity, extent of irrigation, proportion of forests, and road<br />
connectivity. The effort is to compare the overall situation in Rajasthan vis-à-vis other States, and then<br />
analyze and map the inter-district disparities. The chapter also shows the position of each district with<br />
respect to the selected indicators, the composite index and map of availability.<br />
4.1 Agricultural Growth<br />
Reflecting the deepening agrarian crisis in the country, growth in agricultural GSDP in India has declined<br />
during the decade 1993-94 to 2003-04 as compared to the preceding decade. More importantly, interstate<br />
disparities among states have also increased. The coefficient of variation in the growth of agriculture<br />
GSDP, that is a measure of the disparities among states, increased significantly from 59 to 103 over the<br />
Table 4.1: Growth of Agricultural GDP and GSDP across States<br />
State 1983-84 to 1993-94 1993-94 to 2003-04<br />
(at 1980-81 Prices)<br />
(at 1993-94 Prices)<br />
Agricultural GSDP GSDP Agricultural GSDP GSDP<br />
Andhra Pradesh 3.05 4.58 2.80 5.63<br />
Assam 2.12 3.51 0.51 2.93<br />
Bihar -0.45 *** 2.69 2.50 5.34<br />
Gujarat 0.84 *** 5.00 1.13 *** 6.19<br />
Haryana 4.86 6.18 1.77 5.96<br />
Himachal Pradesh 3.08 5.89 1.30 6.53<br />
Jharkhand 4.25 4.28<br />
Karnataka 3.54 5.86 3.12 7.10<br />
Kerala 4.40 5.33 -2.00 * 4.85<br />
Madhya Pradesh 2.82 * 5.21 0.23 *** 4.14<br />
Maharashtra 5.39 * 7.42 1.27 4.92<br />
Orissa -0.57 *** 3.39 0.17 *** 3.96<br />
Punjab 4.62 5.13 2.15 4.13<br />
Rajasthan 3.93 6.19 1.21 *** 5.32<br />
Tamil Nadu 4.43 7.45 -0.60 *** 5.08<br />
Uttar Pradesh 2.8 4.66 2.18 3.76<br />
West Bengal 4.45 4.73 3.45 7.03<br />
India 3.05 5.32 2.19 6.01<br />
CV for States 58.72 25.43 102.88 22.75<br />
Note:Growth is Compound Annual Growth Rate. GSDP denotes Gross State Domestic Product. All growth rates are significant at 5 per cent, but for * which<br />
is significant at 10 per cent and *** which is insignificant even at 20 per cent. CV denotes coefficient of variation.<br />
Source: CSO, Gross State Domestic Product, Various Years.<br />
40 FOOD SECURITY ATLAS OF RURAL RAJASTHAN
Box 4.1: Agricultural Production and Food Security<br />
It is commonly believed that agricultural production directly affects food security. However, there is more to it than a mere<br />
direct link. Rising agricultural productivity increases rural incomes and lowers food prices, making food more accessible to<br />
the poor. Improving irrigational facilities and drought-tolerant crops reduce income variability by mitigating the impact of<br />
drought. Productivity enhancements are key to greater food security for households with limited access to food markets.<br />
Nutritionally enriched crops give access to better diets, particularly through biofortification that substantially improves nutrient<br />
content of the crop.<br />
Thus investments in agriculture are important to ensure food security. However, there is an increasing concern on global<br />
food security in future, largely consequent upon growing resource scarcity and climate change. In the present world many<br />
countries have diversified their export base and trade at large stabilizes food availability. However, food availability is still<br />
a concern in many agriculture-based countries. Many countries have declining per capita production of food staples. Further,<br />
staple crop production in most of these countries is rain-fed and experiences large fluctuations caused by climatic variability.<br />
The increase or even sustenance of the present level of production is limited by a number of factors – land constraints,<br />
water scarcity, high energy prices – all over encompassed by the uncertain effects of climate change, which has been<br />
considered to be one of the areas of greatest uncertainties for agriculture. The combined effects of higher average<br />
temperatures, greater variability of temperature and precipitation, more frequent and intense droughts and floods and reduced<br />
availability of water for irrigation can be devastating for agriculture, particularly in the tropical regions. It has been predicted<br />
that agricultural GDP in Sub-Saharan Africa could contract by anywhere from 2 to 9 per cent.<br />
Source: World Development Report, 2008<br />
two periods. Some agriculturally developed states like Punjab, Haryana, Maharashtra, Tamil Nadu, etc.<br />
witnessed a decline in their agricultural growth rates (largely on account of a high base). Rajasthan also<br />
experienced a similar pattern of declining rate of agriculture growth (Table 4.1).<br />
A brief comparison with the major agricultural states of the country 1 sheds light on the poor state of<br />
agricultural development in Rajasthan. As a large state, it contributes proportionately much less, just<br />
about seven per cent, to the aggregate national agricultural production due to low productivity levels<br />
in the state (Table 4.2). The yield levels of food grains are quite low, lying far below the national average.<br />
The state has both the lowest and the most uncertain rainfall. Rainfall is erratic and unevenly distributed,<br />
leading to crop failures and frequent drought situations. Added to this is the low extent of irrigation i.e.<br />
just about one-third of the agricultural land. Groundwater is the major source of irrigation, accounting<br />
for about 68 per cent share in total area irrigated. In recent years, there has been a faster depletion of<br />
aquifers, attributed to low rainfall conditions and over-exploitation by well owners (Singh, 2007). All this<br />
shows that the scope for agricultural development in Rajasthan may be quite narrow, or may require<br />
high investments (as in Israel) to overcome these limits. It would also be necessary to further utilize<br />
surface water, rather than the fast-depleting groundwater.<br />
1. Temperature increases have found to be reducing crop duration, increasing crop respiration rates, developing new equilibrium between crops and pests, increase<br />
evapo-transpiration and so on. Indirectly, the land usage would be substantially affected due to snowmelt, availability of irrigation, frequency and intensity of<br />
droughts and flood, etc (Agarwal, 2007).<br />
FOOD AVAILABILITY<br />
41
Table 4.2: Level of Agricultural Development<br />
State % of National Foodgrain Instability in Cropping Irrigation<br />
Foodgrain Yield Foodgrain Intensity 2 Extent 3<br />
Production (TE 2005-06) Production 1<br />
(TE 2005 Rank kg / ha Rank (1991- Rank (%) Rank (%) Rank<br />
-06) 2005)<br />
India 100 1714 9.4 134.4 39.6<br />
Andhra Pradesh 7.1 4 2155 4 18.9 7 121.7 11 38.1 7<br />
Assam 1.8 15 1437 9 6.2 2 143.1 6 6.2 16<br />
Bihar 4.5 9 1498 8 17.1 6 138.8 7 60.6 4<br />
Chhattisgarh 2.8 14 1107 14 66.6 14 116.9 13 23.1 12<br />
Gujarat 2.9 12 1554 7 43.6 13 113.8 16 31.6 10<br />
Haryana 6.3 7 3087 2 6.5 3 177.5 2 84.0 2<br />
Jharkhand 1.8 16 1265 12 122.4 15 120.3 12 9.3 15<br />
Karnataka 3.6 10 1275 11 28.7 11 116.6 14 24.9 11<br />
Madhya Pradesh 7.1 5 1184 13 23.9 9 128.4 8 33.5 8<br />
Maharashtra 5.4 8 909 16 25 10 127.2 9 16.9 14<br />
Orissa 3.4 11 1334 10 38.5 12 146 5 22.9 13<br />
Punjab 12.2 2 3996 1 5.8 1 185.9 1 95.4 1<br />
Rajasthan 6.6 6 1053 15 229.6 16 123.8 10 33.4 9<br />
Tamil Nadu 2.9 13 1806 6 20.8 8 115.8 15 50.2 6<br />
Uttar Pradesh 19.7 1 2119 5 9 5 153.4 4 73.7 3<br />
West Bengal 7.8 3 2464 3 6.6 4 176.5 3 54.5 5<br />
Source: Ministry of Agriculture, Govt. of India (Various Years).<br />
1 Instability in production = standard deviation of growth rates of total food grain production (1991-2005)<br />
2 Cropping Intensity = Gross Area Sown / Net Area Sown (expressed as percentage)<br />
3 Irrigation Extent = Net Area Irrigated / Net Area Sown (expressed as percentage)<br />
Agricultural productivity per hectare in Rajasthan is the second lowest in the country (Table 4.3). This<br />
low productivity is aggravated by very high instability in production. The standard deviation of growth<br />
in foodgrain production is as high as 230, more than double that of Jharkhand, the second worst state<br />
in this respect.<br />
4.2 Per Capita Value of Agricultural Output<br />
Agricultural output is an initial indicator of a district’s rural production. To the extent that availability of<br />
food depends on the level of a district’s production, per capita production can be taken as representing<br />
availability.<br />
Agricultural output is one of the initial indicators of food security that reflect the per capita food production<br />
in rural areas. Per capita agricultural production is determined by the climatic conditions, infrastructure<br />
development and farming practices. The analysis shows that there exists wide variation in the per capita<br />
42 FOOD SECURITY ATLAS OF RURAL RAJASTHAN
Table 4.3: Per Capita Value of Agricultural Output in Rajasthan (in Rupees) per annum,<br />
2002-03 to 2004-05<br />
High Moderate Low Very Low Extremely Low<br />
District Value District Value District Value District Value District Value<br />
Kota 4370 Ganganagar 3857 Bundi 2732 Sawai 1904 Jodhpur 1120<br />
Madhopur<br />
Baran 3962 Hanuman- 2874 Bharatpur 2373 Dhaulpur 1901 Jaisalmer 1088<br />
garh<br />
Source: As stated in Table 3.4, Variable a2.<br />
Jhalawar 2847 Chittaurgarh 2168 Karauli 1753 Bhilwara 1025<br />
Tonk 2125 Jaipur 1656 Churu 977<br />
Alwar 2017 Jhunjhunu 1631 Banswara 880<br />
Map 4.1: Status of Agricultural Production<br />
Dausa 1606 Pali 753<br />
Bikaner 1476 Ajmer 743<br />
Nagaur 1412 Udaipur 595<br />
Sikar 1278 Sirohi 582<br />
Jalor 1246 Barmer 522<br />
Dungarpur 503<br />
Rajsamand 353<br />
FOOD AVAILABILITY<br />
43
agricultural output across districts and regions. In certain districts like Kota and Baran, the value of<br />
per-capita agricultural output is substantial, which can be attributed to the favourable agro-climatic<br />
conditions and availability of sound irrigation facilities which help in enhancing agricultural production.<br />
The moderate agricultural output was recorded in three districts of Ganganagar, Hanumangarh, and<br />
Jhalawar. Largely, these districts fall in the command area of the Indira Gandhi Nahar Project, Chambal<br />
command areas and other minor irrigation programmes. Low output was noticed in five districts of<br />
Bundi, Bharatpur, Chittaaurgarh, Tonk and Alwar (Table 4.3). In these districts, there was low availability<br />
of irrigation facilities compared to the high and moderate ranked districts. Except Bundi district, major<br />
sources of irrigation were minor irrigation projects and groundwater.<br />
Broadly, it can be inferred that in one-third of the districts, per capita agricultural production was very<br />
low. Largely, these districts fall in the arid region. Irrigation facilities are poor in these districts. In twelve<br />
districts of the state, the per capita agricultural production was extremely low. The districts with low<br />
agricultural production fall in the western arid and southern plains (Map 4.1 and Table 4.3). In these<br />
regions, factors like unfavourable agro-climatic conditions, absence of adequate irrigation facilities and<br />
small size of holdings restrict production.<br />
4.3 Per-Capita Value of Livestock Product<br />
Livestock rearing is generally considered as a supplementary source of livelihood. In arid regions like<br />
Rajasthan, the livestock economy contributes more than agriculture, and it is the major source of<br />
livelihood that has strong implications on food security.<br />
Kota district leads in livestock production in the state. It has been noted that in irrigated regions, the<br />
income level derived from the livestock economy is substantial and this is attributed to the abundant<br />
supply of quality feed that helps in improving the productivity of animals. In the western desert region<br />
districts like Jaisalmer and Bikaner, there is dominance of small ruminants which are considered cash<br />
by the herd owners. They sell them at times of financial requirement (Ahuja and Rathore 1987). This<br />
category of animals has contributed considerably to food security, e.g. in Bhilwara district and its<br />
surrounding areas. In other words, animal husbandry is a potential area where public interventions will<br />
help in improving the livelihood conditions of the rural households.<br />
4.4 Coverage of Irrigation Facilities<br />
Irrigation plays a key role in both stabilizing agricultural production as well as increasing the cropping<br />
intensity, productivity and employment, improving a district’s food security position.<br />
Coverage of irrigation facilities is an important indicator that ensures food security in the region. The<br />
extent of irrigation is represented by the ratio of the net area irrigated to the net area sown. In Rajasthan,<br />
less than one-third of the net sown area is irrigated. In other words, there is rain-fed agriculture in 70<br />
per cent of the cultivated area. The districts with high irrigation, good rainfall and good condition of<br />
44 FOOD SECURITY ATLAS OF RURAL RAJASTHAN
Map 4.2: Share of Irrigated Area<br />
Table 4.4 Extent of Irrigation in Rajasthan (Net Irrigated Area to Net Sown Area)<br />
High Moderate Low Very Low Extremely Low<br />
District Value District Value District Value District Value District Value<br />
Alwar 87.59 Bundi 68.59 Karauli 54.47 Banswara 32.85 Nagaur 19.81<br />
Baran 81.00 Dhaulpur 66.22 Jhalawar 52.10 Jalor 30.96 Udaipur 18.19<br />
Kota 78.85 S. Madhopur 57.87 Jhunjhunu 50.52 Chittaurgarh 28.71 Pali 15.83<br />
Bharatpur 75.26 Jaipur 47.01 Tonk 27.87 Ajmer 12.56<br />
Dausa 71.73 Sikar 41.52 Dungarpur 26.59 Jodhpur 10.10<br />
Ganganagar 70.61 Sirohi 38.80 Bhilwara 22.43 Bikaner 9.89<br />
Source: As stated in Table 3.4, Variable a1.<br />
Hanuman- 38.19 Rajsamand 9.65<br />
garh<br />
Jaisalmer 7.96<br />
Barmer 5.84<br />
Churu 4.02<br />
FOOD AVAILABILITY<br />
45
aquifers, are all in canal command areas. In these districts, more than 50 to 80 per cent of the net area<br />
sown is irrigated.<br />
Districts where more than one-fourth to half of the net area sown is irrigated are ranked as medium. (Table<br />
4.4 and Map 4.2) In parts of these districts, the condition of groundwater is good compared to other regions.<br />
The minor irrigation programme has played an important role in the expansion of irrigated area.<br />
Certain districts in the arid western plain and transitional plain of the inland drainage regions have the<br />
lowest proportion of irrigated land. This is because of low and uncertain rainfall and poor groundwater<br />
conditions. According to available estimates, the arid zone in western Rajasthan has brackish<br />
groundwater, with chloride levels above 1000 mg/l. The estimates show that 73 per cent of India’s saline<br />
water area is in the arid region of Rajasthan.<br />
4.5 Status of Road Connectivity<br />
Access to paved roads has a big role in development. It reduces transport costs and can reduce<br />
transaction costs, with possible positive results on the prices realized by farmers. By improving<br />
communication, roads can increase the options for rural producers, connecting them with larger national,<br />
regional and even international markets. Studies of rural roads have shown that they raise the<br />
productivity and value of land for poor farmers (Jacoby 2000). It has been found that government<br />
spending on rural infrastructure besides agricultural research and development, irrigation and rural<br />
development targeted at the rural poor, have all contributed to reductions in rural poverty and agricultural<br />
productivity. The marginal government expenditure on roads, in particular, has been found to be having<br />
the largest positive impact on productivity growth (Fan, et al 1999).<br />
In overall terms, more than half of the villages i.e. 53 per cent, had the facility of road connectivity.<br />
There exists a wide variation in the status of road connectivity across the districts/ regions ranging<br />
from a little more than one-fourth (27 per cent) to more than two-third (68 per cent). In 13 districts of<br />
the state, more than 60 per cent of villages were connected with roads constructed by both the state<br />
and central government. In certain districts, the density of roads and level of agricultural development<br />
are positively related which shows that agencies involved in the process of agricultural development<br />
like the State Agricultural Marketing Board and NABARD were enabled to play an important role in this<br />
regard. The role of other programmes, such as Pradhan Mantri Gram Sadak Yojana is also important.<br />
Districts like Jhunjhunu, Ganganagar, and Pali occupy the leading position in road connectivity where<br />
more than two-thirds of the villages have access. Interestingly, Churu district which ranked among those<br />
districts having a low value of per-capita agricultural output and extremely limited area under irrigation<br />
has the highest position in road connectivity. A moderate position in road connectivity was found in six<br />
districts located in different regions of the states. Broadly, districts located around the Aravali hills have<br />
a low proportion of road connectivity (Table 4.5 and Map 4.3). This may also be due to the high cost of<br />
construction of roads in these areas.<br />
46 FOOD SECURITY ATLAS OF RURAL RAJASTHAN
Map 4.3: Status of Rural Connectivity<br />
Table 4.5: Percentage of Villages having Access to Paved Roads<br />
High Moderate Low Very Low Extremely Low<br />
District Value District Road District Value District Value District Value<br />
Jhunjhunu 67.76 Sikar 59.52 Dausa 51.33 Udaipur 42.84 Jhalawar 27.07<br />
Ganganagar 67.07 Jaipur 57.50 Rajsamand 50.68 Bhilwara 41.56<br />
Pali 65.87 Dhaulpur 56.79 Jaisalmer 49.71 Tonk 41.48<br />
Bikaner 65.06 Nagaur 56.20 Banswara 46.68 Chittaurgarh 40.14<br />
Hanuman- 65.02 Dungarpur 55.36 Bundi 44.52 Baran 37.76<br />
garh<br />
Alwar 64.29 Kota 52.39 Barmer 44.26<br />
Jalor 63.64 S.Madhopur 43.65<br />
Sirohi 63.06<br />
Ajmer 62.12<br />
Jodhpur 61.92<br />
Churu 61.60<br />
Bharatpur 60.78<br />
Karauli 59.95<br />
Source: As stated in Table 3.4, Variable a4.<br />
FOOD AVAILABILITY<br />
47
4.6 Coverage of Forest Areas<br />
Forests are one of the major components of common property resource, which can be considered as<br />
a support of rural livelihood for rural households in general and poor in particular. The extent of forest<br />
lands in a region has strong linkages with food security in rural areas. The livestock economy depends<br />
largely on these lands. The importance of these resources is considerable in the case of a pastoral<br />
economy which is one of the major characteristics of the Rajasthan economy. This is noted from the<br />
fact that there was less than one-tenth of the geographical area under forest cover. In other words,<br />
more than 90 per cent area has been put to other uses including agriculture. As per the forest policy of<br />
India, environmental imbalances exist in the state. As per the norms, one-third of the geographical<br />
area should be under forest cover (GoI, 1988). This proportion may help to maintain the ecological<br />
balance in the region.<br />
In Rajasthan, a large numbers of districts have limited area under forest cover. Except for three districts<br />
of Ajmer, Bharatpur and Tonk, other districts with low forest cover fall in the western part of the state.<br />
This is, of course, the desert region of the state. In districts with low forest coverage, pastoral activities<br />
are one of the major sources of livelihood. Seven districts located in the semi-arid eastern plains have<br />
7 to 11 per cent forest cover, which is considered very low in the context of food security. In Alwar,<br />
Sawai Madhopur, Dhaulpur and Dungarpur districts, the proportion of forest coverage was varying from<br />
about 17 to 21 per cent of the total geographical area of the districts. The districts that have a proportion<br />
of forest cover from one-fifth to one-fourth were Kota, Chittaurgarh, Banswara and Jhalawar. A high<br />
Table 4.6: Proportion of Forest Area in Rural Rajasthan<br />
High Moderate Low Very Low Extremely Low<br />
District Value District Value District Value District Value District Value<br />
Udaipur 35.90 Bundi 28.42 Alwar 21.58 Rajsamand 10.84 Ajmer 7.23<br />
Karauli 33.45 Kota 24.80 S.Madhopur 21.15 Dausa 9.57 Bharatpur 7.06<br />
Sirohi 31.17 Chittaurgarh 24.76 Dhaulpur 21.06 Sikar 8.25 Jhunjhunu 6.84<br />
Baran 30.46 Banswara 24.55 Dungarpur 17.16 Jaipur 8.17 Jalor 5.27<br />
Jhalawar 21.81 Ganganagar 7.90 Tonk 4.61<br />
Bhilwara 7.60 Bikaner 4.08<br />
Pali 7.60 Barmer 2.09<br />
Hanuman- 1.89<br />
garh<br />
Nagaur 1.33<br />
Jaisalmer 0.82<br />
Jodhpur 0.82<br />
Churu 0.48<br />
Source: As stated in Table 3.4, Variable a5.<br />
48 FOOD SECURITY ATLAS OF RURAL RAJASTHAN
Map 4.4: Share of Area under Forests<br />
proportion of the forest cover was found in five districts of Udaipur, Karauli, Sirohi, Baran and Bundi,<br />
which fall in the south-eastern region of the state (Table 4.6 and Map 4.4). Districts where forest coverage<br />
was high and moderate also have a concentration of tribal population that is dependent to a large extent<br />
on forest resources for their livelihood.<br />
4.7 Food Availability Index<br />
Table 4.7 presents district wise value and ranks of indicactors that have been used to compute Food<br />
Availability Index.<br />
Table 4.8 and Map 4.5 shows the status of districts in terms of the Food Availability index. Ganganagar,<br />
Kota, Alwar and Bharatpur have been identified as secure in terms of the availability index. On the other<br />
hand Bhilwara, Jaisalmer, Udaipur, Rajsamand and Barmer are extremely insecure. In all, 11 districts<br />
fall in secure and moderately secure categories in the availability index and the remaining 21 districts<br />
have been identified as insecure in the food availability index.<br />
FOOD AVAILABILITY<br />
49
Map 4.5: Food Availability Map of Rural Rajasthan<br />
50 FOOD SECURITY ATLAS OF RURAL RAJASTHAN
Table 4.7: Indicators used to Compute Availability Index<br />
District Irrigation Per capita value Rural<br />
extent of agricultural output connectivity<br />
Value Rank Value Rank Value Rank<br />
Ajmer 12.56 26 743 27 62.12 9<br />
Alwar 87.59 1 2017 10 64.29 6<br />
Banswara 32.85 17 880 25 46.68 23<br />
Baran 81.00 2 3962 2 37.76 31<br />
Barmer 5.84 31 522 30 44.26 25<br />
Bharatpur 75.26 4 2373 7 60.78 12<br />
Bhilwara 22.43 22 1025 23 41.56 28<br />
Bikaner 9.89 28 1476 17 65.06 4<br />
Bundi 68.59 7 2732 6 44.52 24<br />
Chittaurgarh 28.71 19 2168 8 40.14 30<br />
Churu 4.02 32 977 24 61.60 11<br />
Dausa 71.73 5 1606 16 51.33 20<br />
Dhaulpur 66.22 8 1901 12 56.79 16<br />
Dungarpur 26.59 21 503 31 55.36 18<br />
Ganganagar 70.61 6 3857 3 67.07 2<br />
Hanumangarh 38.19 16 2874 4 65.02 5<br />
Jaipur 47.01 13 1656 14 57.50 15<br />
Jaisalmer 7.96 30 1088 22 49.71 22<br />
Jalor 30.96 18 1246 20 63.64 7<br />
Jhalawar 52.10 11 2847 5 27.07 32<br />
Jhunjhunu 50.52 12 1631 15 67.76 1<br />
Jodhpur 10.10 27 1120 21 61.92 10<br />
Karauli 54.47 10 1753 13 59.95 13<br />
Kota 78.85 3 4370 1 52.39 19<br />
Nagaur 19.81 23 1412 18 56.20 17<br />
Pali 15.83 25 753 26 65.87 3<br />
Rajsamand 9.65 29 353 32 50.68 21<br />
Sawai Madhopur 57.87 9 1904 11 43.65 26<br />
Sikar 41.52 14 1278 19 59.52 14<br />
Sirohi 38.80 15 582 29 63.06 8<br />
Tonk 27.87 20 2125 9 41.48 29<br />
Udaipur 18.19 24 595 28 42.84 27<br />
Source: As stated in Table 3.4.<br />
FOOD AVAILABILITY<br />
51
Table 4.8: Status of Districts in Food Availability Index<br />
Secure Moderately Moderately Severely Extremely<br />
Secure Insecure Insecure Insecure<br />
District Value District Value District Value District Value District Value<br />
Ganganagar 0.6864 Baran 0.5866 Jaipur 0.4543 Jhalawar 0.3847 Bhilwara 0.2655<br />
Kota 0.6691 Dhaulpur 0.5270 S.Madhopur 0.4367 Bikaner 0.3577 Jaisalmer 0.2592<br />
Alwar 0.6396 Hanuman- 0.5204 Sikar 0.4271 Pali 0.3459 Udaipur 0.2364<br />
garh<br />
Bharatpur 0.5992 Bundi 0.5171 Jalor 0.4099 Nagaur 0.3455 Rajsamand 0.2333<br />
Jhunjhunu 0.5136 Sirohi 0.4008 Tonk 0.3372 Barmer 0.1984<br />
Dausa 0.5048 Chittaurgarh 0.3357<br />
Karauli 0.4955 Jodhpur 0.3260<br />
Dungarpur 0.3195<br />
Banswara 0.3175<br />
Ajmer 0.3167<br />
Churu 0.2972<br />
*****<br />
52 FOOD SECURITY ATLAS OF RURAL RAJASTHAN
5. Access to Food<br />
5. Access to Food<br />
The critical significance of access to food emerges from Sen’s description of the Bengal famine, where<br />
people went hungry and starved, not because food was not available, but because they could not afford<br />
it (Sen, 1981). He linked the issue of access to a person’s ‘entitlements’. Broadly, entitlements refer to<br />
the bundle of goods and services a person can acquire, based on his or her endowments such as<br />
wealth and assets, skills, knowledge, status and so on. Thus, availability of food is necessary but not<br />
enough to ensure food security; it should also be affordable and people should be able to access it.<br />
Access is tied up with people’s capacity to buy, their earnings, livelihoods and other socio-economic<br />
factors.<br />
Access of those who may individually lack the ability to secure enough food is often bolstered through<br />
community groups and self-help groups (SHGs). Thus, the ability to form and take action in groups is<br />
an important factor for ensuring entitlements.<br />
Historic injustice and discrimination faced by the Scheduled Castes and Tribes, other marginalized<br />
groups and women are well-documented. This discrimination permeates all aspects of life including<br />
their livelihoods, education, health, participation in political life and access to food and the benefits of<br />
government programmes. Access to food thus depends both on the availability of economic<br />
opportunities and the social inclusion of the population in availing those opportunities.<br />
The indicators that have been taken to discuss food access are rural wages, monthly per capita<br />
expenditure, agricultural labourers, proportion of Scheduled Castes and Scheduled Tribes, ratio of<br />
working age population, rural female literacy, women’s workforce participation and urbanization. The<br />
overall status of Rajasthan in relation to other states is presented first and thereafter we discuss the<br />
disparities across districts. Finally, we present the overall index of food access across districts and<br />
map food access.<br />
5.1 Rural Wages<br />
Casual workers tend to be the least protected and have the lowest level of earnings. The NSS defines<br />
the casual wage worker as one who was casually engaged in others’ farm or non-farm enterprises<br />
(both household and non-household) and, in turn, received wages according to the terms of the<br />
daily or periodic work contract. It can be seen that Rajasthan provides lower wage rates (Rs. 62)<br />
in comparison to many other major states like Kerala (Rs. 120), Punjab (Rs. 73.12) and Haryana<br />
(Rs. 72.20) (Table 5.1).<br />
Rural wage rates are determined by various factors such as status of agricultural development,<br />
including area and productivity of crops, size of holdings, and irrigation facilities (Acharya, 2005).<br />
Broadly, the districts that have low wage rates have high proportion of tribal population and are<br />
characterized by limited sources of livelihood. In these areas, the labour force is available at a<br />
cheaper rate as compared to other districts. The more urbanized central belt of Rajasthan, which<br />
also lies along the Delhi-Mumbai highway, also has generally higher agricultural wages. Maximum<br />
ACCESS TO FOOD<br />
53
Table 5.1: Wage Rate of Casual Workers by State (in Rupees)<br />
India/States Value Rank States Value Rank<br />
India 48.89 - Kerala 119.51 1<br />
Andhra Pradesh 42.13 12 Madhya Pradesh 35.76 16<br />
Assam 60.18 5 Maharashtra 38.58 14<br />
Bihar 43.95 11 Orissa 38.45 15<br />
Chhattisgarh 34.07 17 Punjab 73.12 2<br />
Gujarat 49.72 8 Rajasthan 62.12 4<br />
Haryana 72.2 3 Tamil Nadu 56.48 6<br />
Jharkhand 48.07 10 Uttar Pradesh 51.25 7<br />
Karnataka 41.32 13 West Bengal 48.38 9<br />
Source: NSS 59 th Round – Situation Assessment Survey of Farmers, 2005.<br />
Map 5.1: Wage Rates of Rural Population<br />
54 FOOD SECURITY ATLAS OF RURAL RAJASTHAN
Table 5.2: Status of Rural Wages in the Districts of Rajasthan (in Rupees), 2004-05<br />
High Moderate Low Very Low Extremely Low<br />
District Value District Value District Value District Value District Value<br />
Jhunjhunu 92.55 Hanumangarh 81.95 Kota 71.58 Barmer 64.60 Tonk 56.85<br />
Source: As stated in Table 3.4, Variable b5.<br />
Jaisalmer 70.55 Bharatpur 64.29 Udaipur 54.49<br />
Jalor 70.38 Ganganagar 64.17 Ajmer 54.13<br />
Dhaulpur 68.87 Bundi 64.08 Bhilwara 54.00<br />
Sawai 68.08 Bikaner 62.83 Sirohi 52.23<br />
Madhopur<br />
Sikar 67.99 Dausa 62.10 Dungarpur 52.06<br />
Jaipur 67.82 Jodhpur 61.58 Baran 51.22<br />
Churu 66.23 Jhalawar 60.34 Chittaurgarh 51.08<br />
Karauli 60.26 Banswara 48.43<br />
Nagaur 59.30<br />
Rajsamand 59.17<br />
Alwar 59.12<br />
Pali 59.03<br />
wage rates were seen in Jhunjhunu and Hanumangarh districts at Rs. 92.55 and Rs. 81.95 respectively.<br />
On the lower side, Banswara district provided the lowest wage rate of Rs. 48.43. Chittaurgarh,<br />
Baran, Dungarpur, Sirohi, Bhilwara, Ajmer, Udaipur and Tonk are all in the category of extremely<br />
low rural wages (Table 5.2 and Map 5.1).<br />
5.2 Average Per Capita Monthly Expenditure<br />
Low income levels directly affect consumption. The NSS estimates of per capita consumption, adjusted<br />
for inequality, are taken as the primary measure of household access to food. In the earlier discussion,<br />
value of agricultural output per capita has been considered as a variable that relates to availability of<br />
food. Taking both consumption and the value of agricultural output allows us to check whether the<br />
two variables move in the same direction. A low value of agricultural output for a district along with a<br />
high value of consumption would mean that non-agricultural income, including remittances from<br />
migrants, plays a role in enabling consumption higher than agricultural production. In case the per capita<br />
consumption is lower than per capita value of agricultural production, it can be considered as household<br />
savings.<br />
The per capita consumption expenditure in absolute terms is a good indicator of food security in rural<br />
areas. Rajasthan ranks 8th among the major states of India in terms of per capita consumption<br />
expenditure. The value of per capita consumption expenditure (Rs. 324) is higher than the national<br />
average of Rs. 307 by 17 rupees. (Table 5.3).<br />
ACCESS TO FOOD<br />
55
Table 5.3: Monthly Per Capita Expenditure on Food, 2004-05<br />
India/States Value (Rs.) Rank States Value (Rs.) Rank<br />
India 307.60 - Andhra Pradesh 323.15 9<br />
Assam 358.44 4 Bihar 270.26 13<br />
Chhattisgarh 239.08 16 Gujarat 345.46 6<br />
Haryana 419.34 2 Jharkhand 263.22 14<br />
Karnataka 283.04 12 Kerala 455.64 1<br />
Madhya Pradesh 232.17 17 Maharashtra 293.29 11<br />
Orissa 245.58 15 Punjab 416.45 3<br />
Rajasthan 323.97 8 Tamil Nadu 315.49 10<br />
Uttar Pradesh 345.88 5 West Bengal 329.93 7<br />
Source : As stated in Table 3.4, Variable b4.<br />
The district analysis shows that average per capita consumption expenditure varies from Rs. 576 to<br />
Rs. 372 across the districts (Table 5.4). In the majority of the districts, the per capita consumption<br />
expenditure was found to be low. Among these, it was severely low in four districts - Sirohi, Pali, Banswara<br />
and Dungarpur. Broadly, these districts have a high concentration of poor SC/ ST households. In 14<br />
districts, consumption expenditure was also very low. These districts are part of western Rajasthan<br />
where acute scarcity of water resulted in low agricultural and livestock production (see Table 4.3 and<br />
Table 5.4: Monthly Per Capita Consumption Expenditure by District, 2004-05 (Rs.)<br />
High Moderate Low Very Low Extremely Low<br />
District Value District Value District Value District Value District Value<br />
Jhunjhunu 576 Alwar 523 Bundi 484 Baran 451 Pali 396<br />
Source: As stated in Table 3.4, Variable b4.<br />
Chittaurgarh 484 Jhalawar 451 Sirohi 396<br />
Dhaulpur 477 Kota 451 Banswara 372<br />
Karauli 477 Barmer 444 Dungarpur 372<br />
S.Madhopur 477 Jaisalmer 444<br />
Jaipur 474 Jalor 440<br />
Sikar 472 Rajsamand 435<br />
Bharatpur 470 Udaipur 435<br />
Bhilwara 466 Hanuman 431<br />
garh<br />
Ajmer 461 Bikaner 428<br />
Tonk 461 Churu 428<br />
Ganganagar 460 Dausa 425<br />
Jodhpur 418<br />
Nagaur 414<br />
56 FOOD SECURITY ATLAS OF RURAL RAJASTHAN
Map 5.2: Status of Consumption Expenditure<br />
4.4). This also caused low household income which resulted in low consumption expenditure. Only two<br />
districts, Jhunjhunu and Alwar, fall in the two top consumption categories. This shows that rural<br />
consumption is low over almost the entire state (Map 5.2).<br />
5.3 Agricultural Labourers<br />
It is expected that the proportion of agricultural labourers will be negatively related to food security,<br />
i.e. the more the agricultural labourers in a district, the worse will be the food security situation; or, the<br />
more the cultivators in a district, the better will be the food security situation. It is assumed that cultivated<br />
land is positively related to food security. Beside consumption as a whole, there is a particular concern<br />
with the earnings of agricultural labour. The understanding is that agricultural labour, without the backing<br />
of self-produced food, is particularly vulnerable to food insecurity.<br />
Rajasthan has the lowest proportion of agricultural labourers in workforce among the major states of<br />
India (Table 5.5). There are only 12.3 per cent of agricultural labourers in Rajasthan, which is nearly<br />
one-third of the national average and almost four times lower than Bihar which has the highest proportion<br />
of agricultural labourers in its workforce.<br />
ACCESS TO FOOD<br />
57
Table 5.5: Proportion of Agricultural Labourers in Workforce 2001<br />
Area Name Value (%) Rank Area Name Value (%) Rank<br />
India 33 – Andhra Pradesh 47.5 16<br />
Assam 14.9 2 Bihar 51.0 17<br />
Chhattisgarh 36.1 12 Gujarat 33.2 9<br />
Haryana 19.0 3 Jharkhand 32.8 7<br />
Karnataka 34.5 11 Kerala 19.6 4<br />
Madhya Pradesh 34.1 10 Maharashtra 37.8 13<br />
Orissa 39.1 14 Punjab 21.9 5<br />
Rajasthan 12.3 1 Tamil Nadu 42.9 15<br />
Uttar Pradesh 28.9 6 West Bengal 33.1 8<br />
Source: As stated in Table 3.4, Variable b1.<br />
Among districts, the proportion of workers in non-agricultural sectors was substantially higher in the<br />
areas where the agriculture sector has certain constraints in further absorption of the available labour<br />
force. This is attributed to unfavourable agro-climatic conditions on the one hand and availability of<br />
non-farm activities on the other. Besides, growing urbanization has also contributed considerably in<br />
certain areas. In districts where concentration of tribal population is high, the size of land holdings is<br />
so small that it pushed the rural labour force to non-farm activities. It can further be noted that in the<br />
Table 5.6: Share of Agricultural Labour Force in Rajasthan, 2001 (%)<br />
High Moderate Low Very Low Extremely Low<br />
District Value District Value District Value District Value District Value<br />
Baran 28.54 Pali 23.01 Hanuman- 17.70 Ajmer 14.08 Sawai 9.27<br />
garh<br />
Madhopur<br />
Ganga- 27.89 Jhalawar 22.95 Dungarpur 16.56 Jodhpur 12.73 Jaisalmer 9.05<br />
nagar<br />
Kota 25.80 Sirohi 20.60 Bundi 15.01 Udaipur 12.45 Bhilwara 8.09<br />
*Here we have taken 100-% agricultural labour<br />
Source: As stated in Table 3.4, Variable b1.<br />
Rajsamand 14.72 Tonk 11.92 Jhunjhunu 7.95<br />
Bharatpur 14.30 Jalor 11.51 Dhaulpur 7.94<br />
Nagaur 11.50 Bikaner 7.22<br />
Chittaurgarh 11.40 Jaipur 7.08<br />
Karauli 10.93 Dausa 6.96<br />
Banswara 10.75 Sikar 6.55<br />
Alwar 9.57 Churu 4.96<br />
Barmer 4.77<br />
58 FOOD SECURITY ATLAS OF RURAL RAJASTHAN
Map 5.3: Share of Agricultural Labourers in Total Working Population<br />
irrigated north-western plains and humid south-eastern plain, there was a concentration of workers<br />
involved in agricultural operations (Table 5.6 and Map 5.3). In other words, there was a lower proportion<br />
of non-agricultural labour. The reason being the availability of irrigation, which has contributed<br />
substantially to the development of the agriculture sector in these districts.<br />
5.4 Proportion of Scheduled Tribes and Scheduled Castes Population<br />
Scheduled Castes and Scheduled Tribes form the large marginalized community, particularly in the<br />
rural areas. While the Scheduled Tribes are marginalized mostly on account of their location, the<br />
Schedule Castes have faced historical discrimination, which accounts for their marginalized and<br />
vulnerable status. The assumption is that greater proportion of non-ST and non-SC population in a<br />
district will be associated with better food security.<br />
ACCESS TO FOOD<br />
59
Table 5.7: Percentage of Scheduled Tribes and Scheduled Castes in the Rural Population by State<br />
Proportion of<br />
Rural Scheduled Castes<br />
Proportion of<br />
Rural Scheduled Tribes<br />
Value Rank Value Rank<br />
India 17.9 - 10.4 -<br />
Andhra Pradesh 18.4 11 8.4 8<br />
Assam 6.7 1 13.6 11<br />
Bihar 16.4 8 1.0 4<br />
Chhattisgarh 11.4 5 37.6 17<br />
Gujarat 6.9 2 21.6 13<br />
Haryana 21.4 13 0 1<br />
Jharkhand 12.4 6 31.0 16<br />
Karnataka 18.4 11 8.4 8<br />
Kerala 10.8 3 1.5 5<br />
Madhya Pradesh 15.6 7 25.8 15<br />
Maharashtra 10.9 4 13.4 10<br />
Orissa 17.2 9 24.6 14<br />
Punjab 33.0 17 0 1<br />
Rajasthan 17.9 10 15.5 12<br />
Tamil Nadu 23.8 15 1.6 6<br />
Uttar Pradesh 23.4 14 0.1 3<br />
West Bengal 26.9 16 7.2 7<br />
Source: Census of India, 2001.<br />
The proportion of Scheduled Castes in rural Rajasthan is 17.9 per cent which is equal to the national<br />
average. However, the proportion of Scheduled Tribes in Rajasthan is 15.5 per cent, which is 5.1 per<br />
cent points higher than the national average (Table 5.7). The proportion of Scheduled Castes and<br />
Scheduled Tribes in Rajasthan is moderate in comparison to the other states of India.<br />
The district level analysis shows that in a majority of the districts, the concentration of SC/ST<br />
population was very low i.e. less than 30 per cent. In six districts, the concentration of such<br />
categories varied from two-fifth to one-third of the total population of the district. In three districts<br />
located in the southern part of the state, Banswara, Dungarpur and Udaipur, the concentration was<br />
high and moderate respectively. The concentration of SC/ST population in other districts like Karauli,<br />
Sawai Madhopur, Sirohi and Dausa was substantial (Table 5.8 and Map 5.4). These districts are<br />
known as tribal districts in the state.<br />
60 FOOD SECURITY ATLAS OF RURAL RAJASTHAN
Table 5.8: Proportion of Scheduled Castes and<br />
Scheduled Tribes in the Rural Population in Rajasthan, 2001<br />
High Moderate Low Very Low Extremely Low<br />
District SC/ST District SC/ST District SC/ST District SC/ST District SC/ST<br />
Banswara 81.09 Udaipur 62.58 Dausa 50.95 Baran 42.31 Jhalawar 29.34<br />
Dungarpur 72.41 Karauli 49.25 Bundi 42.10 Hanuman 28.90<br />
garh<br />
Source: As stated in Table 3.4, Variable b2.<br />
Sirohi 47.39 Chittaurgarh 39.01 Jaipur 28.59<br />
Sawai 45.99 Ganganagar 38.56 Alwar 27.34<br />
Madhopur<br />
Kota 37.91 Jalor 27.00<br />
Tonk 35.11 Bhilwara 26.89<br />
Rajsamand 26.79<br />
Dhaulpur 26.57<br />
Pali 25.09<br />
Churu 24.78<br />
Bikaner 24.70<br />
Bharatpur 23.76<br />
Barmer 22.24<br />
Nagaur 21.49<br />
Jaisalmer 20.95<br />
Jodhpur 20.67<br />
Ajmer 19.22<br />
Sikar 18.84<br />
Jhunjhunu 18.61<br />
5.5 Ratio of Working Age Population<br />
The proportion of working age population has varied implications for the food security situation in a region.<br />
The working age ratio is the ratio between the working age population (15-59 years) and the dependent<br />
population (less than 15 years and more than 59 years of age). With development, fertility rates decline<br />
and the proportion of population in the working age group increases resulting in a ‘bulge’ in the working<br />
age group. This leads to the hypothesis that the ‘demographic dividend’ derived from this gain would<br />
accelerate economic growth with a more productive population (Chandrasekhar et al, 2006 1 ).<br />
In Rajasthan the ratio of population in the productive age-group is found to be poor compared to many<br />
states as well as to the national average. Only Uttar Pradesh (1.02) and Bihar (1.03) have a lower working<br />
age ratio than Rajasthan (1.06) (Table 5.9).<br />
1. Chandrasekhar and others have shown through employment figures that the absorption of the Indian youth into the labour force is not as high as one would<br />
expect. This is perhaps due to the poor employability of the workforce, which is severely affected by a deficit in educational attainment and health.<br />
ACCESS TO FOOD<br />
61
Map 5.4: Proportion of Scheduled Castes and Scheduled Tribes in Total Rural Population<br />
The categorization of districts in the context of ratio of working age population does not present a uniform<br />
picture. Agriculturally developed districts like Ganganagar, Hanumangarh, Chittaurgarh have a high working<br />
age population. A similar situation can be noticed in certain tribal districts. In some parts of the western<br />
arid and flood-prone eastern regions, the ratio of working age population is considerably high compared to<br />
other districts (Table 5.10). The western districts of Bikaner, Barmer, Jodhpur, Jalor and north-eastern districts<br />
of Bharatpur, Dhaulpur and Karauli have a low ratio of working age population (Map 5.5).<br />
Table 5.9: Ratio of Working Age Population, 2001<br />
India/states Value Rank States Value Rank<br />
India 1.22 – Andhra Pradesh 1.44 3<br />
Assam 1.24 10 Bihar 1.03 16<br />
Chhattisgarh 1.19 12 Gujarat 1.38 5<br />
Haryana 1.21 11 Jharkhand 1.11 13<br />
Karnataka 1.41 4 Kerala 1.70 1<br />
Madhya Pradesh 1.10 14 Maharashtra 1.26 9<br />
Orissa 1.35 7 Punjab 1.37 6<br />
Rajasthan 1.06 15 Tamil Nadu 1.67 2<br />
Uttar Pradesh 1.02 17 West Bengal 1.34 8<br />
Source: Census of India, 2001<br />
62 FOOD SECURITY ATLAS OF RURAL RAJASTHAN
Table 5.10: Ratio of Rural Working Age Population in Rajasthan, 2001<br />
High Moderate Low Very Low Extremely Low<br />
District Value District Value District Value District Value District Value<br />
Chittaurgarh 1.25 Bhilwara 1.17 Rajsamand 1.12 Jaipur 1.06 Karauli 0.99<br />
Ganganagar 1.23 Kota 1.17 Udaipur 1.12 Sikar 1.05 Bikaner 0.99<br />
Hanuman 1.22 Jhalawar 1.17 Tonk 1.12 Pali 1.03 Barmer 0.99<br />
garh<br />
Source: As stated in Table 3.4, Variable b3.<br />
Bundi 1.14 Ajmer 1.11 Alwar 1.02 Bharatpur 0.98<br />
Jhunjhunu 1.10 Dausa 1.02 Jodhpur 0.98<br />
Baran 1.10 Jaisalmer 1.01 Jalor 0.97<br />
Dungarpur 1.09 Churu 1.01 Dhaulpur 0.93<br />
Sawai 1.09<br />
Madhopur<br />
Banswara 1.09<br />
Sirohi 1.07<br />
Nagaur 1.07<br />
Map 5.5: Share of Rural Working Age Population<br />
ACCESS TO FOOD<br />
63
5.6 Rural Female Literacy<br />
Female literacy has been recognized as the single most important factor contributing to increase in<br />
food security and decline in malnutrition and mortality levels (Save the Children, 2008). The rural female<br />
literacy in Rajasthan is very poor (37.3 per cent) in comparison to the other states of India. It ranks<br />
14th among the 17 major states of India and is ahead only of Bihar (29.6), Jharkhand (29.9) and Uttar<br />
Pradesh (36.9) (Table 5.11).<br />
Table 5.11: Status of Rural Female Literacy, 2001<br />
Value Rank Value Rank<br />
India 46.1 - Andhra Pradesh 43.5 12<br />
Assam 50.7 6 Bihar 29.6 17<br />
Chhattisgarh 47.0 10 Gujarat 47.8 9<br />
Haryana 49.3 7 Jharkhand 29.9 16<br />
Karnataka 48.0 8 Kerala 86.7 1<br />
Madhya Pradesh 42.8 13 Maharashtra 58.4 2<br />
Orissa 46.7 11 Punjab 57.7 3<br />
Rajasthan 37.3 14 Tamil Nadu 55.3 4<br />
Uttar Pradesh 36.9 15 West Bengal 53.2 5<br />
Source: Census of India, 2001<br />
Large disparities are seen across the districts in terms of adult female literacy in rural Rajasthan. The<br />
district level rural female literacy in Rajasthan varies from 59.25 per cent in Jhunjhunu to 24.43 per cent<br />
in Banswara. In 11 districts, it is extremely low i.e. less than 30 per cent. In eight districts, it is very low<br />
and a low status was noticed in six districts (Map 5.6). It may be stated that in large parts of the state,<br />
female literacy was low with intra-state variations. The low female literacy rate can be attributed to<br />
various factors including lack of awareness, pastoral nature of the rural economy, out-migration of the<br />
households, male domination etc.<br />
Parts of the Shekhawati region such as Jhunjhunu and Sikar lead in female education. Major industrial<br />
houses belong to this area and they have taken various initiatives for the development of educational<br />
infrastructure. Besides, people work in the service sector in both informal and formal enterprises, and<br />
therefore they have exposure to the rest of the country. This has good implication for human resource<br />
development. Districts such as Churu, Ganganagar, Hanumangarh and Kota have a moderate female<br />
literacy rate. With the exception of Churu district, these districts have a well-developed agriculture sector<br />
which has resulted in increasing the female literacy rate. Kota is also known as an education hub in the<br />
country. The people of this region have vast exposure to the rest of the country because of its emergence<br />
as an educational hub which played an important role in educational attainment in general and by women<br />
in particular. In agriculturally developed districts and some parts of western arid areas with high levels<br />
of tourism, the education level is relatively higher compared to tribal and other backward areas (Table<br />
5.12 and Map 5.6).<br />
64 FOOD SECURITY ATLAS OF RURAL RAJASTHAN
Table 5.12: Status of Rural Female Literacy in Rajasthan, 2001 (%)<br />
High Moderate Low Very Low Extremely Low<br />
District Value District Value District Value District Value District Value<br />
Jhunjhunu 59.25 Churu 50.93 Jaipur 43.86 Baran 37.66 Sirohi 31.29<br />
Sikar 55.27 Kota 49.85 Karauli 42.77 Nagaur 36.85 Chittaurgarh 29.98<br />
Source: As stated in Table 3.4, Variable b6.<br />
Ganganagar 47.19 Barmer 42.04 Jhalawar 35.25 Sawai 29.52<br />
Madhopur<br />
Hanumangarh 46.27 Dausa 40.02 Udaipur 35.14 Dungarpur 28.86<br />
Bharatpur 39.06 Rajsamand 33.02 Bikaner 28.44<br />
Dhaulpur 38.89 Ajmer 32.63 Jaisalmer 27.26<br />
Alwar 38.54 Bundi 32.46 Bhilwara 26.20<br />
Pali 31.65 Jalor 26.18<br />
Tonk 25.66<br />
Jodhpur 24.75<br />
Banswara 24.43<br />
Map 5.6: Status of Female Literacy<br />
ACCESS TO FOOD<br />
65
5.7 Women’s Work Participation Rate<br />
Women's workforce participation (WWPR) improves the household's access to food, and is also likely<br />
to improve the women's own access to food - following Amartya Sen's argument that women's<br />
independent income would increase their bargaining power within the household. At the same time, it<br />
is generally noted that women's participation in the rural workforce declines with improvements in the<br />
household incomes. Women's workforce participation rate tends to be high among agricultural labour<br />
households and goes down as one moves up the land cultivating categories. Women's workforce<br />
participation (WWPR) is also likely to be related to caste and ethnicity - it is higher among STs and<br />
lower as one goes up the caste ladder. Thus, one can expect an inverse relation between women's<br />
workforce participation and the household's food security in a rural situation. It is in urban households<br />
that the relationship between food security and women's workforce participation may go both ways<br />
with increasing educational levels and participation of women in professional and managerial levels.<br />
For rural food security, we can continue to use women's workforce participation as being negatively<br />
related to the food security situation, with high participation being associated with a poor food security<br />
situation.<br />
In the case of Rajasthan, social factors play an important role in determining the level of the women’s<br />
workforce participation rate. Seasonal migration occurs across the districts because of socio-economic<br />
and environmental factors. But, there is no systematic pattern in the women’s workforce participation<br />
rate across the districts (Table 5.13 and Map 5.7).<br />
Churu district has the highest women’s workforce participation rate (77.41 per cent) whereas<br />
Ganganagar has the lowest rate. Other districts which have a high workforce participation rate include<br />
Table 5.13: Women’s Work Participation Rate in Rural Rajasthan, 2001 (%)<br />
High Moderate Low Very Low Extremely Low<br />
District Value District Value District Value District Value District Value<br />
Churu 77.41 Jalor 70.70 Sawai 65.09 Sikar 59.14 Sirohi 52.74<br />
Madhopur<br />
Chittaurgarh 75.21 Bundi 70.15 Bharatpur 64.63 Nagaur 58.99 Rajsamand 49.75<br />
Alwar 74.75 Dungarpur 70.11 Baran 64.13 Udaipur 56.38 Kota 48.63<br />
Banswara 72.90 Jhalawar 67.11 Dausa 63.82 Hanuman 55.83 Ganganagar 47.16<br />
garh<br />
Barmer 72.09 Tonk 66.89 Bikaner 63.67 Jaipur 55.39<br />
Source: Census of India, 2001.<br />
Bhilwara 65.52 Karauli 63.15 Pali 54.35<br />
Dhaulpur 63.05 Jaisalmer 54.02<br />
Ajmer 60.36<br />
Jodhpur 60.03<br />
Jhunjhunu 59.63<br />
66 FOOD SECURITY ATLAS OF RURAL RAJASTHAN
Map 5.7: Women Workforce Participation Rate<br />
Chittaurgarh, Alwar, Banswara and Barmer, with women’s workforce participation rate of more than<br />
72 per cent. Six districts have a moderate level of WWPR, 10 districts are with low WWPR, 7 districts<br />
have very low level of WWPR and another 4 districts have an extremely low level of WWPR.<br />
5.8 Food Access Index<br />
Table 5.14 presents district wise values and ranks of indicators used to compute Food Access Index.<br />
Table 5.15 presents the status of districts in terms of the Food Access Index. Only 6 districts have<br />
been identified in the 2 secure categories of food access. The remaining 26 districts are in the 3 different<br />
categories of food insecure. Sirohi, Dungarpur and Banswara have been identified as the extremely<br />
insecure districts in terms of Food Access Index. At the other extreme, Jhunjhunu is the most secure<br />
district with respect to food access index (Table 5.15 and Map 5.8).<br />
ACCESS TO FOOD<br />
67
Map 5.8: Food Access Map of Rural Rajasthan<br />
68 FOOD SECURITY ATLAS OF RURAL RAJASTHAN
Table 5.14: Indicators Used to Compute Food Access Index in Rajasthan<br />
District Agricultural Proportion Ratio of Monthly Per Rural Rural<br />
Labourers of SC & ST Working Capita Casual Female<br />
Age Group Consumption Wage Rate Literacy<br />
Population Expenditure<br />
Value Rank Value Rank Value Rank Value Rank Value Rank Value Rank<br />
Ajmer 14.08 21 19.22 3 1.11 11 461 12 54.13 26 32.63 19<br />
Alwar 9.57 12 27.34 16 1.02 22 523 2 59.12 22 38.54 13<br />
Banswara 10.75 13 81.09 32 1.09 16 372 31 48.43 32 24.43 32<br />
Baran 28.54 32 42.31 25 1.10 13 451 15 51.22 30 37.66 14<br />
Barmer 4.77 1 22.24 7 0.99 28 444 18 64.60 11 42.04 9<br />
Bharatpur 14.30 22 23.76 8 0.98 29 470 10 64.29 12 39.06 11<br />
Bhilwara 8.09 9 26.89 14 1.17 4 466 11 54.00 27 26.20 28<br />
Bikaner 7.22 6 24.70 9 0.99 27 428 24 62.83 15 28.44 26<br />
Bundi 15.01 24 42.10 24 1.14 7 484 3 64.08 14 32.46 20<br />
Chittaurgarh 11.40 15 39.01 23 1.25 1 484 3 51.08 31 29.98 23<br />
Churu 4.96 2 24.78 10 1.01 25 428 24 66.23 10 50.93 3<br />
Dausa 6.96 4 50.95 29 1.02 23 425 26 62.10 16 40.02 10<br />
Dhaulpur 7.94 7 26.57 12 0.93 32 477 5 68.87 6 38.89 12<br />
Dungarpur 16.56 25 72.41 31 1.09 14 372 31 52.06 29 28.86 25<br />
Ganganagar 27.89 31 38.56 22 1.23 2 460 14 64.17 13 47.19 5<br />
Hanumangarh 17.70 26 28.90 18 1.22 3 431 23 81.95 2 46.27 6<br />
Jaipur 7.08 5 28.59 17 1.06 19 474 8 67.82 9 43.86 7<br />
Jaisalmer 9.05 10 20.95 5 1.01 24 444 18 70.55 4 27.26 27<br />
Jalor 11.51 17 27.00 15 0.97 31 440 20 70.38 5 26.18 29<br />
Jhalawar 22.95 28 29.34 19 1.17 6 451 15 60.34 18 35.25 16<br />
Jhunjhunu 7.95 8 18.61 1 1.10 12 576 1 92.55 1 59.25 1<br />
Jodhpur 12.73 20 20.67 4 0.98 30 418 27 61.58 17 24.75 31<br />
Karauli 10.93 14 49.25 28 0.99 26 477 5 60.26 19 42.77 8<br />
Kota 25.80 30 37.91 21 1.17 5 451 15 71.58 3 49.85 4<br />
Nagaur 11.50 16 21.49 6 1.07 18 414 28 59.30 20 36.85 15<br />
Pali 23.01 29 25.09 11 1.03 21 396 29 59.03 23 31.65 21<br />
Rajsamand 14.72 23 26.79 13 1.12 8 435 21 59.17 21 33.02 18<br />
Sawai Madhopur 9.27 11 45.99 26 1.09 15 477 5 68.08 7 29.52 24<br />
Sikar 6.55 3 18.84 2 1.05 20 472 9 67.99 8 55.27 2<br />
Sirohi 20.60 27 47.39 27 1.07 17 396 29 52.23 28 31.29 22<br />
Tonk 11.92 18 35.11 20 1.12 10 461 12 56.85 24 25.66 30<br />
Udaipur 12.45 19 62.58 30 1.12 9 435 21 54.49 25 35.14 17<br />
Source: As stated in Table 3.4.<br />
ACCESS TO FOOD<br />
69
Table 5.15: Status of Districts on Food Access Index<br />
Secure Moderately Moderately Severely Extremely<br />
Secure Insecure Insecure Insecure<br />
District Value District Value District Value District Value District Value<br />
Jhunjhunu 0.6394 Sikar 0.5710 Alwar 0.5068 Jodhpur 0.4467 Sirohi 0.3823<br />
Source: Census of India, 2001.<br />
Churu 0.5393 Dhaulpur 0.5064 Jhalawar 0.4467 Dungarpur 0.3433<br />
Jaipur 0.5273 Bharatpur 0.4870 Tonk 0.4447 Banswara 0.3329<br />
Barmer 0.5232 Jaisalmer 0.4852 Pali 0.4174<br />
Hanuman- 0.5181 Nagaur 0.4823 Udaipur 0.4102<br />
garh<br />
Ajmer 0.4762 Baran 0.3944<br />
Bhilwara 0.4749<br />
Bikaner 0.4728<br />
Kota 0.4723<br />
Rajsamand 0.4637<br />
Karauli 0.4627<br />
Chittaurgarh 0.4609<br />
Sawai 0.4606<br />
Madhopur<br />
Jalor 0.4594<br />
Dausa 0.4583<br />
Ganganagar 0.4561<br />
Bundi 0.4560<br />
70 FOOD SECURITY ATLAS OF RURAL RAJASTHAN
6. Food Absorption<br />
6. Food Absorption<br />
It has been estimated that in developing countries, one out of five people do not have access to safe<br />
drinking water, and roughly half are without adequate sanitation (WHO, 2007). Primary health services<br />
in the country as a whole are inadequate, particularly in rural areas. There are persistent gaps in human<br />
resources and infrastructure, especially in the less developed rural areas. A significant proportion of<br />
hospitals do not have adequate personnel, diagnostic and therapeutic services and drugs. In a state<br />
like Rajasthan, with a high burden of communicable and non-communicable diseases because of<br />
persisting poverty, primary health infrastructure at the village level assumes huge significance. However,<br />
a good number of villages in the state are not adequately covered by a Primary Health Centre (PHC),<br />
the most critical health facility in rural areas. One PHC has been provided for as many as 25 villages,<br />
which hardly serves the purpose in the light of high pressure on limited resources. This compares poorly<br />
to a state like Kerala that has excellent health infrastructure in the rural areas (one PHC for every one<br />
and half villages). Lack of primary public health facilities forces the vulnerable populations to depend<br />
on private health services, often leading to indebtedness in rural areas (Table 6.1).<br />
Table 6.1: Factors Determining Status of Absorption<br />
India/States Households Having Number of Villages Households Having<br />
Safe Drinking Water per PHC Toilet Facility<br />
Value (%) Rank Value Rank Value (%) Rank<br />
India 78 – 27.6 – 21.9 –<br />
Andhra Pradesh 80.1 9 18.9 6 18.1 9<br />
Assam 58.8 15 43.1 15 59.6 2<br />
Bihar 86.6 4 27.4 10 13.9 13<br />
Chhattisgarh 70.5 11 39.4 13 5.2 17<br />
Gujarat 84.1 8 17.3 4 21.7 6<br />
Haryana 86 5 17.0 3 28.7 4<br />
Jharkhand 42.7 16 58.1 17 6.6 16<br />
Karnataka 84.6 7 17.5 5 17.4 10<br />
Kerala 23.4 17 1.5 1 81.3 1<br />
Madhya Pradesh 68.4 12 46.4 16 8.9 14<br />
Maharashtra 79.8 10 24.6 7 18.2 8<br />
Orissa 64.2 14 40.1 14 7.7 15<br />
Punjab 97.6 1 26.2 9 40.9 3<br />
Rajasthan 68.3 13 24.7 8 14.6 11<br />
Tamilnadu 85.5 6 11.8 2 14.4 12<br />
Uttar Pradesh 87.8 3 29.5 11 19.2 7<br />
West Bengal 88.5 2 34.8 12 26.9 5<br />
Source: Census of India, 2001 and Health Information of India, 2005.<br />
FOOD ABSORPTION<br />
71
Access to safe drinking water and sanitation is another important indicator of the health status of a<br />
population. Studies have shown that water and sanitation account for a substantial portion of the<br />
difference in infant and child mortality rates experienced by the rich and the poor (Leipziger et al 2003).<br />
Safe drinking water plays a key role in the body’s use of consumed food. Though India has taken huge<br />
strides in terms of provision of safe drinking water since independence, the fact remains that more people<br />
in India lack this basic minimum necessity now than 50 years ago. Besides, more people are vulnerable<br />
to water-borne diseases (Gujja & Shaik, 2005). Empirical studies have shown that water quality is a big<br />
problem in rural areas (Krishnan et al, 2003).The availability and quality of potable water is a big factor<br />
that affects food insecurity. Almost two million children die each year because of lack of clean water<br />
and sanitation (UNICEF, 2007c). As there is no direct method of calculation of access to safe drinking<br />
water, we have taken access to tubewell, tap and handpump as safe sources of drinking water. In<br />
Rajasthan, 68.3 per cent of the households are having access to safe drinking water. It ranks 13th among<br />
the 17 major states of India on this count and is nearly 10 percentage points lower than the national<br />
average.<br />
6.1 Access to Primary Health Services<br />
Public health infrastructure helps the local inhabitants deal with the harmful effects of exposure to<br />
diseases. In rural areas, all the health services are pivoted around the PHCs, hence we have taken access<br />
to PHCs as a major indicator determining absorption of food.<br />
In Rajasthan, very limited efforts have been made to increase access to health care. Till date, only onefifth<br />
of the total villages in the state have access to health facilities within a distance of 5 km. In 4 districts,<br />
Baran, Barmer, Bikaner and Jaisalmer, access to health facilities was extremely low, i.e. only about<br />
one-tenth of the total villages benefited from the health facilities. Except Baran, these districts are part<br />
of the western desert region. There were 8 districts where accessibility to health facilities varied from<br />
13 to 16 per cent, which is also considered as very low. In 12 districts, it was low with 19 to 24 per<br />
cent. It may be inferred that a majority of the districts in the state have poor access to health facilities.<br />
In 6 districts, access was moderate. Only 3 districts had relatively better access to health facilities. Of<br />
these 3 districts, 2 were tribal districts. In these tribal districts, less than one-third of the villages had<br />
access to health facilities. As is the case with education and road connectivity, Jhunjhunu district leads<br />
on account of access to health facilities (Table 6.2). In some districts of the western arid region, the<br />
availability of health facilities is pitiable and needs urgent attention by the programme implementing<br />
agencies (see Map 6.1).<br />
Health facilities are available in a limited proportion of the villages i.e. about one-fifth of the total villages.<br />
There are some districts, where the human settlements are scattered and the households in these areas<br />
have to cover long distances to access the required facilities.<br />
72 FOOD SECURITY ATLAS OF RURAL RAJASTHAN
Map 6.1: Access to Health Services in Rural Areas of Rajasthan<br />
Table 6.2: Access to PHCs in Rajasthan (in per cent of villages), 2001<br />
High Moderate Low Very Low Extremely Low<br />
District PHC District PHC District PHC District PHC District PHC<br />
Banswara 35.46 Dhaulpur 28.46 Bharatpur 23.26 Ganganagar 16.69 Baran 11.65<br />
Dungarpur 34.08 Udaipur 26.48 Sikar 22.88 Bundi 16.13 Barmer 10.59<br />
Jhunjhunu 32.47 Sirohi 25.90 Ajmer 21.36 Sawai 15.98 Bikaner 8.43<br />
Madhopur<br />
* PHCs within 5 kms has been taken<br />
Source: As stated in Table 3.4, Variable c2.<br />
Chittaurgarh 24.79 Bhilwara 21.32 Jodhpur 15.29 Jaisalmer 6.12<br />
Jaipur 24.48 Rajsamand 21.27 Churu 14.89<br />
Jhalawar 23.80 Dausa 21.02 Hanumangarh 14.83<br />
Alwar 19.96 Karauli 13.71<br />
Pali 19.87<br />
Nagaur 19.73<br />
Jalor 19.19<br />
Tonk 18.94<br />
Kota 18.77<br />
FOOD ABSORPTION<br />
73
6.2 Access to Safe Drinking Water<br />
Table 6.3 presents percentage of households in a district with access to safe drinking water in rural<br />
Rajasthan. Seventeen districts fall under the three categories of low access to safe drinking water. With<br />
certain exceptions, most of these districts fall in the western arid region. This region is characterized as<br />
water scarce region of the country. Bharatpur district has extremely low level of households with access<br />
to safe drinking water. Kota, Chittaurgarh, Bundi and Baran districts have more than 80 per cent of<br />
households with access to safe drinking water.<br />
Further, the analysis shows that access to safe drinking water is higher only in regions covered under<br />
canal command areas or that have good rainfall conditions. Besides, in certain areas, the provision of<br />
safe drinking water has been made through the transfer of water from irrigation projects, e.g. Jawai<br />
and IGNP in Jodhpur district and Bisalpur in Tonk and Jaipur districts. In water scarce regions as in the<br />
western arid region districts and flood-prone districts, the proportion of access to safe drinking water<br />
is considerably lower. (Table 6.3 and Map 6.2). In these districts, members of households, particularly<br />
women have to cover long distances to fetch drinking water. In this regard, efforts made by the government<br />
Map 6.2: Access to Safe Drinking Water in Rural Areas<br />
74 FOOD SECURITY ATLAS OF RURAL RAJASTHAN
Table 6.3: Access to Safe Drinking Water in Rural Rajasthan (in per cent of Households), 2001<br />
High Moderate Low Very Low Extremely Low<br />
District Value District Value District Value District Value District Value<br />
Kota 90.47 Sirohi 74.66 Ajmer 64.15 Sawai 51.03 Bharatpur 24.77<br />
Madhopur<br />
Chittaurgarh 85.09 Jhunjhunu 71.65 Jhalawar 62.22 Jalor 48.01<br />
Bundi 84.42 Dungarpur 71.60 Jaipur 60.32 Dhaulpur 47.77<br />
Baran 82.58 Rajsamand 68.57 Alwar 58.74 Nagaur 47.62<br />
Ganganagar 68.23 Tonk 54.52 Jaisalmer 45.49<br />
Bhilwara 67.93 Pali 53.49 Bikaner 44.97<br />
Banswara 67.29 Dausa 52.59 Karauli 40.84<br />
Jodhpur 66.20 Churu 51.50 Barmer 39.28<br />
Hanumangarh 66.19<br />
Sikar 65.31<br />
Source: As stated in Table 3.4, Variable c1<br />
under various schemes such as the Rajiv Gandhi Drinking Water Mission have yielded results in large<br />
parts of the state. But, there is a need to make sustained efforts in certain areas, particularly the water<br />
scarce districts in the western arid hill regions.<br />
6.3 Food Absorption Index<br />
District wise value and ranks of indicators which have been used to compute Absorption Index and<br />
resultant absorption index value and ranks have been presented in Table 6.4.<br />
The Food Absorption Index shows that 15 districts are in the two relatively food secure categories of<br />
secure and moderately secure. Remaining 17 districts are in the three insecure categories of food<br />
absorption index i.e., extremely insecure, severely insecure and moderately insecure (Table 6.4 and Map<br />
6.3).<br />
Geographically, two regions are appearing as critical in terms of food absorption:<br />
a) Western arid regions of Barmer, Jaisalmer, Bikaner and their adjoining districts; and<br />
b) Northeastern region comprising of Bharatpur, Karauli and their adjoining districts.<br />
Southeastern region is relatively secure in terms of food absorption.<br />
FOOD ABSORPTION<br />
75
Map 6.3: Food Absorption Map of Rural Rajasthan<br />
76 FOOD SECURITY ATLAS OF RURAL RAJASTHAN
Table 6.4: Indicators Used to Compute Absorption Index<br />
District Access to Access to Absorption<br />
Safe Drinking Water PHC Index<br />
Value Rank Value Rank Value Rank<br />
Ajmer 64.15 16 21.36 12 0.443 15<br />
Alwar 58.74 19 19.96 16 0.403 20<br />
Banswara 67.29 11 35.46 1 0.564 5<br />
Baran 82.58 4 11.65 29 0.474 9<br />
Barmer 39.28 31 10.59 30 0.226 32<br />
Bharatpur 24.77 32 23.26 10 0.238 30<br />
Bhilwara 67.93 10 21.32 13 0.464 11<br />
Bikaner 44.97 29 8.43 31 0.242 29<br />
Bundi 84.42 3 16.13 23 0.517 7<br />
Chittaurgarh 85.09 2 24.79 7 0.585 1<br />
Churu 51.50 23 14.89 26 0.325 27<br />
Dausa 52.59 22 21.02 15 0.376 21<br />
Dhaulpur 47.77 26 28.46 4 0.404 19<br />
Dungarpur 71.60 7 34.08 2 0.578 2<br />
Ganganagar 68.23 9 16.69 22 0.431 16<br />
Hanumangarh 66.19 13 14.83 27 0.407 18<br />
Jaipur 60.32 18 24.48 8 0.445 14<br />
Jaisalmer 45.49 28 6.12 32 0.227 31<br />
Jalor 48.01 25 19.19 19 0.338 25<br />
Jhalawar 62.22 17 23.80 9 0.450 13<br />
Jhunjhunu 71.65 6 32.47 3 0.567 4<br />
Jodhpur 66.20 12 15.29 25 0.410 17<br />
Karauli 40.84 30 13.71 28 0.257 28<br />
Kota 90.47 1 18.77 21 0.570 3<br />
Nagaur 47.62 27 19.73 18 0.339 24<br />
Pali 53.49 21 19.87 17 0.373 22<br />
Rajsamand 68.57 8 21.27 14 0.467 10<br />
Sawai Madhopur 51.03 24 15.98 24 0.331 26<br />
Sikar 65.31 14 22.88 11 0.461 12<br />
Sirohi 74.66 5 25.90 6 0.535 6<br />
Tonk 54.52 20 18.94 20 0.372 23<br />
Udaipur 64.74 15 26.48 5 0.484 8<br />
Source: As stated in Table 3.4.<br />
FOOD ABSORPTION<br />
77
Table 6.4: Status of Districts in terms of Food Absorption Index<br />
Secure Moderately Moderately Severely Extremely<br />
Secure Insecure Insecure Insecure<br />
District Value District Value District Value District Value District Value<br />
Chittaurgarh 0.585 Udaipur 0.484 Ganganagar 0.431 Nagaur 0.339 Karauli 0.257<br />
Dungarpur 0.578 Baran 0.474 Jodhpur 0.410 Jalor 0.338 Bikaner 0.242<br />
Kota 0.570 Rajsamand 0.467 Hanuman 0.407 Sawai 0.331 Bharatpur 0.238<br />
garh<br />
Madhopur<br />
Jhunjhunu 0.567 Bhilwara 0.464 Dhaulpur 0.404 Churu 0.325 Jaisalmer 0.227<br />
Banswara 0.564 Sikar 0.461 Alwar 0.403 Barmer 0.226<br />
Sirohi 0.535 Jhalawar 0.450 Dausa 0.376<br />
Bundi 0.517 Jaipur 0.445 Pali 0.373<br />
Ajmer 0.443 Tonk 0.372<br />
Food absorption index, however, does not correlate well with the food outcome index in Rajasthan. It<br />
can be seen that district with high food absorption index value have low level of food security outcome<br />
value which suggests that factors other than access to health infrastructure and safe drinking water is<br />
having their influence on the under five mortality and underweight children.<br />
*****<br />
78 FOOD SECURITY ATLAS OF RURAL RAJASTHAN
7. Addressing Food Insecurity in Rajasthan<br />
7. Addressing Food Insecurity in Rajasthan<br />
Chapter 3 developed an index to show the ranks of districts by outcomes of food insecurity. The next<br />
logical step was to look at factors that contribute to making these districts prone to food insecurity.<br />
These factors were analyzed through the framework of Availability, Access and Absorption in chapters<br />
4 to 6. In this chapter, all these factors are combined to form a food security index (FSI) to explain food<br />
security situation across dstricts of Rajasthan. Any strategy to improve the food security status must<br />
consider the regional disparities in the incidence of food and nutrition insecurity and develop location<br />
specific policies for clusters of hunger hotspots.<br />
7.1 Food Security Index<br />
The overall food security index shows a higher number of districts in the three categories of insecurity<br />
than in the two categories of security. Barmer, Sirohi, Dungarpur, Banswara and Udaipur have been<br />
identified as extremely insecure districts in Rajasthan. Similarly, most of the central and southwestern<br />
districts are in the category of severely insecure (Table 7.1 and Map 7.1). Jhunjhunu and Kota are the<br />
two districts in Rajasthan which have been identified in the category of the secure. It is striking to note<br />
that 20 of the 32 districts are in the worst two categories. Table 7.2 gives detail on index values by<br />
districts.<br />
A large number of programmes dealing with all three components of food security viz. availability, access<br />
and absorption, are being implemented in the state of Rajasthan. The analysis in this atlas can help to<br />
Table 7.1: Status of Districts in terms of FSI<br />
Secure Moderately Moderately Severely Extremely<br />
Secure Insecure Insecure Insecure<br />
Jhunjhunu Ganganagar Bharatpur Ajmer Barmer<br />
Kota Hanumangarh Dhaulpur Bhilwara Sirohi<br />
Jaipur Bundi Nagaur Dungarpur<br />
Sikar Churu Baran Banswara<br />
Alwar Dausa Chittaurgarh Udaipur<br />
Bikaner<br />
Jalor<br />
Sawai Madhopur<br />
Jhalawar<br />
Tonk<br />
Jodhpur<br />
Rajsamand<br />
Jaisalmer<br />
Karauli<br />
Pali<br />
ADDRESSING FOOD INSECURITY IN RAJASTHAN<br />
79
Table 7.2: Ranks of Districts on Composite Food Security Index and Components<br />
Districts Availability Index Access Index Absorption Index FSI FSOI<br />
Value Rank Value Rank Value Rank Value Rank Value Rank<br />
Ajmer 0.317 26 0.476 12 0.443 15 0.4458 13 0.469 23<br />
Alwar 0.640 3 0.507 7 0.403 20 0.5033 7 0.605 9<br />
Banswara 0.317 25 0.333 32 0.564 5 0.3689 31 0.493 19<br />
Baran 0.587 5 0.394 29 0.474 9 0.4404 16 0.453 25<br />
Barmer 0.198 32 0.523 5 0.226 32 0.4025 28 0.446 26<br />
Bharatpur 0.599 4 0.487 9 0.238 30 0.4794 8 0.656 6<br />
Bhilwara 0.265 28 0.475 13 0.464 11 0.4453 14 0.489 20<br />
Bikaner 0.358 18 0.473 14 0.242 29 0.4378 18 0.620 7<br />
Bundi 0.517 8 0.456 23 0.517 7 0.4694 10 0.497 18<br />
Chittaurgarh 0.336 22 0.461 18 0.585 1 0.4393 17 0.383 31<br />
Churu 0.297 27 0.539 3 0.325 27 0.4567 11 0.588 11<br />
Dausa 0.505 10 0.458 21 0.376 21 0.4562 12 0.579 12<br />
Dhaulpur 0.527 6 0.506 8 0.404 19 0.4748 9 0.479 22<br />
Dungarpur 0.319 24 0.343 31 0.578 2 0.3829 30 0.374 32<br />
Ganganagar 0.686 1 0.456 22 0.431 16 0.5157 3 0.726 3<br />
Hanumangarh 0.52 7 0.518 6 0.407 18 0.5095 4 0.745 2<br />
Jaipur 0.454 12 0.527 4 0.445 14 0.5073 5 0.615 8<br />
Jaisalmer 0.259 29 0.485 10 0.227 31 0.4242 25 0.507 17<br />
Jalor 0.41 15 0.459 20 0.338 25 0.4377 19 0.538 15<br />
Jhalawar 0.385 17 0.447 25 0.45 13 0.4357 21 0.588 10<br />
Jhunjhunu 0.514 9 0.639 1 0.567 4 0.5750 1 0.692 4<br />
Jodhpur 0.326 23 0.447 24 0.41 17 0.4291 23 0.667 5<br />
Karauli 0.496 11 0.463 17 0.257 28 0.4191 26 0.535 16<br />
Kota 0.669 2 0.472 15 0.57 3 0.5374 2 0.567 13<br />
Nagaur 0.345 20 0.482 11 0.339 24 0.4435 15 0.541 14<br />
Pali 0.346 19 0.417 27 0.373 22 0.4064 27 0.480 21<br />
Rajsamand 0.233 31 0.464 16 0.467 10 0.4257 24 0.411 30<br />
Sawai Madhopur 0.437 13 0.461 19 0.331 26 0.4364 20 0.432 28<br />
Sikar 0.427 14 0.571 2 0.461 12 0.5063 6 0.775 1<br />
Sirohi 0.401 16 0.382 30 0.535 6 0.3878 29 0.430 29<br />
Tonk 0.337 21 0.445 26 0.372 23 0.4350 22 0.441 27<br />
Udaipur 0.236 30 0.41 28 0.484 8 0.3604 32 0.469 24<br />
ADDRESSING FOOD INSECURITY IN RAJASTHAN<br />
81
prioritize the geographical targeting of these programmes and suggest interventions that could improve<br />
food security by linking short-term access measures with long-term development measures.<br />
7.2 Identifying Priority Districts<br />
The food security outcome index and food security index discussed earlier provides the option of<br />
prioritizing the developmental efforts in the most food insecure districts. The districts in the two lowest<br />
categories, that is, the extremely and severely food insecure districts, in both the indices should be<br />
prioritized for developmental intervention towards enhancing food security. There are three kinds of<br />
such districts - districts common in both FSI and FSOI, districts only by FSI and districts only by FSO.<br />
These districts are presented with their ranks in FSI and FSO, criteria of selection and region in which<br />
they are located in Table 7.3.<br />
Twenty two districts out of the total 32 districts of Rajasthan have been identified as districts for food<br />
Table 7.3: Priority Food Security Intervention Districts of Rajasthan by Criteria<br />
Districts FSI Rank FSOI Rank Criteria Region<br />
Value<br />
Value<br />
Ajmer 0.446 13 0.469 23 Both (FSI+FSOI) North East<br />
Banswara 0.369 31 0.493 19 Both (FSI+FSOI) Southern<br />
Baran 0.440 16 0.453 25 Both (FSI+FSOI) South Eastern<br />
Barmer 0.402 28 0.446 26 Both (FSI+FSOI) Western<br />
Bhilwara 0.445 14 0.489 20 Both (FSI+FSOI) North East<br />
Chittaurgarh 0.439 17 0.383 31 Both (FSI+FSOI) South Eastern<br />
Dungarpur 0.383 30 0.374 32 Both (FSI+FSOI) Southern<br />
Jaisalmer 0.424 25 0.507 17 Both (FSI+FSOI) Western<br />
Karauli 0.419 26 0.535 16 Both (FSI+FSOI) North East<br />
Pali 0.406 27 0.480 21 Both (FSI+FSOI) Western<br />
Rajsamand 0.426 24 0.411 30 Both (FSI+FSOI) Southern<br />
Sawai Madhopur 0.436 20 0.432 28 Both (FSI+FSOI) North Eastern<br />
Sirohi 0.388 29 0.430 29 Both (FSI+FSOI) Western<br />
Tonk 0.435 22 0.441 27 Both (FSI+FSOI) North Eastern<br />
Udaipur 0.360 32 0.469 23 Both (FSI+FSOI) Southern<br />
Bikaner 0.438 18 0.620 7 Only FSI Western<br />
Jalor 0.438 19 0.538 15 Only FSI Western<br />
Jhalawar 0.436 21 0.588 10 Only FSI South Eastern<br />
Jodhpur 0.429 23 0.667 5 Only FSI Western<br />
Nagaur 0.443 15 0.541 14 Only FSI Western<br />
Bundi 0.469 10 0.497 18 Only FSOI South Eastern<br />
Dhaulpur 0.475 9 0.479 22 Only FSOI North Eastern<br />
82 FOOD SECURITY ATLAS OF RURAL RAJASTHAN
Map 7.2: Priority Districts for Food Security Interventions in Rural Rajasthan<br />
security priority interventions. Out of the 22 priority intervention districts, 15 districts are common in<br />
both FSI and FSOI; five districts have been selected by only FSI and two districts have been selected<br />
by only FSOI. Locationwise, six districts are in the northeastern region, four in southeastern region,<br />
another four in southern region, and eight districts in the western region. These districts not only have<br />
high under five mortality and under nutrition rate but also rank poorly in terms of availability, access<br />
and absorption indicators. They need urgent attention of government and policy makers.<br />
7.2.1 Status of Availability Indicators<br />
Among the food insecure districts, the availability indicators show that Baran district is leading in<br />
agriculture production but it is still in the category of insecure districts. The ground realities reflect that<br />
the productive resources are owned by a limited number of farm families. The proportion of non-forest<br />
area was low in 10 districts, at varying levels. The availability of irrigation facilities was also limited in<br />
a majority of the districts, and a similar number of districts were facing problems relating to road<br />
connectivity.<br />
ADDRESSING FOOD INSECURITY IN RAJASTHAN<br />
83
It emerges from the analysis that to improve the availability of food, it is necessary to improve the<br />
irrigation facilities in the concerned districts. Production of food is directly related to the status of<br />
irrigation facilities. In the districts, particularly in the arid region, adequate irrigation is not possible due<br />
to water scarcity. But in certain districts where there is good rainfall, there are possibilities of expansion<br />
of irrigation facilities. In these areas, either there is a need to construct new irrigation projects and/or<br />
restore the old one which will help in improving access to irrigation facilities.<br />
Improvement in road connectivity is equally important in food insecure districts. The indicators presented<br />
in Table 4.6 show that the limited road connectivity in rural Rajasthan is also responsible for making<br />
districts food insecure. Therefore, expansion of road connectivity is essential for increasing food security,<br />
as it will help in improving access to food and other economic facilities. There were six food insecure<br />
districts having high access to road connectivity and only two categories with medium access.<br />
Interestingly, certain efforts made by the government in the tribal and backward districts can be noticed.<br />
Broadly, there are direct linkages between agriculture productivity and livestock productivity. But in<br />
the case of Rajasthan, it is found that in certain areas animal husbandry is more important than<br />
agriculture from the food security point of view. Experience of Bhilwara Dairy that was initiated on the<br />
Anand pattern has yielded encouraging results in the district and adjacent areas. In these areas, access<br />
to marketing of livestock products has not only secured the food requirement but also played an<br />
important role in increasing the standard of living of the households associated with livestock enterprise.<br />
Similarly, provision of marketing and livestock development related intervention will help in improving<br />
the food security.<br />
Beside livestock products, animal exchange marketing (AEM) is also a major issue in the state. There<br />
are about 260 formalized animal fairs held in the state. Some of them are state level fairs managed by<br />
the Department of Animal Husbandry of the state government. Others are categorized as panchayat<br />
to district level fairs. Exchange of animals takes place in these fairs (Acharya and Ahuja, 1998). Both<br />
buyers and sellers are benefited by purchase and sale of animals of their choice at competitive prices.<br />
However, there exist various difficulties in exchage marketing of animals that need attention by the fair<br />
organizing agencies. Some of the traders from the neighbouring states such as Gujarat, Uttar Pradesh,<br />
Punjab, Haryana and Madhya Pradesh also purchase animals at the local level. Often, such marketing<br />
practices are not in favour of the animal owner due to absence of competitive prices, and animal owners<br />
get low prices compared to their expectations.<br />
7.2.2 Status of Access Indicators<br />
The analysis shows that in the case of deployment of the labour force in non-agricultural activities,<br />
majority of the food insecure districts are lagging behind. So too are the tribal population-dominated<br />
districts, except Jaisalmer and Barmer. Almost a similar picture emerges in the case of proportion of<br />
SCs/ STs and ratio of working age population. The low position of average per-capita consumption<br />
expenditure is noticeable in all the food insecure districts. The rural wage rate was extremely low in<br />
84 FOOD SECURITY ATLAS OF RURAL RAJASTHAN
nine districts. In 7 other districts, it was low and very low. The case with status of female literacy rate<br />
was similar, with marginal differences. Certain interventions can be made in improving the access to<br />
food in rural Rajasthan. These include:<br />
1. Encourage the non-farm sector which may help in reducing the dependency on farm sector.<br />
2. Initiate public policy and intervention which may help in enhancing employment and income<br />
opportunities, which will further help in increasing average per-capita expenditure.<br />
3. Make all possible efforts to improve female literacy rate in those districts where it is low. The<br />
government has initiated certain steps in the state to improve the literacy among females; these<br />
need to be strengthened.<br />
7.2.3 Status of Absorption Indicators<br />
The absorption indicators show that in seven food insecure districts, the availability of safe drinking<br />
water was low or very low. There is water scarcity as well as poor quality of water in these districts.<br />
Thus, lack of safe drinking water is one of the major challenges of food security in these districts.<br />
The availability of health facilities is also poor in 11 districts.<br />
Fig 7.1. Allocation Proposed under NFSM<br />
Source: Economic Survey, 2007-08<br />
ADDRESSING FOOD INSECURITY IN RAJASTHAN<br />
85
7.3 Strategies for Promoting Food Security<br />
The districts most beset by hunger and food insecurity have been identified in the earlier section. These<br />
are also the districts that call for priority intervention. The analysis of the earlier chapters suggests<br />
measures and strategies that are needed for enhancing food security. Broadly, measures to improve<br />
availability must include improving irrigation and agricultural productivity. Farm incomes can be improved<br />
through better rural connectivity. Access should be improved by policies for increasing rural wages<br />
and thereby spending on food, land re-distribution, and enhancing the status of women. There can be<br />
no two opinions on the need to expand the reach of public interventions.<br />
The central and state governments have launched a number of schemes and programmes for enhancing<br />
food security in the state. Some of them are recent and it is too early to see their impact, while some<br />
have been under implementation for some time. This section discusses the food security interventions<br />
in the state.<br />
7.3.1 Enhancing Availability<br />
More than a decade of low investment in agriculture, including agricultural research and infrastructure,<br />
has resulted in a relative stagnation in food output. With the present problems of spiraling food prices,<br />
there is a renewed emphasis on increasing food production.<br />
7.3.1.1 Increasing Food Production: The National Food Security Mission<br />
The dismal rate of growth in the agricultural sector has been a cause for concern – the sector grew at<br />
a meagre rate of 1.8 per cent per annum during the 90s. This has been coupled with rising international<br />
prices as well as occasional wheat imports, bringing into question the food security of the country.<br />
With a view to increasing the rate of agricultural growth to 4 per cent, the government has launched<br />
the National Food Security Mission (NFSM), entirely funded by the central government, with a total<br />
estimated outlay of over Rs. 50,000 million. The programme specifically aims at increasing the<br />
production and productivity of three crops: rice, wheat and pulses. Ongoing related schemes like the<br />
Integrated Cereal Development Programme (ICDP Rice/Wheat) and the Integrated Scheme on Pulses,<br />
Oilseeds and Maize (ISOPOM Pulse) would cease to operate in the identified districts once the relevant<br />
component of the NFSM comes into execution in the district.<br />
The objective of the mission is to increase production of rice by 10 million tons, wheat by 8 million tons<br />
and pulses by 2 million tons, by the end of the 11th Plan in the country. The targets are to be achieved<br />
by restoring soil fertility and hence productivity, which would be complemented by increasing<br />
employment opportunities.<br />
The mission would operate at multiple levels from the national level, to state and district levels. At the<br />
86 FOOD SECURITY ATLAS OF RURAL RAJASTHAN
grass root level, the Panchayati Raj Institutions (PRIs) would play an active role in the selection of<br />
beneficiaries and identification of priority areas and local initiatives.<br />
The mission would be implemented in 133 districts for the rice component, 138 districts for wheat and<br />
168 districts for the pulse component – all in identified districts of different states across the country.<br />
In terms of target beneficiaries, 16 per cent of the total allocation would be earmarked for Scheduled<br />
Castes under the Special Component Plan (SCP) and 8 per cent would be earmarked for the Scheduled<br />
Tribes under the Tribal Sub-Plan (TSP). At least 33 per cent of the fund would be utilized for small,<br />
marginal and women farmers. Further, the allocation to the SC/ST farmers would be made in proportion<br />
to their population in the district.<br />
The modality for implementation of the mission would be in the form of demonstration of an improved<br />
package at farmers’ fields, assistance for production of hybrid rice, nutrient management for all the<br />
three crops, mechanization for sowing and weeding, and assistance for purchase of pump sets and<br />
sprinkler sets. Several capacity-building initiatives would also be undertaken which would be in the<br />
form of farmers’ training in Farmers’ Field Schools (FFS) and exposure visits to international<br />
organizations. For efficient information dissemination, help from print and e-media and other methods<br />
would be taken up as required. All these would be followed by rewarding the best performing districts<br />
on a set of indicators.<br />
In Rajasthan, the districts identified to be developed under the NFSM under the rice and pulses<br />
components are given in table 7.4.<br />
The NFSM concentrates on irrigated foodgrains, wheat and rice, and pulses. Other than pulses, nonirrigated<br />
crops have been ignored. The NFSM is aimed at revitalizing fertility of degraded lands. But<br />
rainfed crops, such as various millets that are grown on hills and other drylands, do not come under its<br />
purview. In the context of the plateauing (and even decline) of yields in irrigated crops, it becomes even<br />
Table 7.4: Districts under NFSM in Rajasthan<br />
Rice (15)<br />
Ajmer Churu Jaipur Nagaur<br />
Barmer Dausa Jhunjhunu Sikar<br />
Bikaner Ganganagar Jodhpur Tank<br />
Chittaurgarh Hanumangarh Kota<br />
Pulses (10)<br />
Ajmer Bikaner Jhalawar Pali<br />
Banswara Jaipur Kota Sawai Madhopur<br />
Bhilwara Jalore Nagaur Sikar<br />
Sirohi Tonk Udaipur<br />
Source: Govt. of India (2007b).<br />
ADDRESSING FOOD INSECURITY IN RAJASTHAN<br />
87
Box 7.1: National Policy for Farmers, 2007<br />
The National Policy for Farmers is intended to help in rejuvenating the farm sector and bringing lasting improvement in the<br />
economic condition of farmers. The Government constituted the National Commission on Farmers in 2004 under the<br />
chairmanship of Dr. M.S. Swaminathan. Based on the recommendations made by the Commission in its Revised Draft<br />
National Policy for Farmers and the comments/suggestions received from various Central Ministries and Departments and<br />
State Governments, the “National Policy for Farmers, 2007” has been formulated and approved by the Government of India.<br />
The policy, among other things, aims to improve the economic viability of farming by substantially improving the net income<br />
of farmers in addition to improving productivity, profitability, land, water and support services, providing appropriate price<br />
policy as well as risk management measures.<br />
The broad areas of the coverage of the recommendations include:<br />
a. Human Dimension: In addition to production and productivity, the economic well being of the farmers to be given prime<br />
importance.<br />
b. Asset Reforms: To ensure that every man and woman, particularly the poor, in villages either possesses or has access<br />
to a productive asset.<br />
c. Water Use Efficiency: The concept of maximizing yield and income per unit of water to be adopted in all crop production<br />
programmes, with stress on awareness and efficiency of water use.<br />
d. Use of Technology: New technologies, which can help enhance productivity per unit of land and water, are needed:<br />
Biotechnology, information and communication technology (ICT), renewable energy technology, space applications<br />
and nano-technology to provide opportunities for launching an “Evergreen Revolution” capable of improving productivity<br />
in perpetuity without harming the ecology.<br />
e. Inputs and Services: Good quality seeds, disease-free planting material, including in-vitro cultured propagules and<br />
soil health enhancement hold the key to raising small farm productivity. Every farm family to be issued with a Soil Health<br />
Passbook. Food security basket to be enlarged to include nutritious millets mostly grown in dry land farming areas.<br />
f. Credit & Insurance: The financial services to be galvanized for timely, adequate and easy reach to the farmers at<br />
reasonable interest rates.<br />
g. Single National Market: To develop a Single National Market by relaxing internal restrictions and controls.<br />
An Inter-Ministerial Committee has been set up to operationalize the implementation of the policy.<br />
more important to pay attention to these rainfed crops and to increase productivity in currently rainfed<br />
areas. These are also areas of higher food insecurity. An increase in agricultural productivity in rainfed<br />
areas will substantially reduce the incidence of hunger in these areas.<br />
7.3.1.2 Improving Connectivity<br />
The rate of growth of rural incomes and reduction in rural poverty are strongly influenced by the provision<br />
of rural and district road connectivity. There is a close link between rural connectivity and growth, be<br />
it in the area of trade, employment, education or healthcare. States with poor connectivity are also<br />
88 FOOD SECURITY ATLAS OF RURAL RAJASTHAN
states that report poor socio-economic indices. Improved connectivity between the growth production<br />
centres and the collection centres is vital for livelihood enhancements and that is possible only through<br />
the development of roads in remote areas.<br />
While over the last five decades, the length of rural roads has been increasing, there are still more<br />
than 250,000 villages (40 per cent) which remain unconnected. Other forms of rural infrastructure<br />
are also important as they help in widening the opportunities and choice of alternatives. Research<br />
into rural road investments suggests that the construction of a new road in a village raised the per<br />
capita income of households by 30 per cent over half a decade, after controlling for factors like<br />
household size and education (Deolalikar, 2001).<br />
Pradhan Mantri Gram Sadak Yojana (PMGSY):<br />
In an impact evaluation the following effects of the PMGSY have been observed (Ministry of Rural<br />
Development, Government of India):<br />
1. Use of chemical fertilizers and HYV seeds has increased considerably on account of their<br />
decreased transportation cost that formed a fair portion of their total cost.<br />
2. An increase in the ownership and use of farm implements by the people has been observed.<br />
3. The farmers get a higher price for their products due to better access to the wholesale market.<br />
4. There has been substantial increase in dairy and poultry production in the villages which are<br />
located in close proximity to the newly constructed roads.<br />
5. There has been substantial increase in employment opportunities both in agricultural and nonagricultural<br />
sectors in villages located close to the roads constructed under PMGSY.<br />
6. Substantial achievements have also been made on the health front. The frequency of health<br />
workers visiting the village has increased, as have institutional deliveries, and villagers have<br />
better access to health facilities.<br />
7. The enrolment rate has increased due to better accessibility to educational institutions.<br />
8. An increase in land prices has been observed and many petty shops have come up on the<br />
road side.<br />
Bharat Nirman: Rural Roads<br />
Bharat Nirman is a plan for action in rural infrastructure that started in 2005 and will end in 2009. Under the<br />
scheme, action is proposed in the areas of irrigation, roads, rural housing, rural water supply, rural electrification<br />
and rural telecommunication connectivity, in partnership with the state governments and the PRIs.<br />
ADDRESSING FOOD INSECURITY IN RAJASTHAN<br />
89
Figure 7.2: Bharat Nirman Physical Target in Rajasthan (km)<br />
As part of the programme, the government intends that by the end of financial year 2008 – 2009,<br />
every village of over 1,000 population, or over 500 in hilly and tribal areas, has an all-weather road.<br />
To achieve the targets of Bharat Nirman, 1,46,185 km of road length is proposed to be constructed<br />
by 2009. This will benefit 66,802 unconnected eligible habitations in the country. To ensure farm to<br />
market connectivity, it is also proposed to upgrade 1,94,132 km. of the existing associated roads.<br />
Position of Rajasthan<br />
The government has estimated certain targets to improve the road connectivity in terms of new<br />
construction and restoration of old construction. Importantly, the major focus of connectivity is on<br />
restoration of old construction compared to new construction, which not only increases the coverage<br />
of the programme but also enhances its efficiency.<br />
7.3.1.3 Forests and Tribals<br />
Out of 12 priority districts, 6 have more than 20 per cent of forest cover. These districts are known as<br />
tribal districts. As is well recognized, tribal households own very limited resources and have to be<br />
dependent on commonly owned resources as there are continuous restrictions on their usage rights.<br />
This has resulted in the emergence of challenges to rural livelihoods in the case of tribal households.<br />
With a view to secure recognition of their usage rights on forest land for livelihood, the tribal community<br />
has come forward in a democratic manner. The Forest Rights Act should help the tribal communities<br />
develop their livelihoods (Box 7.2).<br />
90 FOOD SECURITY ATLAS OF RURAL RAJASTHAN
Box 7.2: The Forest Rights Act<br />
The Scheduled Tribes and Traditional Forest Dwellers (Recognition of Forest Rights) Act, 2006 was promulgated towards<br />
the end of 2006 with a view to correcting the injustices done to the forest dwelling scheduled tribes. The Act recognizes<br />
and vests forest rights and occupation on forest land in forest-dwellers who have been residing in such forests for generations<br />
but whose rights could not be recorded. It also provides for recognition of forest rights of other traditional forest-dwellers<br />
provided they have primarily resided in and have depended on the forest or forest land for bona fide livelihood needs for at<br />
least three generations (25 years each) prior to 13th December 2005.<br />
The Act has a number of significant provisions in the interest of the tribals and forest-dwellers. For the purpose of recognition<br />
of forest rights the Act provides for ceiling on occupation of forest land to the area under actual occupation not exceeding<br />
an area of four hectares. Importantly, no member of a forest-dwelling tribe or traditional forest-dwellers shall be evicted or<br />
removed from forest land under one’s occupation until the recognition and verification process is completed. Besides, right<br />
of ownership-access to minor forest produce which has been traditionally collected within or outside village boundaries<br />
has been recognized. With implications on R&R issues, the Act recognizes the right to in-situ rehabilitation including alternative<br />
land in cases where they have been illegally evicted or displaced from forest land of any description without granting their<br />
legal entitlement to rehabilitation prior to 13th December 2005.The Gram Sabhas have been designated as the competent<br />
authority for initiating the process of determining the nature and extent of individual or community forest rights (Govt. of<br />
India, 2007a).<br />
The Act should go a long way in protecting the rights of the forest dwellers, particularly the tribal population and help building<br />
up their livelihood at the same time contributing in terms of forest resource conservation. However, it has been criticized on a<br />
number of grounds. One, the Act requires the target population to live ‘in’ the forests, which could be interpreted in terms of<br />
areas ‘recorded’ as forests. This deems to exclude a vast majority of those forest-dwellers who live in areas recorded as revenue<br />
lands but cultivate forest lands and use forest resources. Secondly, investing Gram Sabhas with the power to decide the rights<br />
and grants permits may open the doors for corruption and abuse of power, as land ownership rights are seldom documented<br />
in such areas. Importantly, the Act doesn’t adequately answer as to how the vital balance between tribes and forest systems<br />
will be maintained. There are also concerns of the Act’s impact on the Wildlife Protection Act, passed in the same year.<br />
Despite these criticisms, the very fact that the intent is to provide land ownership to the original inhabitants, the equity issue<br />
gets addressed to a great extent. It is expected that the ownership would lead to better forest conservation and hence<br />
more environmental sustainability.<br />
7.3.2 Improving Access to Food<br />
The access measures in Rajasthan, as in other states, have been along the following lines:<br />
1. The provision of low-priced foodgrains as a method of subsidizing the consumption of the poor.<br />
This, done through the Public Distribution System (PDS), has undergone some changes with the<br />
current Targeted PDS, where low prices are charged only for Below Poverty Line (BPL) households.<br />
2. Food for Work schemes which is now replaced by the National Rural Employment Guarantee<br />
Act (NREGA).<br />
3. The mother and infant supplementary feeding programme through the ICDS.<br />
4. The Mid-day Meal Scheme for children in government-run schools.<br />
ADDRESSING FOOD INSECURITY IN RAJASTHAN<br />
91
Table 7.5: Percentage Share of Poor and Nearly Poor Households who have<br />
Ration Card or Benefited from Various Schemes in Rural Rajasthan (2004-05)<br />
Region Ration card Food for work Annapoorna ICDS Midday meal<br />
Poor Households<br />
Western 94.7 20.5 3.4 2.5 41.3<br />
North-Eastern 97.7 6.2 0.9 0.0 23.8<br />
Southern 98.2 33.4 0.0 4.1 42.8<br />
South-Eastern 95.6 6.2 0.0 6.3 24.0<br />
Rajasthan 96.4 18.2 1.7 2.4 35.5<br />
Rural India 80.0 4.2 1.2 8.8 33.2<br />
Nearly Poor Households<br />
Western 99.1 23.9 4.0 4.3 46.2<br />
North-Eastern 99.7 4.3 1.3 0.0 20.5<br />
Southern 97.1 29.7 0.0 4.1 14.5<br />
South-Eastern 100.0 0.0 0.0 9.0 39.3<br />
Rajasthan 99.0 15.8 1.9 3.0 29.8<br />
Rural India 82.9 2.8 1.1 6.7 29.5<br />
The latest (2004-05) NSS round gives information on the extent to which these schemes reach the<br />
poor in Rajasthan, and thus contribute something to food security, though it does not show us how<br />
much they add to food entitlements (Table 7.5).<br />
Box 7.3: Innovative Schemes for Ensuring Nutritional Security<br />
The Department of Women and Child Development is the nodal agency for the formulation and execution of programmes<br />
directed towards the holistic development of women and child. The department also aims at implementing different social<br />
welfare schemes meant for persons with disability, the old, infirm and indigent persons. Within the purview of the Department<br />
a number of innovative schemes are being executed under the larger aegis of the Integrated Child Development Services<br />
programme:<br />
1. Kishori Shakti Yojana: The scheme aims at improving the nutritional, health and development status of adolescent girls<br />
(11-18 years), promote awareness of health, hygiene, nutrition and family care, link them to opportunities for learning<br />
life skills, going back to school, help them gain a better understanding of their social environment and take initiatives<br />
to become productive members of the society. The scheme is currently being executed in all the states of the country<br />
covering a total of 6118 blocks of which 274 blocks are in Rajasthan.<br />
2. Udisha: In technical collaboration with UNICEF, the scheme envisages a spectrum of locally relevant training interventions<br />
for achieving women and child development goals- rather than training of only ICDS functionaries. It has a new emphasis<br />
on decentralized quality improvement processes, through state and district training plans of action, guided by intersectoral<br />
national/state training task forces.<br />
3. Swayamsiddha: This is an integrated project for the empowerment and development of women based on the formation<br />
of women into Self Help Groups (SHGs) with emphasis on converging services, developing access to micro credit and<br />
promoting micro enterprises.<br />
92 FOOD SECURITY ATLAS OF RURAL RAJASTHAN
In Table 7.5 we have also separately included “nearly poor” households, i.e. those whose per capita<br />
consumption level is within 10% above the poverty line. In the crucial southern zone, both the poor<br />
and nearly-poor have relatively more access to Food for Work schemes than the poor and nearlypoor<br />
in other zones.<br />
The analysis shows that in Rajasthan, proportion of households who have ration cards in both poor<br />
and nearly poor households is considerably higher than the national level estimates. Interestingly, the<br />
contribution of the national Food for Work programme was also higher than in the country as a whole.<br />
Within the state, the southern region has benefited to a larger extent compared to other regions. This<br />
is because this programme was launched in districts which are located in this region. Overall, the<br />
mobilization of the poor to benefit from various government schemes to increase the access of the<br />
poor is better in Rajasthan than at the all-India level.<br />
Surprisingly, the state government is lagging behind in the implementation of the ICDS programme as<br />
compared to other programmes relating to food security. It is far behind the national level estimates in<br />
ICDS coverage for both poor and nearly poor households. Both poor and nearly poor households have<br />
benefited from the mid-day meal scheme (MDM). Households belonging to the western region are major<br />
gainers from MDM scheme as compared to other regions.<br />
Box 7.4: Improved Targeting in the Public Distribution System: An Example from Orissa<br />
The Targeted Public Distribution System is perhaps the largest food safety net in the world. Yet, as surveys have revealed, its<br />
success is tarnished by several shortcomings. A pilot project launched by WFP in collaboration with the Government of Orissa<br />
seeks to address these through the use of new technologies. The project aims to strengthen the identification and verification<br />
process and comprehensively plug the loopholes in TPDS. The project is being implemented in Rayagada district of Orissa with<br />
support from WFP.<br />
The project involves the following: -<br />
- Biometric ration cards (Iris and finger print): to ensure that all ghost and duplicate cards are removed from the system.<br />
- Distribution of new ration cards against biometric validation: to remove the problem of shadow ownership at the<br />
ration card distribution stage.<br />
- Bar-coded coupons: to prevent recording of off-take without the beneficiary’s agreement and also check shadow<br />
ownership of coupons.<br />
- Smart cards installed with a point of sale device (PoS): to prevent incorrect off-take recording and shadow ownership<br />
of ration cards.<br />
- Strong management information system: to improve governance and enhance effectiveness of monitoring by<br />
providing more relevant and real-time information.<br />
- Web based interface: to track and monitor progress.<br />
The Project has helped in improved management and targeting of TPDS to the beneficiaries and has a great potential for<br />
replication elsewhere in the country.<br />
ADDRESSING FOOD INSECURITY IN RAJASTHAN<br />
93
Table 7.6: Status of Public Interventions (ICDS Coverage)<br />
District Index Rank District Index Rank<br />
Ajmer 0.359 10 Jaipur 0.303 26<br />
Alwar 0.305 13 Jaisalmer 0.391 13<br />
Banswara 0.443 3 Jalor 0.301 27<br />
Baran 0.540 2 Jhalawar 0.381 14<br />
Barmer 0.395 8 Jhunjhunu 0.224 32<br />
Bharatpur 0.304 14 Jodhpur 0.309 22<br />
Bhilwara 0.432 4 Karauli 0.357 18<br />
Bikaner 0.290 16 Kota 0.395 12<br />
Bundi 0.413 6 Nagaur 0.304 25<br />
Chittaurgarh 0.573 1 Pali 0.363 16<br />
Churu 0.300 15 Rajsamand 0.528 3<br />
Dausa 0.331 12 Sawai Madhopur 0.300 29<br />
Dhaulpur 0.369 9 Sikar 0.318 21<br />
Dungarpur 0.425 5 Sirohi 0.279 31<br />
Ganganagar 0.402 7 Tonk 0.442 5<br />
Hanumangarh 0.336 11 Udaipur 0.408 9<br />
Source: As stated in Table 3.4, Variable d1.<br />
The index of public interventions which is based on the percentage of ICDS beneficiaries to total<br />
project population is presented in Table 7.6. Some of the tribal dominated districts, Chittaurgarh and<br />
Baran, rank quite high in status of public interventions.<br />
7.3.2.1 National Rural Employment Guarantee Scheme (NREGS)<br />
The National Rural Employment Guarantee Scheme (NREGS) has been devised as a public work<br />
programme and has a key role to play in providing assured employment to one person in each household<br />
for 100 days per year. The major objectives of this scheme are to provide income security through<br />
employment guarantee; reduce/check distress migration from rural to urban areas; and, in this process,<br />
also to create durable assets in villages, leading to overall development of the rural economy; and<br />
empowerment of rural women through the opportunity to earn income independently and to participate<br />
in social groups.<br />
NREGS is based on the National Rural Employment Guarantee Act (NREGA). The Act came into effect<br />
on February 2, 2006 covering 200 selected (backward) districts of the country and was extended to<br />
130 more districts from April 1, 2007. With effect from April 1, 2008 the Government of India has decided<br />
to extend NREGA to all rural areas of all districts of the country. The Act provides a legal guarantee of<br />
100 days of wage employment in a financial year to one person of every rural household whose adult<br />
members volunteer to do unskilled manual work at the minimum wage rate notified for agricultural labour<br />
94 FOOD SECURITY ATLAS OF RURAL RAJASTHAN
Table 7.7: NREGS Performance, April 2008<br />
India<br />
Households Demanded Employment<br />
31.1 million<br />
Households provided employment<br />
30.8 million<br />
Persondays [in millions]:<br />
Total 1268.5<br />
SCs 334.0 (26.33%)<br />
STs 367.4 (28.96%)<br />
Women 879.7 (69.35%)<br />
Others 567.1 (44.71%)<br />
Source: http://nrega.nic.in, 3 April, 2008.<br />
prescribed in the state or, in the event that employment is not provided, to give the person an<br />
unemployment allowance.<br />
The overall performance of NREGA is quite impressive. Of the 31.1 million job card holders who<br />
demanded work under the scheme, 30.8 million have been provided employment. As per the<br />
government information, the scheme has therefore been able to provide employment to almost all the<br />
people among the job card holders who demanded work. Under this scheme, people are mainly<br />
Box 7.5: NREGA and Food Security<br />
A recent study done by the Institute for Human Development to evaluate NREGA's performance in Bihar and Jharkhand<br />
indicates that beneficiaries of the scheme are spending a major part of earnings from NREGS on food-related consumption<br />
items. In Bihar 67% of the earning from NREGA is being spent on food while in Jharkhand, the percentage is 71. However<br />
in case of STs and SCs, who are generally more vulnerable to food insecurity because of low and irregular income, the<br />
spending on food from earning received for the NREGS work undertaken is more than the state level averages. Given the<br />
finding of the study, one can suggest that NREGA can be a safety net for the food insecure population.<br />
Percentage of Income from NREGA Spent on Food and Related Items<br />
Bihar Jharkhand Total<br />
Upper Caste 51.29 89.16 73.31<br />
OBC I 62.62 68.13 63.64<br />
OBC II 72.62 68.69 71.28<br />
SC 68.7 75.68 69.65<br />
ST 84.94 66.24 66.85<br />
Total 67.3 71.31 68.6<br />
Source: Understanding the Process, Institutions and Mechanism of Implementation and Impact<br />
Assessment of NREGA in Bihar and Jharkhand, Institute for Human Development, Delhi, March 2008.<br />
ADDRESSING FOOD INSECURITY IN RAJASTHAN<br />
95
Table 7.8: NREGA Statistics of Rajasthan, April 2008<br />
Employment demanded by households: 2.105274 million<br />
Employment provided to households: 2.102121 million<br />
Persondays [in million]:<br />
Total: 151.171<br />
SCs: 28.739 [19.01%]<br />
STs: 69.345 [45.87%]<br />
Women: 103.864 [68.71%]<br />
Others: 53.087 [35.12%]<br />
Total fund: 12615.9 million<br />
Expenditure: 12263 million<br />
Total works taken up: 59624<br />
Works completed: 9323<br />
Works in progress: 50301<br />
Source: http://nrega.nic.in, 3 April, 2008.<br />
provided with work related to creating or improving rural connectivity, water conservation, land<br />
development, drought proofing, micro-irrigation, renovation of traditional water bodies, land<br />
development, etc.<br />
In Rajasthan, a large number of the beneficiaries under the scheme are women: close to 69 per cent<br />
of them as on 3 April, 2008 (Table 7.8). As pointed out elsewhere in the report, women spend more of<br />
their income than men on essential consumption needs of the family, education of children and health<br />
care requirements, all of which are supportive of improving the nutritional status of their households.<br />
It is worth noting that a large share of the earning received from the NREGS works have been utilized<br />
for food-related expenses. A study undertaken by the IHD has actually documented this finding<br />
regarding the contributions from the NREGS being expended by the villagers on food related<br />
consumption needs (Box 7.5).<br />
The participation of STs in NREGS employment in Rajasthan is quite high. In fact, the proportion is higher<br />
than the all-India proportion. Higher proportion of women in NREGS indicates that it is likely that women<br />
have been taking up low-wage NREGS employment, something that they can also combine with looking<br />
after the household, while men have been migrating for higher-wage employment (See Table 7.8).<br />
Reports show that there are leakages and corruption in the implementation of NREGS (CSE, 2008). This<br />
could be reduced through organization of the workers in these schemes, use of the Right to Information<br />
(RTI), and social audits (jan sunvai), in the use of both of which Rajasthan has been a pioneer. Such<br />
measures would increase the impact of the scheme on incomes and food security. Nevertheless, there<br />
can be no doubt that NREGS, by increasing the incomes of the poorest, is already having a major impact<br />
on improving food security.<br />
96 FOOD SECURITY ATLAS OF RURAL RAJASTHAN
Box 7.6: Innovative Food Security Initiatives: The Food for<br />
Work Programme in Tribal Development Projects<br />
Despite being blessed with bountiful natural wealth and rich in human resources, the forest and tribal-dominated areas in<br />
the country are, highly food insecure and are characterized by degraded natural resources, stark poverty, chronic hunger,<br />
high indebtedness and heavy out-migration. For the sustainable development of some of these regions, Tribal Development<br />
Programmes are being implemented in the states of Chhattisgarh, Jharkhand and Orissa. These were launched by the<br />
state governments with the objective of ensuring household food security and improving livelihood opportunities based on<br />
the sustainable and equitable development of natural resources. The programmes are supported by the International Fund<br />
for Agricultural Development (IFAD) and the World Food Programme (WFP). WFP provides food assistance for a food for<br />
work (FFW) component of these livelihood support activities. The Food For Work (FFW) activity has become enormously<br />
popular in these areas. Payment for FFW includes a cash component and 3 kg of grains (earlier pulses were also included).<br />
The programme, based on the performance of manual labour, is self-targeting towards the poor. It provides 70 days of work<br />
in the lean season when household food insecurity is high.<br />
Participatory Processes and Community Ownership<br />
The point of departure in this programme, compared to other similar programmes is that the poor are enabled to overcome<br />
their own poverty. This principle is woven intrinsically into all processes. To this end the project stresses the participation of<br />
the poor, community ownership and capacity building. Food is given to the community and they take the decisions. Inclusion<br />
of the most marginalized begins with the planning. All activities are discussed in the Gram Sabha. What activity should be<br />
taken up? What are the likely benefits? Who will benefit from the creation of the asset? How many people will get work? All<br />
these questions are debated and decided by the community. The project facilitates them in prioritizing, planning and<br />
implementing the plans.<br />
The project shows how a simple activity like providing food as part of the wage for work can become a kaleidoscope reflecting<br />
all the pulls, pressures, and dynamics of village life. This would not have been the case had it been a top-down programme<br />
where people had little or no role in decision-making. That not being the case, and all decisions now being taken in the<br />
Gram Sabhas, they have become sites of deep contestation. Valuable lessons in collective decision-making, negotiating,<br />
handling conflicts and targeting are being learnt.<br />
The most marginalized are for the first time in their lives finding a platform for articulating their views. It is for this reason,<br />
that most community assets created under the programme are located so as to benefit poor hamlets and households and<br />
there is a significant impact on the food security of a desperately poor population living in remote and inaccessible areas.<br />
Similar activities can be initiated in the tribal dominated backward regions of Rajasthan for alleviation of seasonal food<br />
insecurity and sustainable livelihood generation in Rajasthan.<br />
Food for Work Activities<br />
Tribal communities share a symbiotic relationship with forests that are a major source of food, nutrition and livelihoods.<br />
Empowering the community to engage in forestry-related activities has led to increase in yields of NTFPs and enhanced<br />
food availability.<br />
The list of activities taken up under FFW is very long and, inter alia, includes land development, earth-bunding, stone-bunding,<br />
gully-plugging, pond construction and restoration, backyard plantations, plant nurseries, digging wells and building canals,<br />
trenches and check dams. These activities have helped to irrigate large areas. For the first time people have been able to<br />
ADDRESSING FOOD INSECURITY IN RAJASTHAN<br />
97
get a second crop of wheat apart from the single rain-fed crop of rice that they used to harvest earlier. Many farmers have<br />
cultivated vegetables for the first time in generations. ‘Neither our fathers nor our grandfathers ever cultivated these crops’<br />
they say with obvious pride.<br />
In some villages, as for instance in Semra in Chhattisgarh, under the food for work programme, villagers have almost literally<br />
moved mountains: They dug a well that has been lined with massive boulders hauled from nearby hills. Apart from providing<br />
work and food for a large number of the poorest, it has helped ease the problem of drinking water for them and their livestock.<br />
Enhanced Production and Productivity<br />
There has been a big boost in production in many villages. In village Sagasai in Jharkhand for instance, paddy production<br />
takes place by the traditional ‘broadcast’ method. However, as a result of new sources of irrigation and water-harvesting,<br />
paddy production through transplantation has become possible. This has doubled yields, enhanced incomes and ensured<br />
food security.<br />
Demand-driven approaches that give play to people’s initiatives throw up as many diverse ways of doing an activity as the<br />
activities themselves. They draw on people’s intuitive knowledge of local conditions, their creative urges and their innate<br />
skills in a way no top-down programme can. In village Ghangari, in Chhattisgarh, bunding was taken up around fields of the<br />
poor. In addition, they had the innovative idea of planting arhar (a pulse rich in protein) on the bunding. This not only utilized<br />
the land which would otherwise have gone waste, but the roots of the plant also strengthened the bunding which often<br />
gets washed off in the rains, because the fields are situated on a slope.<br />
Impact on Migration and Indebtedness<br />
Ask anyone what has been the impact of the Food For Work programme, and if the first answer is ‘people do not go hungry<br />
anymore’, the second will certainly be, ‘people have stopped migrating for work’. Migration has stopped almost totally,<br />
particularly distress migration to far-off areas. In Ranchi, the capital city of Jharkhand, it was common to see hordes of<br />
adolescent tribal girls standing by the main square, waiting for labour contractors who entice them with promises of<br />
employment. In project areas, migration of adolescent girls from the Ho tribe used to be a common phenomenon. This has<br />
almost stopped now. The impact has not been even across the project areas, but there is little doubt that it is one of the<br />
most important positive outcomes of the programme.<br />
The other significant impact has been on indebtedness. In fact, the main ‘casualty’ of the project has been the moneylender.<br />
Self-help groups (SHGs) have mushroomed in the project areas and as their lending operations expand, the business of the<br />
moneylender has been shrinking.<br />
Strengthening of Local Institutions<br />
The most intangible, yet the most critical impact of the Food For Work programme, and one that holds the promise of<br />
sustainability, has been the strengthening of grass root level institutions; particularly the Gram Sabha and SHGs. As one<br />
young man in a village in Ranchi said: ‘Earlier our village assembly used to meet only for settling disputes between families,<br />
or for religious purposes, but never to discuss development issues. Now we regularly meet to discuss what we should do<br />
for the progress of the village. Very often women outnumber men in the meetings.’<br />
A woman in Kalahandi district of Orissa said, “Initially, few people would come to the project meetings; in fact meetings<br />
frequently had to be adjourned for lack of a quorum. Now that people are seeing the benefits of the programme, the attendance<br />
has swelled.’<br />
98 FOOD SECURITY ATLAS OF RURAL RAJASTHAN
The lessons learnt by the village community in decision-making, handling, distributing and monitoring the food for work<br />
activity has had visible positive spin-offs on other programmes. The impact on improved functioning of the ICDS and schools,<br />
for example is in evidence in several villages. In a village in Koraput district in Orissa, the women say, ‘the anganwadi worker<br />
used to come to the centre only once a week. Now since the OTELP (Orissa Tribal Empowerment and Livelihood Project)<br />
started, she has been coming regularly because she knows she is accountable to the Gram Sabha’.<br />
Women’s SHGs have become vibrant vehicles of change. They are empowering women in many remarkable ways. For one,<br />
they are helping women to become financially sound through income generating activities. The enhanced availability of<br />
water as a result of FFW activities has enabled them to take up diverse income-generating projects. Some women have<br />
taken up vegetable cultivation; others are engaged in aquaculture. At the same time, SHGs have helped women develop<br />
confidence to challenge regressive social norms and attitudes.<br />
The projects are being implemented in the most poverty stricken belt of India. Wherever there is poverty, there is alienation,<br />
strife and revolt. In all this the Food For Work programme has proved invaluable in building trust and confidence and has<br />
taken care of the primary need of people of food with dignity. In the words of a young labourer, it is a vardan or a ‘gift of<br />
God”.<br />
Srivastava, N. (2006)<br />
7.3.2.2 Empowerment of Women<br />
From the analysis of variables affecting overall food security (FSI) foregoing discussions, it emerges<br />
that female literacy in rural areas is the most significant factor determining food security of the rural<br />
population. This can be corroborated by the fact that most of the districts in the most food insecure<br />
category rank very poorly in terms of rural female literacy. Thus, it is imperative that girls’ literacy be<br />
prioritized and all barriers to their access to education be effectively tackled. This should be coupled<br />
with the provision of quality education, especially for girls from the poor and marginalised communities.<br />
Women’s workforce participation improves the household’s access to food, and is also likely to improve<br />
the woman’s own access to food – following Amartya Sen’s argument that women’s independent income<br />
will increase their bargaining power within the household.<br />
Women’s workforce participation is also intrinsically related to migration. The nature of migration largely<br />
reflects household subsistence strategies in the face of social, cultural, demographic and other<br />
constraints. It is generally males who dominate in the streams of labour migration, but in the case of<br />
tribals and lower economic strata both men and women migrate together for work. This is because, as<br />
already stated, in these populations the constraints on women’s participation in non-household activities<br />
are fewer. In some sectors, like construction, brick kiln and sugarcane cutting, family migration is<br />
common as it is more economical for employers (Srivastava & Sasikumar, 2003).<br />
The food insecure are usually thought to be non-bankable or not credit-worthy. But, they do access<br />
credit from moneylenders, at very high rate of interest per month. They frequently end up in inter-linked<br />
market transactions, selling their advance labour or non-timber forest products (NTFP) for much less<br />
than market prices. Such inter-linked market transactions often occur at times of acute distress, such<br />
ADDRESSING FOOD INSECURITY IN RAJASTHAN<br />
99
as when medical emergencies require immediate credit, or when drastic fall in the ability to acquire<br />
food lead to a need for credit. In such situation, if credit were available, these inter-linked market<br />
transactions could be avoided.<br />
It hardly needs to be repeated that financial services, both savings and credit, are required by the<br />
poor, both to enable consumption smoothening and to utilize market opportunities. Whether through<br />
the Indian SHG-model or the Bangladesh Grameen Bank model, micro-financial services need to<br />
be provided. Through an increased use of educational facilities and of credit to utilize growing market<br />
opportunities, micro-finance programmes can lead to increased food security with development. The<br />
food security impact of micro-finance is also increased because of women empowerment in the<br />
household.<br />
7.3.3 Enhancing Absorption<br />
Increasing the nutrient intake of the poor is not the ultimate solution of food security. The capacity of<br />
body to utilize the increased intake of nutrients is very important. This depends closely on<br />
complementary measures, such as access to safe drinking water and hygienic sanitation. These two<br />
inputs would substantially reduce exposure to water-borne and gastro-intestinal diseases, such as<br />
diarrhoea and cholera, which often destroy the benefits of food consumed. We discuss below measures<br />
to improve access to clean drinking water and promote hygiene and sanitation.<br />
7.3.3.1 Rural Water Supply<br />
Accelerated Rural Water Supply Programme (ARWSP):<br />
The main objective of ARWSP is to provide potable drinking water by way of installing tube wells, sanitary<br />
wells and piped water supply projects in rural areas. For implementation of Rural Water Supply Schemes,<br />
Figure 7.3: Water Quality Affected Habitations<br />
100 FOOD SECURITY ATLAS OF RURAL RAJASTHAN
Government of India provides funds under ARWSP which is a centrally sponsored programme (CSP).<br />
It has been proposed to provide Rupees 5.5 million as the state share in the State Plan under ARWSP<br />
during the 11th Plan Period. It has been decided to cover all not-covered and partially-covered<br />
habitations, rural schools and quality affected habitations from 2005-06 to 2008-09 in a phased manner<br />
to achieve the goal of Bharat Nirman.<br />
Swajaladhara:<br />
The Rural Drinking Water Supply Programme has been launched in the state from December 2002.<br />
The purpose of this scheme is to ensure community participation and to shift from supply driven to<br />
demand driven approach. The scheme envisages 10% of the capital cost of the project to be borne by<br />
the community along with the responsibility for operation and maintenance of water supply projects,<br />
and the remaining 90 per cent of capital cost to be borne by Central government through the District<br />
Water Supply and Sanitation Mission.<br />
Bharat Nirman: Rural Water Supply<br />
The norms for coverage under Rural Drinking Water supply are:<br />
1. 40 litres per capita per day of safe drinking water for human beings.<br />
2. One hand pump or stand post for every 250 persons.<br />
3. The water source should exist within 1.6 km in the plains and within 100 meter elevation in the<br />
hilly areas.<br />
Position of Rajasthan<br />
Coverage of Drinking Water Supply: According to available provisional survey estimates, about 79,000<br />
habitations are to be covered under the Rural Water Supply Scheme. About three-fourths of the<br />
habitations have not been covered so far and one-fourth are partially covered.<br />
Quality of Water: Poor quality of drinking water supply is one of the major problems in Rajasthan. Nearly<br />
41,000 habitations were identified as having drinking water of poor/infected quality. About 46 per cent<br />
of the habitations had multiple factors affecting their water quality. In about one-fifth of the habitations<br />
water is contaminated/ polluted by fluoride and nitrate contents. The problem of iron contamination was<br />
found in a limited number of habitations.<br />
A number of schemes that require Rs. 10,000 crore are pending completion, but there is a provision of<br />
funds to the tune of only Rs. 1,600 crore. Presently, there are seven schemes underway, such as Chambal<br />
Sawai Madhopur, Nagaur Lift Yojana, Narmada canal project, Mata-Jayal scheme, and the Bisalpur-<br />
Dudu-Fulera Supply Scheme. Another drinking water supply project, Barmer Lift Yojana is concerned<br />
with quality purification.<br />
ADDRESSING FOOD INSECURITY IN RAJASTHAN<br />
101
Infants and Young Children<br />
Box 7.7: Meeting the Nutritional Needs of Vulnerable Groups<br />
According to the National Family Health Survey 3 (NFHS-3, 2005-06), in India 40.4 per cent and 44.9 per cent of children<br />
under 3 years of age are underweight and stunted, respectively. The prevalence of underweight and stunting continually<br />
increases up to the age group of 18-23 months. This indicates that there is a need for improvement in complementary feeding<br />
practices, and in the quality of complementary feeds of infants and young children. Besides the high rates of malnutrition,<br />
the infant mortality rate is also quite high at 57 per 1,000 live births.<br />
During the first two years of life, significant cognitive development and physical growth occurs that requires adequate nutrition<br />
as well as good care practices. Damage that may occur at this early age is often irreversible and has lifetime consequences.<br />
Therefore, it is of critical importance that children receive proper nutrition in the first few years of life.<br />
In order to address the prevalence of widespread malnutrition and the high infant mortality rate that impede human<br />
development, there is a need for developing low-cost supplementary food.<br />
7.4 Improving Performance<br />
In Rajasthan, the Right-to-Food movement has used the Right to Information Act (RTI) for bringing<br />
information about government programmes in open. In what are called Jan Sunvais (public hearings)<br />
with the slogan “Hamara Paisa, Hamara Hisaab” (Our Money, Our Account), details of the schemes<br />
have been brought into the open. This can be useful in building public opinion, creating awareness<br />
and mobilizing the community against non-performance and corruption in government schemes.<br />
There is an important role for political mobilization of the poor in improving implementation of the ICDS,<br />
MDM, NREGS and other such schemes. Implementation of these schemes has been decentralized<br />
down to the panchayat level. But panchayats can be corrupt and dominated by local power-brokers.<br />
A pilot social audit held in Bolangir district of Orissa in November 2001 showed substantial and relatively<br />
open corruption at panchayat level (de Haan and Dubey, 2005, fn. 39, p. 2329) Studies in other states<br />
have shown that when women are in panchayats, or lead panchayats, the panchayats perform better<br />
in administering food-related interventions. In IFAD projects in Andhra Pradesh too, it was observed<br />
that women’s SHGs performed better in undertaking small infrastructure projects than those managed<br />
by men and saved more money for the community than the latter. Therefore, increasing involvement of<br />
women in Panchayats can be a useful tool in Rajasthan to reduce corruption and improve their<br />
performance.<br />
The contribution of the PDS in promoting food security is well covered in the extensive literature on<br />
the subject. But a study by Jos Mooij (2001) points out that the supply of cheap grain for below BPL<br />
households has made running a PDS highly profitable, as cheap grain can easily be diverted into the<br />
open market or sold to APL (above poverty-line) households. More recently, the Central government is<br />
reported to have pointed out to the West Bengal government that there has been diversion of cheap<br />
PDS grain to the Bangladesh market. Many newspaper reports point out that even in the midst of<br />
102 FOOD SECURITY ATLAS OF RURAL RAJASTHAN
starvation, the Food Corporation of India’s godowns remain full of grains. If there is insufficient<br />
purchasing power with the poor in a district, even the supply of grain at subsidized prices is unlikely to<br />
be accessed by the poor, and there will inevitably be a tendency for this grain to flow to markets, whether<br />
within the locality or outside, where prices are higher (Jos Mooij, 2001).<br />
This points to two critical issues in the functioning of the PDS: First, the dual price system that it brings<br />
about, encouraging diversion of foodgrain from the lower BPL price to the higher open market price.<br />
Second, the inability of many poor households to utilize their entilements because of inadequate<br />
purchasing power.<br />
The abolition of dual pricing would reduce the usual diversion problems, but the problem of the poor<br />
not being able to utilize the subsidy would still exist. A direct transfer would make sure that the person/<br />
household actually benefited, since it is not conditional on the beneficiary to provide some collateral<br />
amount.<br />
Another way of enabling the poor to acquire their public entitlement of grain would be to provide work,<br />
through schemes such as NREGS, which allows the poor to acquire the money needed for purchase<br />
of food. A combination of a coupon system with NREGS could improve the functioning of the PDS<br />
system.<br />
The above-mentioned food-based schemes are meant to meet the needs of shorter-term or even<br />
transient (seasonal) food insecurity. By increasing the quantities of public entitlements to food they<br />
can deal, to an extent, with immediate problems of hunger. If these foods are fortified, or supplements<br />
given as in the ICDS schemes, some nutritional gaps can be addressed. But, any solution to food<br />
insecurity requires an increase in the sustained access to food in sufficient quantity and quality. This<br />
requires an increase in the production and earning capacity of the households and individuals too, given<br />
that there are gender-based discriminations in the distribution of food and allied health-care services<br />
within households. It is important, therefore, that food security schemes be linked with development<br />
activities.<br />
*****<br />
ADDRESSING FOOD INSECURITY IN RAJASTHAN<br />
103
8. Conclusion: Towards a Food Secure Rajasthan<br />
8. Conclusion: Towards a Food Secure Rajasthan<br />
The analysis in previous chapters shows that ensuring food security and improving nutritional status is<br />
a challenge for the state as a whole. Various schemes and initiatives in recent years show commitment<br />
of the government to improve the situation. Through this report we have endeavoured to bring out the<br />
performance of districts in each of the food security related indicators, clearly indicating the well and<br />
poor performing districts. Priority districts for food security intervention have also been identified to draw<br />
attention to the need for more inclusive growth efforts and special interventions to bridge the divide<br />
between the regions and districts of the state. The state has made progress on certain indicators which is<br />
reflected in discussions on the interventions in the states and the results of the same should be evident<br />
in subsequent rounds of Census and NFHS. The analysis also takes into account the information from<br />
the state government which makes the policy recommendations of this atlas pertinent for immediate<br />
use and provides scope for further upgrades with availability of new datasets.<br />
Reducing Child Mortality and Under-nutrition<br />
In Chapter 3 of the report, Food Security Outcome Index based on Under-Five Mortality and Proportion<br />
of Underweight Children is presented. The higher incidence of under-five mortality and higher proportion<br />
of underweight children in most of the districts of Rajasthan do indicate a grim picture as far as the Food<br />
Security Outcome is concerned. The national figure for under-five mortality is 74.3 per 1,000 live births.<br />
Whereas all the districts in the state have under-five mortality figures above the national average. As many<br />
as 24 districts out of the total 32 have mortality figures above 100. Banswara, Bhilwara, Chittaurgarh,<br />
Dungarpur, Pali and Udaipur have under five mortality rate of more than 150. Similarly, proportion of<br />
under-weight children is also very high. Almost all the districts except Banswara has the proportion of<br />
underweight children more than the national average of 42.5 per cent. On the whole 24 districts have<br />
been found to appear in the three insecure categories of the Food Security Outcome Index.<br />
It is a fact that any improvement in nutritional level would increase the productivity of the individual. With<br />
regard to mothers, there is the substantial future benefit of reducing the incidence of low birth weight<br />
babies. For those with severe under-nutrition, mother and child health and nutrition programmes have<br />
a considerable role in improving production capabilities. But, the implementation of such programmes,<br />
including issues of reaching those with severe under-nutrition depends very much on the demand<br />
from the community for these services. In the absence of such demand from the most undernourished<br />
beneficiaries, the benefits of such programmes are very likely to be captured by the better-off in the<br />
village. This also leads to leakages in the system. Decentralization of the implementation of programmes<br />
has to be combined with enhanced participation of the community and awareness on issues of undernutrition,<br />
in order for the benefits to reach the target group for whom it is intended.<br />
Another issue that might need urgent attention in terms of mitigating persisting high malnutrition is<br />
the departmental mode of implementation of programmes. All the issues related to child and women<br />
malnutrition are solely vested with the department of Women and Child Development. The issue may<br />
not be solved unless there is complete support and accountability from the departments of Health<br />
and Family Welfare, Rural Development and Panchayati Raj. This calls for a synergy in action and<br />
104 Food Security Atlas of Rural RAJASTHAN
convergence in planning and implementation for handling such issues.<br />
The Women and Child Development department of Rajasthan has implemented some innovative<br />
schemes like Purak poshahar for children and Suraaj for pregnant women in order to reduce the<br />
vulnerability among children and pregnant women, wherein some efforts of convergence are evident.<br />
However, as per NHFS-III (2005-06) the coverage of services under ICDS has been very poor. Low<br />
rates of Immunization, ante-natal and health check up, supplementary nutrition also highlight the need<br />
for improvement in convergence between the Department of Women and Child Development (DWCD)<br />
and Health and Family Welfare. To avoid micro-nutrient deficiencies, supply of fortified food should be<br />
explored as a viable option to be integrated into the existing schemes. Proper utilization of such innovative<br />
attempts is needed to bring the child mortality and malnutrition under control. It has been found that there<br />
is a long and frequent disruption in the supply of nutrition to highly vulnerable children and mothers.<br />
There is a need to strengthen transparent procedures to improve the efficiency in implementation of<br />
such programmes with community involvement to reduce misutilization. At the same time, improving<br />
outcomes with regard to malnutrition is very much a matter of addressing food security as such, which<br />
needs to be acted upon simultaneously.<br />
Reducing Nutritional & Food Insecurity:<br />
Improving Availability, Access and Absorption<br />
The food security index based on the three dimensions, viz availability, access and absorption, is<br />
discussed in detail in chapters 4 to 6. The three indicators which formed the Food Availability Index<br />
in this report are irrigation extent (proportion of net irrigated area to net sown area), per capita value of<br />
agricultural output, and rural road connectivity. Rajasthan has a vast tract of arid areas. In Rajasthan,<br />
nearly one-third of the net sown area is irrigated. The districts with high irrigation, good rainfall and good<br />
condition of aquifers are all in canal command areas. These districts also have high per capita value<br />
of agricultural output. Districts in the arid western plain and transitional plain of the inland drainage<br />
regions have the lowest proportion of irrigated land. Per capita value of agricultural output therefore is<br />
low in these districts. In terms of rural connectivity, Jhunjhunu, Ganganagar and Pali occupy the leading<br />
position in road connectivity where more than two-thirds of the villages have access. Districts located<br />
around the Aravalli hills have a low proportion of road connectivity. Overall, Ganganagar, Kota, Alwar<br />
and Bharatpur have been identified as secure in terms of the food availability index. On the other hand<br />
Bhilwara, Jaisalmer, Udaipur, Rajsamand and Barmer are extremely insecure. In all, 11 districts fall in<br />
secure and moderately secure categories in the availability index and the remaining 21 districts have<br />
been identified as insecure. Broadly, northern, northeastern and eastern part of the state are relatively<br />
secure in terms of availability index in comparison to the western, southern and south southwestern<br />
part.<br />
The average rainfall is very low to low in most parts of the state and its variability is very high over time<br />
and space. Therefore, there is a need for more effective conservation and utilization of water resources<br />
in these regions. The watershed programmes have a significant role to play in this regard (Sen et al.,<br />
CONCLUSION<br />
105
2007). Revitalizing the agrarian economy in the districts with rain fed agriculture is crucial to improving<br />
the income and thus food security of the poor in these areas. This requires both an increase in irrigation<br />
and in watershed development programmes like RGMWM, NWDPRA etc. Appropriate diversification to<br />
high-value crops could also be undertaken. These measures would increase productivity and income of<br />
small and marginal farmers. National Policy for Farmers (2007) has been formulated and approved by<br />
the Government of India to improve the economic viability of farming by substantially improving the net<br />
income of farmers in addition to improving productivity, land, water and support services, formulation<br />
of an appropriate price policy and risk management measures are also required for improving the<br />
agriculture in the state. What is important is to pay attention to existing areas of rain fed agriculture.<br />
In forest areas, security of tenure is needed to create conditions favorable for investment to enhance<br />
production or to take up new forms of cultivation. The implementation of the Forest Rights Act (FRA),<br />
with titles given jointly to men and women, becomes crucial in this respect. But, bringing about changes<br />
in production systems also requires an enhancement of capabilities of both women and men.<br />
In Rajasthan, it is found that in certain areas animal husbandry plays a more important role than<br />
agriculture from the food security point of view. Experience of Bhilwara dairy that was initiated on<br />
the Anand pattern has yielded encouraging results in the district and adjacent areas. Provisioning of<br />
marketing and livestock development related interventions will help in improving food security.<br />
At the same time, productivity needs to be increased in the vast common property resources (CPRs)<br />
classified as watersheds. Further, distribution of land to the landless including women, would improve<br />
the food security and could also serve as an incentive to increase productivity. The access of landless<br />
and women to these CPRs would increase.<br />
Another core area of concern is rural roads. Rural connectivity is very poor in most of the districts of<br />
Rajasthan. Fifty three per cent of villages in Rajasthan are connected with paved roads where as the<br />
remaining 47 per cent are not. The vast size of the state with neglected interiors and difficult, hilly and<br />
desert terrain, pose tremendous challenge for maintenance and upkeep of roads. NREGA and other<br />
food-for-work schemes can be channelized to improve the key areas of village road connectivity and<br />
small-scale irrigation. Village approach roads and small irrigation schemes (e.g. check dams in valleys,<br />
or moisture retention works (on sloping lands) can both increase economic opportunities and productivity.<br />
Improved roads would also provide better access to both health and educational facilities. Improvements<br />
in rural connectivity can improve the terms of access to markets. Improved communication will also<br />
enable rural producers to produce for the wider market, whether regional, national or global, as also<br />
larger pools of knowledge. The central government programmes such as PMGSY and Bharat Nirman<br />
with the objective of making all weather roads to connect all villages are good opportunities for the state.<br />
There is a need to speed up and strengthen the process of implementation of these programmes.<br />
In a relatively open economy, there should not be sole reliance on agriculture as the engine of rural growth.<br />
Non-agricultural production for wider markets is also an option. But, along with better communication and<br />
transport infrastructure, this also requires a more educated workforce. A higher level of education would<br />
106 Food Security Atlas of Rural RAJASTHAN
enable producers to take up opportunities available through connections with the wider economy and<br />
also improve the types of jobs they can avail on migrating. Migration is important, for as we have seen<br />
earlier, consumption in the better-off districts is probably related to income from non-farm development<br />
and to migrants’ remittances. This is not to deny the importance of increasing farm productivity in the<br />
food insecure districts (so as to increase the access to food of small and marginal farmers in rain fed<br />
agriculture), but to point out that options are not limited to agricultural development.<br />
The Food Access Index has been formed with the help of six indicators – proportion of agricultural<br />
labourers, proportion of Scheduled Castes and Scheduled Tribes, average monthly per capita expenditure,<br />
rural wage rate, ratio of working age population and rural female literacy. The analysis shows that in<br />
case of deployment of the labour force in non-agricultural activities, the majority of the food insecure<br />
districts are lagging behind. So too are the tribal population-dominated districts, except Jaisalmer and<br />
Barmer. Almost a similar picture emerges in the case of the proportion of SCs/ STs and the ratio of<br />
working age population. The low position of average per-capita consumption expenditure is noticeable<br />
in all the food insecure districts. The rural wage rate was extremely low in nine districts. In seven other<br />
districts it was low and very low. The case of status of female literacy rate was similar, with marginal<br />
differences. Certain interventions can be made in improving the access to food in rural Rajasthan,<br />
which include:<br />
l<br />
l<br />
l<br />
Encourage the non-farm sector which may help in reducing the dependency on farm sector which<br />
is one of the major factors responsible for food insecurity.<br />
Initiate public policy and intervention which may help in enhancing employment and income<br />
opportunities which will further will help in increasing average per-capita expenditure.<br />
Make all possible efforts to improve female literacy rate in those districts where it is low. The<br />
government has initiated certain steps in the state to improve the literacy among females; which<br />
should be strengthened.<br />
Access measures in Rajasthan has been addressed through three flagship programmes – TPDS,<br />
Food for Work schemes (now carried out under the NREGA), ICDS and Mid Day Meals Scheme. As<br />
is evident from the analysis, the reach of these programmes in poor and nearly poor households is<br />
very low. There is a need to intensify implementation of these programmes with improved monitoring<br />
to make it effective in addressing issues related to access and absorption.<br />
There is an important role for mobilization and participation of the poor in improving implementation<br />
of the ICDS, MDMS, NREGS and other such schemes. Studies in other states have shown that when<br />
women are in panchayats, the panchayats perform better in administering food based interventions.<br />
All these efforts provide safety nets against household deficit in food. However, a long term solution to<br />
food insecurity requires an increase in the regular access, through income or self-production, to food<br />
in sufficient quantity and quality. This requires an increase in the production and earning capacity of<br />
the households and individuals too.<br />
CONCLUSION<br />
107
Given women’s general responsibility for food security in rural areas of developing countries, and given<br />
the pervasive gender bias in these societies, one way of reducing gender bias is the empowerment of<br />
the poor. However more sensitive approaches would be needed to address gender power relations at<br />
the household consumption level to address gender imbalance in terms of access. Consequently, food<br />
security approaches need to increasingly pay attention to the elimination of gender inequality and to<br />
women’s empowerment as important preconditions.<br />
While security of tenure would allow an increase in investments on land thus higher incomes, complementary<br />
steps need to be taken to enhance women’s capability in the household and community. Besides, literacy<br />
and education, there is also the issue of women’s land rights. Among the food insecure, women have<br />
high labour force participation, but they do not have ownership rights over the lands on which they<br />
work. Women’s ownership of land could have a double effect. It could lead to greater productivity and<br />
investment by women in land improvement by enhancing their status in the household. This along with<br />
literacy could also pave the way for women to have more say in the disposition of household income -<br />
away from wasteful areas (e.g., alcohol consumption) and improve household distribution of food.<br />
Empowerment of poor women, or of the poor as a whole, is not only a matter of individual agency but<br />
also of the poor putting their stamp on economic policies. This is necessary in order to bring about the<br />
much-needed political will that is often referred to as the missing element for bringing about adequate<br />
attention to food security policies.<br />
It is well known that the Dalits and STs are concentrated among the agricultural labourers in most of<br />
the Indian states. Agricultural labourers are an important category of the food insecurity in Rajasthan.<br />
Agricultural wages and the number of days of employment are two issues which can be influenced by<br />
a number of factors – including transfer of land and resources to the landless and creation of other<br />
avenues of employment. The role of employment and food based programmes comes in for supporting<br />
those who newly acquire land to invest labour in improving their lands. Employment schemes directed<br />
towards that end would be effective.<br />
Food Absorption Index, which is the combination of safe drinking water and availability of health,<br />
facilities presents two distinct regions that appear to be in critical state. First are the western arid region<br />
of Barmer, Jaisalmer, Bikaner. Second is Karauli and Bharatpur districts in northeastern Rajasthan. These<br />
regions have lowest access to safe drinking water and health facilities. The southern and southeastern<br />
part of the state are relatively secure in terms of absorption index.<br />
Access to safe drinking water in the food insecure districts is poor with high levels of fluoride content and<br />
poor quality of water. Treatment of drinking water and information about it can go a long way in improving<br />
the water quality and thereby food absorption. Given the high incidence of water-borne morbidity and<br />
mortality, improving the quality of water is likely to have a strong bearing on the food security outcomes.<br />
Besides, provision of basic health infrastructure is critical for addressing the requirements of the rural<br />
population.<br />
108 Food Security Atlas of Rural RAJASTHAN
According to available provisional survey estimates, about 79,000 habitations are to be covered under<br />
the Rural Water Supply Scheme. About three-fourth of the habitations have not been covered so far<br />
and one-fourth are partially covered. Poor quality of drinking water is one of the major problems of<br />
Rajasthan. Nearly 41,000 habitations were identified as having drinking water of affected quality. About<br />
46 per cent of the habitations had multiple factors affecting their water quality. In about one-fifth of<br />
the habitations water is contaminated/ polluted by fluoride and nitrate contents. The problem of iron<br />
contamination was found in a limited number of habitations.<br />
A number of schemes that are currently on require approximately Rs. 10,000 crore to be completed, but<br />
there is a provision of funds to the tune of only Rs. 1600 crores. Presently, there are seven schemes<br />
underway, such as Chamble- Sawai Madhopur, Nagaur Lift Yojana, Narmada canal project, Mata-Jayal<br />
scheme, and the Bisalpur-Dudu-Fulera Supply Scheme. Another drinking water supply project, the<br />
Barmer Lift Yojana is concerned with quality purification.<br />
Improvement in the implementation of these schemes depends, at one level, on improvement in<br />
administration and governance systems. But, more important is the role of the people who are to<br />
benefit from the schemes, whether organized through CBOs, NGOS or traditional tribal bodies. They<br />
play a very important role by insisting on the adequate implementation of these schemes and ensure<br />
that benefits are reaching the right beneficiaries. Framing adequate policies is only the first step. What<br />
is crucial is that people, women and men, assert their democratic political rights in order to ensure<br />
effective implementation of the schemes and policies.<br />
Along with the interventions outlined above, to improve access to and absorption of food, it is also<br />
necessary to increase the information and knowledge on improved nutritional and health/ hygiene<br />
practices. Elementary measures like exclusive breast-feeding of infants till the age of six months,<br />
age appropriate complementary feeding for children between 6 months to 2 years, washing hands<br />
after defecation, combined with knowledge of nutritionally superior foods, are needed to supplement<br />
improved access conditions.<br />
Key Interventions in Priority Districts<br />
In this report an attempt has been made to see areas of interventions for priority districts of the state.<br />
Food Security Outcome Index and Food Security Index have helped in identifying priority districts which<br />
need special attention and interventions from the policy makers and state government. However, since<br />
the unit of analysis is district which is one of the basic administrative units where the programmes<br />
are implemented, Table 8.1 shows the districts lagging behind on specific indicators so that specific<br />
intervention can be framed in order to reduce food insecurity in the region.<br />
Table 8.1 shows that the western region of Rajasthan requires priority interventions in maximum number<br />
of food security indicators. In this region, the food availability, access and absorption indicators require<br />
equal interventions. Bikaner requires interventions in 8 out of 11 indicators. Barmer, Jaisalmer and<br />
CONCLUSION<br />
109
Table 8.1: Key Interventions in Priority Districts<br />
NSS Regions<br />
District<br />
Irrigation Extent<br />
Per Capita Value of<br />
Agricultural Output<br />
Rural Connectivity<br />
Rural Wage Rate<br />
Average Monthly<br />
Per Capita Expenditure<br />
Agricultural Labourers<br />
Proportion of<br />
SCs and STs<br />
Ratio of Working<br />
Age Group Population<br />
Rural Female Literacy<br />
Access to Safe<br />
Drinking Water<br />
Access to PHC<br />
North Eastern Ajmer √ √ √ √<br />
Bhilwara √ √ √ √ √<br />
Dhaulpur √ √ √<br />
Karauli √ √ √ √ √<br />
Sawai Madhopur √ √ √ √<br />
Tonk √ √ √ √<br />
South Eastern Baran √ √ √ √ √<br />
Bundi √ √ √<br />
Chittaurgarh √ √ √ √<br />
Jhalawar √ √ √ √<br />
Southern Banswara √ √ √ √ √ √<br />
Dungarpur √ √ √ √ √ √<br />
Rajsamand √ √ √ √ √<br />
Udaipur √ √ √ √ √ √ √<br />
Western Barmer √ √ √ √ √ √ √<br />
Bikaner √ √ √ √ √ √ √ √<br />
Jaisalmer √ √ √ √ √ √ √<br />
Jalor √ √ √ √ √ √<br />
Jodhpur √ √ √ √ √ √ √<br />
Nagaur √ √ √ √ √ √<br />
Pali √ √ √ √ √ √<br />
Sirohi √ √ √ √<br />
110 Food Security Atlas of Rural RAJASTHAN
Jodhpur, which are arid regions of the state, are also performing poorly in almost 7 of the indicators.<br />
In southern region, irrigation and agricultural productivity among the availability indicators require<br />
priority attention. Among the access indicators, rural wage rates, monthly per capita consumption<br />
expenditure, proportion of Scheduled Castes and Scheduled Tribes and female literacy need to be<br />
improved. The absorption indicators of safe drinking water and health facilities are relatively better in<br />
the priority districts in the southern region and do not require priority interventions. Priority districts in<br />
the southeastern region of Rajasthan have poor road connectivity among the availability indicators.<br />
Among the access indicators, these districts require priority interventions for rural wage rate and rural<br />
female literacy. Absorption indicators are relatively good but Baran and Bundi do require interventions in<br />
terms of health facilities. In the northeastern priority districts, per capita value of agricultural production<br />
is low and requires interventions. Among the access variables, rural wage rates and rural female literacy<br />
rate together with ratio of working age population do require interventions in different priority districts.<br />
Access to safe drinking water in Dhaulpur, Karauli and Sawai Madhopur and access to health facilities<br />
in Karauli and Sawai Madhopur requires interventions in the absorption indicators.<br />
The analysis of the districts in rural Rajasthan reveals that the situation of food insecurity is quite<br />
vicious in the sense that the priority districts identified appear to be performing poorly on many of the<br />
indicators. A strong comprehensive strategy is required in order to move towards a food secure state<br />
on all parameters discussed in the atlas and not just focusing on limited aspects of deprivation.<br />
*****<br />
CONCLUSION<br />
111
References<br />
References<br />
Acharya, S.S. and K. Ahuja (1998), Marketing Infrastructure for Livestock Development: a Study of Live<br />
Animal Markets of Rajasthan, Institute of of Development Studies, Jaipur.<br />
Agarwal, Bina (1994), "A Field of Her Own: Women and Land Rights in South Asia" Cambridge<br />
University Press.<br />
Agarwal, P.K. (2007), ‘Climate Change: Implications of Indian Agriculture’, Jalvigyan Sameeksha<br />
(Hydrology Review), Vol. 22.<br />
Ahuja, Kanta and Vidya Sagar (1987), Rural transformation in a developing economy, Kumar & Co.,<br />
Jaipur.<br />
Ahuja, Kanta, and M.S. Rathore (1987), Goats and Goatkeepers: A Socio-economic Study. Jaipur: Rupa.<br />
Black, R et al (2008), Maternal and Child Undernutrition: Global and Regional Exposures and Health<br />
Consequences, Lancet, Paper I, Maternal and Child Undernutrition, Lancet, p. 9.<br />
Chand, Ramesh (2007), ‘Demand for Foodgrains’, Economic and Political Weekly, 42 (52), December<br />
29 – January 4<br />
Chand, Ramesh and P Kumar (2006), ‘Country Case Study: India’, in Harmon Thomas (ed), Trade<br />
Reforms and Food Security, Food and Agriculture Organization of the United Nations, Rome.<br />
Chandrasekhar, C.P., Jayati Ghosh & Anamitra Roychowdhury (2006), ‘The Demographic Dividend and<br />
Young India’s Economic Future’, Economic and Political Weekly, 41 (49), December 9–15.<br />
Chaudhuri, Siladitya and Nivedita Gupta (2007), ‘Divergence in the Level of Living in Indian Districts –<br />
A Profile’, Paper Presented at the National Seminar on NSS 61st Round Survey Results, National Sample<br />
Survey Organization, New Delhi, 29-30th October.<br />
CSO (Various Years) 'Gross State Domestic Product', Central Statistical Organization, Government of<br />
India.<br />
De Haan, Arjan and Dubey, Amaresh (2005), 'Poverty Disparities or the Development of<br />
Underdevelopment in Orissa', in Economic and Political Weekly. May 28-June 4.<br />
Deolalikar, Anil B. (2001), The Spatial Distribution of Public Spending on Roads in Vietnam and its<br />
Implications, Asian Development Bank, Manila.<br />
Fan, S., P. Hazell and S. Thorat (1999), Linkages between Government Spending, Growth and Poverty<br />
in Rural India, International Food Policy Research Institute, Washington DC.<br />
Government of India (2007a), The Scheduled Tribes and Other Traditional Forest Dwellers (Recognition<br />
of Forest Rights) Act, 2006, The Gazette of India, January 2.<br />
112 FOOD SECURITY ATLAS OF RURAL RAJASTHAN
—— (2007b), National Food Security Mission: Operational Guidelines, Department of Agriculture and<br />
Cooperation, Ministry of Agriculture, August.<br />
Gujja, Biksham and Hajara Shaik (2005), ‘A Decade for Action: Water for Life’, Economic and Political<br />
Weekly, 40 (12), March 19.<br />
Gupta, Monika Das (2005), ‘Public Health in India: Dangerous Neglect’, Economic and Political Weekly,<br />
40 (49), December 3.<br />
Gupta, Nivedita and Buddhadeb Ghosh (2007), ‘Horizontal Rift verses Vertical Mobility of People across<br />
Different Expenditure Classes in Indian States in Recent Period’, Paper Presented in the National<br />
Seminar on NSS 61st Round Survey Results, National Sample Survey Organization, 29-30th October.<br />
IPCC (2007), Climate Change Impacts, Adaptation and Vulnerability, Summary for Policymakers,<br />
Intergovernmental Panel on Climatic Change.<br />
Jacoby, H. (2000), ‘Access to Rural Markets and the Benefits of Rural Roads,’ The Economic Journal,<br />
No. 110, pp. 713–37.<br />
Jena, Manipadma (2008), ‘Food Insecurity Among Tribal Communities of Orissa’, Economic and Political<br />
Weekly, February 9.<br />
Krishnan, Rekha, Suruchi Bhadwal , Akram Javed , Shaleen Singhal , S Sreekesh (2003), ‘Water Stress<br />
in Indian Villages’, Economic and Political Weekly, 38 (37), September 13.<br />
Leipziger, D., M. Fay, Q. Wodon and T. Yepes (2003), Achieving the Millennium Development Goals:<br />
The Role of Infrastructure’, World Bank Policy Research Working Paper 3163, World Bank, Washington<br />
DC.<br />
Mooij, Jos (2001), 'Food and Power in Bihar and Jharkhand: PDS and its Functioning,' in Economic<br />
and Political Weekly, August 25.<br />
NCEUS (2007), (National Commission for Enterprises in the Unorganized Sector), 2007, Report on<br />
Conditions of Work and Promotion of Livelihoods in the Unorganized Sector, New Delhi.<br />
NFHS III (2007), 'National Family Health Survey III, 2005-06', Volume I, International Institute for<br />
Population Sciences, Mumbai.<br />
Save the Children (2006), State of World’s Mothers 2006: Saving the Lives of Mothers and Newborns,<br />
Save the Children.<br />
Save the Children (2008), Saving Children’s Lives: Why Equity Matters, Save the Children, London<br />
Sen, Amartya (1981), Poverty and Famines: An Essay on Entitlement and Deprivation, Oxford: Clarendon<br />
Press.<br />
REFERENCES<br />
113
Singh, Dalbir, (2004), “Livelihood Concerns in Water Resources Management Regimes in Scarce<br />
Conditions,” in Indian Journal of Agricultural Economics, Vol. 59, No.1.<br />
—— (2007), “Groundwater Markets in Scarce Regions: Who Gains and Who Looses” paper submitted<br />
for publication, Agricultural Economics Research Review, Vol. 20 No. 2.<br />
Singh, Manju (1999), Comparative Study on Enrolment and Retention of Primary School Under Different<br />
Primary Education Schemes in Rajasthan.<br />
Singh, Surjit and Kumar Krishan (2008), Rajsthan and MDGs: Status and Progress at Half Way Mark,<br />
Srivastava, Ravi and S. K. Sasikumar (2003), An Overview of Migration in India, its Impacts and Key<br />
Issues, Refugee and Migratory Movements Research Unit, University of Dhaka and Department of<br />
International Development.<br />
Srivastava, N. (2006), 'Innovative Interventions: The Food for Work Project in the Chhattisgarh Tribal<br />
Development Programme' in Srivastava, N. and Sharma (eds), Protecting the Vulnerable Poor in India:<br />
The Role of Food Safety Nets, World Food Programme, New delhi.<br />
UNICEF (2005), UNICEF Joint Health and Nutrition Strategy for 2006-2015 (E/ICEF/2006/8), UN<br />
Economic and Social Council, New York, November 15, pp. 3–4.<br />
—— (2006), Countdown to 2015, Tracking Progress in Child Survival: The 2005 Report, Health Section,<br />
United Nations Children’s Fund, New York.<br />
—— (2007a), The State of the World’s Children 2007: Women and children – The Double Dividend of<br />
Gender Equality, United Nations Children’s Fund, New York, December, pp. 137, 141.<br />
—— (2007b), The State of the World’s Children 2008: Child Survival, United Nations Children’s Fund,<br />
New York, December.<br />
—— (2007c), Progress for Children: A World Fit for Children, Statistical Review.<br />
—— & WHO (2006), Pneumonia: The forgotten killer of children, United Nations Children’s Fund and<br />
World Health Organization, New York and Geneva, p. 5.<br />
Vyas, V.S. (2005), Water in Rajasthan: Report of the Expert Committee on Integrated Development and<br />
Management of Water Resource, Jaipur.<br />
WHO (2007), Health Status:Mortality, World Health Statistics 2006, World Health Organization, Geneva,<br />
pp. 29-31.<br />
World Bank, 2006, Rajasthan: Reducing the Development Gap, World Bank, New Delhi.<br />
World Development Report (2008), The World Bank, Washington, DC.<br />
114 FOOD SECURITY ATLAS OF RURAL RAJASTHAN
Appendix I: The Right to Food<br />
Appendix I: The Right to Food<br />
Along with the change in understanding of the meaning of food security, there has been much<br />
discussion on whether there is a right to food. The kind of economic growth that the world has been<br />
undergoing has not automatically ‘trickled down’ in benefits to all. Even a reasonably high rate of<br />
growth, like India’s 6 per cent or so over the period 1995-2004, has not brought about a commensurate<br />
reduction in the proportion of those who are undernourished. The existence or acceptance of a right<br />
to food would make the exertion of pressure to adopt and implement a policy that secures this right<br />
more likely. But is there a right to food?<br />
The right to food or ‘freedom from hunger’ figures in the Universal Declaration of Human Rights (1948).<br />
Subsequently the UN General Assembly adopted two covenants in 1966, one on Civil and Political<br />
Rights and the other on Economic, Social and Cultural Rights. Besides these covenants, the<br />
Convention on the Rights of the Child and the Convention on the Elimination of All Forms of<br />
Discrimination Against Women (CEDAW) both considerably strengthened the place of the right to<br />
food and adequate nutrition in international law on human rights.<br />
A two-fold distinction is often made between the civil and political rights, on the one hand, and<br />
economic, social and cultural rights, on the other (Eide 1999). The first set is said to be ‘absolute’,<br />
and ‘immediate’, while the second set is considered something relative and to be realized gradually,<br />
over time. In a sense this distinction coincides with the Indian constitution’s distinction between its<br />
‘core’ provisions, which are to be realized immediately, and its ‘Directive Principles of State Policy’,<br />
which are programmatic and to be realized over time.<br />
It can well be argued that the civil and political rights are also something that can only be realized<br />
over time. Merely putting them into the statute books does not result in their being realized. On the<br />
other side, if civil and political rights are held to be the foundation of democracy, one can as well<br />
argue that economic and social rights are equally important to democracy. Without economic rights,<br />
and not just the right to property, political democracy itself would be a mere shell. The realization of<br />
political and economic rights is inter-twined and one set does not have any a priori precedence over<br />
the other.<br />
A related distinction is between rights that are respected through non-interference and those that<br />
require resources to be realized. The first is like the freedom of religion, or of association, while the<br />
right to food would require resources to be realized. Jean Zigler, the UN Special Rapporteur on the<br />
Right to Food, questioned the whole distinction between those freedoms that require resources to<br />
be realized and those freedoms that do not. The whole machinery of the state, of administration,<br />
police, courts, etc. all need to set up, and involve costs, to enable citizens to realize the freedom to<br />
religion, or freedom of association, and associated rights. ‘Even implementing civil and political rights<br />
does in fact imply resources. The cost of setting up and training the police force, military and judiciary<br />
to implement international human rights law is not insignificant.’ (Jean Zigler, 2002, quoted in FAO,<br />
WFS-fyl, Focus on Issues, What is the right to food? www.fao.org)<br />
APPENDIX I<br />
115
Thus, rights require state action with regard to the obligations to respect, protect and fulfil them.(Shue,<br />
1980 in Gaiha 2003), which require setting up of administrative, police, and judicial structures to enable<br />
rights to be realized. Consequently all rights have a cost in their being realized. And the costs of the<br />
right to food may not be as much as they seem, since it is only in certain circumstances that it involves<br />
state provision of food (Gaiha, 2003, 4270).<br />
What the acceptance of the right to food does is to focus attention on the necessity of economic and<br />
social policy paying attention to the poorest and most marginal. It also takes the debate on rights<br />
inside the ‘private sphere’ to raise the question of women’s rights in assuring food to themselves and<br />
their children and families. ‘The “right to adequate food” may be as much a question of the full realization<br />
of the rights of women as of ensuring a bundle of nutrients handed over through food supplement<br />
schemes.’ (Asbjorn Eide, 1999, ‘The right to adequate food and to be free from hunger,’ Study on the<br />
Right to Food submitted to the ECOSOC, Commission on Human Rights, 28 June, United Nations,<br />
New York, (www.unhchr.ch)<br />
Right to Food in India<br />
Earlier, we looked at the status of the right to food and its embodiment in various international<br />
covenants. Food policies, however, are critically formulated and implemented at the level of the national<br />
state. It is, perhaps, only in the case of ‘failed states’ that the international covenants can themselves<br />
be the basis for action by international agencies. For the most part, and certainly in India, it is through<br />
the national state that actions on the right to food are carried out. Of course, this does not mean that<br />
some actions cannot be carried out at the international level, as, for instance, by groups representing<br />
women or indigenous peoples taking their case for redressal of grievances to their respective<br />
international forums in the manner that trade unions also take their case to the ILO.<br />
The establishment of a ‘right to food’ in India was substantially carried forward by the April 2001 petition<br />
of the People’s Union for Civil Liberties (PUCL), Rajasthan, (PUCL vs Union of India and Others, Writ<br />
Petition (Civil) 196 of 2001) and the orders of the Supreme Court of India in response to this and<br />
subsequent petitions. In the context of the then-prevailing drought in Rajasthan, the argument of the<br />
PUCL 1 was simple – that Article 21 of the Constitution of India guarantees the ‘right to life’ and imposes<br />
on the state the duty to protect this right to life. In elaborating the right to life, the Supreme Court in<br />
past decisions had held that this right also includes the right to live with dignity and all that goes to<br />
make this up, including the right to food.<br />
The petition argued that in the context of the drought in Rajasthan, the actions or inactions of the<br />
Governments of India and of the State of Rajasthan, constituted a violation of this right to food and,<br />
thus, of the right to life. Specifically, the violation of the right to food was seen in two aspects. First,<br />
1. This account of the PUCL’s petition and related matters is based on Legal Action for the Right to Food: Supreme Court Orders and Related Documents,<br />
January 2004, downloaded from www.righttofood.org now replaced by the website www.righttofoodindia.org.<br />
116 FOOD SECURITY ATLAS OF RURAL RAJASTHAN
was the failure of the Public Distribution System (PDS), in terms of the exclusion of various Below<br />
Poverty Line (BPL) households from its scope. Second, was the inadequacy of the quantities delivered<br />
through the PDS as the monthly quota could not meet the household’s nutritional standards set by<br />
the Indian Council of Medical Research (ICMR).<br />
The PUCL petition also pointed to the inadequacy of government relief works in the Rajasthan drought<br />
condition. Thus, it linked the right to access relief works in a drought condition as part of the meaning<br />
of the right to food. As the Supreme Court pointed out in a later order, while agreeing with the High-<br />
Level Committee on Long-Term Grain Policy (Abhijit Sen Committee), employment generation should<br />
be distinct from food delivery: ‘This should not, however, undermine the importance of employment<br />
and income generation in eliminating hunger and malnutrition’ (Supreme Court Order of 2 May 2003).<br />
The different orders of the Supreme Court:<br />
l<br />
l<br />
l<br />
l<br />
l<br />
l<br />
l<br />
l<br />
l<br />
Established a Constitutional basis for the right to food in terms of the right to life;<br />
Drew attention to the serious plight of the aged, destitute, etc;<br />
Stated that where the hungry are not able to buy grain, even at the subsidized price, the relevant<br />
governments should consider giving them the grain free;<br />
Pointed out that ‘Plenty of food is available, but distribution of the same amongst the very<br />
poor and destitute is scarce and non-existent leading to mal-nourishment, starvation and other<br />
related problems’;<br />
Identified the various schemes to operationalize the right to food;<br />
Changed the status of those who received food or income through these schemes from<br />
‘beneficiaries’ to ‘rights-holders’;<br />
Made the Government of India and the State governments responsible for securing the right<br />
to food through these schemes;<br />
Placed responsibility on specified government officials (Chief Secretary of the State<br />
Governments, District Magistrates) as being answerable for the implementation of the<br />
schemes that concretize the right to food, and thus being accountable for failures, like<br />
starvation deaths; and<br />
Established Food Commissioners who would report on and monitor implementation of<br />
schemes constituting the right to food.<br />
At the level of rights this is a reasonably comprehensive scheme with rights, ways of achieving them,<br />
responsibilities for achieving them, all fairly well specified. Given the fact that there is a clear<br />
APPENDIX I<br />
117
perpetuation of both endemic starvation and frequent bouts of acute starvation, it is necessary to<br />
see how to link food security measures with development. Rights are critical in establishing the<br />
obligation of the state to provide a means of realizing those rights. But the measures that realize the<br />
right to food also need to be connected and contribute to development objectives, such as to improve<br />
productive capacities of small and marginal farmers, increase employment opportunities for<br />
agricultural labour, and empower women so as to increase the access to food through their normal<br />
economic activities. Measures relating to the above have all been discussed in various sections of<br />
this report. They need to be drawn together into a comprehensive package.<br />
118 FOOD SECURITY ATLAS OF RURAL RAJASTHAN
Appendix II: Food Security Index (FSI) - A Methodological Note<br />
Appendix II: Food Security Index (FSI) – A Methodological Note<br />
At the outset we must state that the Food Security Index is calculated for rural areas only. All variables<br />
constructed in this section are for rural areas, unless otherwise specified.<br />
Here we have attempted to construct a Food Security Index (FSI) at the sub-state level, that is, the<br />
district level. The district having a higher index value is considered as relatively more food secure as<br />
compared to a district with a lower index value.<br />
Broadly, we have adopted Max-Min (range equalization method, REM) approach, adopted by UNDP<br />
(HDR 2005); and Principal Component Analysis (PCA). One of the objectives of the district FSI is to<br />
show the district’s position in various dimensions of food security.<br />
The FSI is a composite index covering three dimensions, i.e., Availability factors, Access factors, and<br />
Absorption factors. Besides these three groups of factors, an additional component i.e. public entitlement<br />
has been used to explain how this influences food security. But the public entitlement factor is not<br />
included in the indices of food security. The public entitlement policy is based on various parameters<br />
which are supposed to be directly linked with food insecurity; the lower the level of food security, the<br />
greater should be public intervention. In such a scenario, the direction of public interventions should<br />
run counter to the FSI, though it need not be so.<br />
For each of the dimensions, as discussed earlier, some relevant variables have been chosen.<br />
Table A 2.1: Choice of Indicators, Sources, Reference Year and Calculating Procedure in Rajasthan<br />
Name of Variable and Description Sources Reference Year<br />
(a) Availability<br />
1. Proportion of net irrigated area to net sown area Agricultural Statistics 2003-04<br />
of Rajasthan, 2003-04<br />
2. Per capita value of agricultural output Department of 2002-03 to<br />
In order to take account of the cyclical nature of Agriculture, 2004-05<br />
agricultural production the variable uses an average of Government of<br />
three to five years depending on the availability of data. Rajasthan<br />
The value of each food and non-food item is derived by http://rajasthankrishi.<br />
multiplying the amount of production with its price gov.in/Departments/<br />
obtained from all-India prices of these items at constant Agriculture/main.asp<br />
1993-94 prices. Adding the value of each and every food ?t= statics_top.htm<br />
and non-food item, gives the overall value of agricultural &p=statics_index_<br />
output for a year. The per capita value of agricultural new.htm<br />
output is calculated by dividing the average value of<br />
agricultural output by total population in the midpoint year.<br />
APPENDIX II<br />
119
Name of Variable and Description Sources Ref. Year<br />
3. Percentage of inhabited villages having access to paved Census of India, 2001<br />
roads. This is calculated as a share of total number of 2001<br />
villages in the district<br />
4. Percentage of forest area to total geographical Area Department of Forest, 2003<br />
Government of<br />
Rajasthan<br />
(b) Access<br />
1. Percentage of agricultural labour to total workers. Census of India, 2001<br />
Agricultural labour comprises both main and marginal 2001<br />
workers*<br />
2. Proportion of ST and SC population to total population* Census of India, 2001<br />
3. Dependency ratio Census of India, 2001<br />
This is calculated as rural population in the age group<br />
(15-59) divided by the sum of the (0-14) child population<br />
and 59+ population.<br />
4. Per capita monthly consumption expenditure 61st NSS round 2004-05<br />
(inequality adjusted)<br />
The formula for inequality adjusted monthly per capita<br />
consumption expenditure (MPCE) is: MPCE*(1-Gini).<br />
5. Rural casual wage rate. This is calculated as average 61st NSS round 2004-05<br />
daily wage rate for the age group 15-59<br />
6. Women’s literacy rate (7+) Census of India, 2001<br />
Total female literate as a proportion of total female<br />
population for the 7 years and above.<br />
(c) Utilization<br />
1. Percentage of households having access to safe Census of India 2001<br />
drinking water. Here rural households with access 2001<br />
to three sources of drinking water, such as tube well,<br />
tap and hand pump have been considered.<br />
2. Percentage of inhabited villages having access to PHC Census of India, 2001<br />
PHC facility within the village or within 5 km 2001<br />
from the villages)<br />
(d) Public Entitlement<br />
1. Percentage of ICDS beneficiaries to total project population Department of 2006<br />
Here we have taken only the SNP (supplementary nutrition Women and Child<br />
programme) beneficiaries. To find out the value of this Development,<br />
variable we have divided the SNP beneficiaries (pregnant Government of<br />
and lactating women and child (0-6) age group) by total Rajasthan<br />
population covered by the project.<br />
*The direction of these variables has been reversed to have a positive association with food security.<br />
120 FOOD SECURITY ATLAS OF RURAL RAJASTHAN
Max-Min Approach<br />
Using the Max-Min approach an index has been constructed for each variable. This is calculated by<br />
applying the following general Range Equalization Method (REM) formula adopted by the UNDP:<br />
(Xi -min X)<br />
Variable Index =<br />
(Max X -Min X)<br />
where Xi- Value of the variable<br />
min X- Minimum value of X in the scaling<br />
max X- Maximum value of X in the scaling<br />
In undertaking the scaling procedure, desirable norms have been adopted for each indicator. In some<br />
cases, the scaling of indicators is self-selecting, and for some others there is an element of value<br />
judgment.<br />
The details of normative values used are given in Appendix III.<br />
Construction of Food Security Index<br />
Different indicators included in the three components of the FSI have been scaled and normalized (to<br />
make them unidirectional) to take a value on a scale ranging from 0 to 1. The scaled least achievement<br />
corresponds to zero, whereas the best achievement corresponds to 1. For three selected variables,<br />
viz., percentage of agricultural labour to all labour and proportion of ST and SC population and<br />
percentage of forest area to total geographical area, we have used the reverse figure (per cent of nonagricultural<br />
labour to total workers; per cent of non-ST & SC to total population; and per cent of nonforest<br />
area to total area). Likewise, the variable dependency ratio has also been reversed.<br />
After calculating the index of each variable, we have averaged them to give each of the three dimensions<br />
of food security. The composite Food Security Index is again derived by averaging all the selected<br />
indicators.<br />
Principal Component Analysis (PCA)<br />
The PCA is a data reduction technique. Sometimes there is a high correlation between variables. In<br />
such cases, it is useful to transform the original data set into a new set of uncorrelated variables called<br />
principal components. It is quite likely that the first few components account for most of the variability<br />
in the original data set. The PCA can be applied either to the original values of variables or to the<br />
normalized values of the variables. In general, normalization can be done by three methods, i.e., by<br />
deviation of the variables from their respective means (i.e., X X ); by dividing the actual values by<br />
APPENDIX II<br />
121
their respective means (i.e., X / X ) and by the deviation of the value of a variable from the mean which<br />
is then divided by standard deviation {i.e., ( X X )/σ }. We have applied the second method. The basic<br />
objective of using PCA is to find the factor loading of each and every variable. Factor loading gives us<br />
the amount of total variation explained by a particular variable.<br />
We have used PCA in the Food Security Index for those states where the correlation between indices<br />
derived through the RE method and PCA method is highly correlated.<br />
Food Security Outcome (FSO)<br />
To crosscheck the validity of the Food Security Index for the three AAA (Availability, Access and<br />
Absorption) components, we have used the Food Security Outcome (FSO) index. The nutritional status<br />
of an individual can be considered as the outcome of food security. Though intake of food is not the<br />
only factor that affects nutritional status, it is definitely the prime one. The outcome index calculated<br />
here is based on two child-related variables: child mortality rate (CMR) and child malnutrition (weight<br />
for age -2SD). Child malnutrition - 2SD includes children who are below -3SD from the International<br />
Reference Population median. The district-wise figure relating to the above two variables are taken from<br />
the Reproductive and Child Health (RCH) 2002 Survey.<br />
The food security outcome (FSO) against which the input variables are considered here as explanatory<br />
indicators should ideally be a composition of morbidity, mortality and under-nutrition among the entire<br />
rural population, which includes adults. However, due to inadequacy of data on adults, especially at<br />
the district-level, we have resorted to using the child-related variables to construct the FSO. In order to<br />
validate the use of this, we have undertaken a simple correlation exercise at the state level between<br />
the Body Mass Index (BMI) for adults and the FSO.<br />
The State-level Body Mass Index for men and women has been used from NFHS III. The NFHS calculates<br />
BMI as weight in kilograms divided by the square of height in meters and the resulting value is again<br />
divided by the number of men/women in the 15–49 age group. Here we have taken the number of men<br />
and women with BMI below 17.0 which tells us the number of men /women moderately and severely<br />
thin. The composite adult BMI has been calculated by aggregation of BMI for men and women using<br />
the population share of men and women in the sample as weights.<br />
We have calculated the state-level Food Security Outcome index (for 29 states) from DLHS and NFHS<br />
child-related variables (the same two variables taken for the district-level FSO). We have adopted the<br />
RE method for finding out the state-level FSO. The correlation among the DLHS and NFHS child-related<br />
indicators as well as NFHS-based BMI adult indicators shows a very high correlation across 29 states,<br />
thereby justifying the use of the child FSO as the outcome measure. However, it can be argued that<br />
inter-district variations within different states can be quite dissimilar.<br />
122 FOOD SECURITY ATLAS OF RURAL RAJASTHAN
Grouping of Districts<br />
For each variable, component and index, districts have been divided into five classes: Secure to<br />
Moderately Secure, Moderately Insecure, Severely Insecure and Extremely Insecure. The method used<br />
for making class intervals is the ‘equal intervals’ method, i.e. the difference between all upper and lower<br />
class intervals for an indicator is the same. This method takes into account the range of the indicator’s<br />
values and divides the range into five equal classes. The number of districts in different classes can be<br />
different.<br />
APPENDIX II<br />
123
Appendix III: Index Value, Normative Value and Key Food Security Intervention<br />
Appendix III: Index Value, Normative Value and Key Food Security Intervention<br />
District<br />
Table A3.1:<br />
Index Values and Normative Value of Availability Variables<br />
% Net Irrigated Area to<br />
Net Sown Area<br />
Per Capita Value of<br />
Agricultural output<br />
Paved Road<br />
Ajmer 0.126 0.080 0.745<br />
Alwar 0.876 0.267 0.776<br />
Banswara 0.329 0.100 0.524<br />
Baran 0.810 0.553 0.397<br />
Barmer 0.058 0.047 0.489<br />
Bharatpur 0.753 0.320 0.725<br />
Bhilwara 0.224 0.121 0.451<br />
Bikaner 0.099 0.188 0.787<br />
Bundi 0.686 0.372 0.493<br />
Chittaurgarh 0.287 0.289 0.431<br />
Churu 0.040 0.114 0.737<br />
Dausa 0.717 0.207 0.590<br />
Dhaulpur 0.662 0.250 0.668<br />
Dungarpur 0.266 0.045 0.648<br />
Ganganagar 0.706 0.538 0.815<br />
Hanumangarh 0.382 0.393 0.786<br />
Jaipur 0.470 0.214 0.679<br />
Jaisalmer 0.080 0.131 0.567<br />
Jalor 0.310 0.154 0.766<br />
Jhalawar 0.521 0.389 0.244<br />
Jhunjhunu 0.505 0.210 0.825<br />
Jodhpur 0.101 0.135 0.742<br />
Karauli 0.545 0.228 0.714<br />
Kota 0.789 0.613 0.606<br />
Nagaur 0.198 0.178 0.660<br />
Pali 0.158 0.081 0.798<br />
Rajsamand 0.097 0.022 0.581<br />
Sawai Madhopur 0.579 0.251 0.481<br />
Sikar 0.415 0.158 0.707<br />
Sirohi 0.388 0.056 0.758<br />
Tonk 0.279 0.283 0.450<br />
Udaipur 0.182 0.058 0.469<br />
Lowest Range 0 200 10<br />
Highest Range 100 7000 80<br />
124 Food Security Atlas of Rural RAJASTHAN
District<br />
Table A3.2:<br />
Index Values and Normative Value of Access Variables<br />
% Other than<br />
agricultural<br />
labourer to all<br />
% of non<br />
(SC+ST)<br />
population<br />
Ratio of<br />
Working<br />
labourers to total Population Expenditure Rate<br />
Ajmer 0.718 0.808 0.267 0.478 0.263 0.323<br />
Alwar 0.809 0.727 0.223 0.574 0.301 0.408<br />
Banswara 0.785 0.189 0.257 0.342 0.219 0.206<br />
Baran 0.429 0.577 0.262 0.463 0.240 0.395<br />
Barmer 0.905 0.778 0.204 0.452 0.343 0.458<br />
Bharatpur 0.714 0.762 0.198 0.492 0.341 0.415<br />
Bhilwara 0.838 0.731 0.302 0.486 0.262 0.231<br />
Bikaner 0.856 0.753 0.207 0.428 0.329 0.263<br />
Bundi 0.700 0.579 0.283 0.514 0.339 0.321<br />
Chittaurgarh 0.772 0.610 0.345 0.514 0.239 0.285<br />
Churu 0.901 0.752 0.214 0.428 0.356 0.585<br />
Dausa 0.861 0.491 0.223 0.423 0.324 0.429<br />
Dhaulpur 0.841 0.734 0.171 0.503 0.376 0.413<br />
Dungarpur 0.669 0.276 0.258 0.342 0.247 0.269<br />
Ganganagar 0.442 0.614 0.332 0.477 0.340 0.531<br />
Hanumangarh 0.646 0.711 0.324 0.433 0.477 0.518<br />
Jaipur 0.858 0.714 0.242 0.498 0.368 0.484<br />
Jaisalmer 0.819 0.790 0.214 0.452 0.389 0.247<br />
Jalor 0.770 0.730 0.192 0.445 0.388 0.231<br />
Jhalawar 0.541 0.707 0.298 0.463 0.310 0.361<br />
Jhunjhunu 0.841 0.814 0.264 0.656 0.558 0.704<br />
Jodhpur 0.745 0.793 0.198 0.413 0.320 0.211<br />
Karauli 0.781 0.507 0.207 0.503 0.310 0.468<br />
Kota 0.484 0.621 0.300 0.463 0.397 0.569<br />
Nagaur 0.770 0.785 0.247 0.406 0.302 0.384<br />
Pali 0.540 0.749 0.228 0.378 0.300 0.309<br />
Rajsamand 0.706 0.732 0.276 0.439 0.301 0.329<br />
Sawai Madhopur 0.815 0.540 0.257 0.503 0.370 0.279<br />
Sikar 0.869 0.812 0.235 0.495 0.369 0.647<br />
Sirohi 0.588 0.526 0.249 0.378 0.248 0.304<br />
Tonk 0.762 0.649 0.272 0.478 0.283 0.224<br />
Udaipur 0.751 0.374 0.273 0.439 0.265 0.359<br />
Lowest Range 50 0 0.6 150 20 10<br />
Highest Range 100 100 2.5 800 150 80<br />
Age<br />
Monthly<br />
Per Capita<br />
Consumption<br />
Rural<br />
Casual<br />
Wage<br />
Rural<br />
Female<br />
Literacy<br />
Appendix II<br />
125
District<br />
Table A3.3:<br />
Index Values and Normative Value of Absorption Variables<br />
% HH Access<br />
to safe drinking<br />
water<br />
PHCs District % HH Access<br />
to safe drinking<br />
water<br />
PHCs<br />
Ajmer 0.602 0.285 Jaisalmer 0.394 0.061<br />
Alwar 0.542 0.264 Jalor 0.422 0.253<br />
Banswara 0.637 0.492 Jhalawar 0.580 0.321<br />
Baran 0.806 0.142 Jhunjhunu 0.685 0.448<br />
Barmer 0.325 0.126 Jodhpur 0.624 0.195<br />
Bharatpur 0.164 0.313 Karauli 0.343 0.172<br />
Bhilwara 0.644 0.284 Kota 0.894 0.247<br />
Bikaner 0.389 0.095 Nagaur 0.418 0.261<br />
Bundi 0.827 0.208 Pali 0.483 0.263<br />
Chittaurgarh 0.834 0.335 Rajsamand 0.651 0.283<br />
Churu 0.461 0.190 Sawai Madhopur 0.456 0.206<br />
Dausa 0.473 0.280 Sikar 0.615 0.307<br />
Dhaulpur 0.420 0.389 Sirohi 0.718 0.351<br />
Dungarpur 0.684 0.472 Tonk 0.495 0.249<br />
Ganganagar 0.647 0.216 Udaipur 0.608 0.360<br />
Hanumangarh 0.624 0.189 Lowest Range 10 2<br />
Jaipur 0.559 0.331 Highest Range 100 70<br />
126 Food Security Atlas of Rural RAJASTHAN
NSS Regions<br />
District<br />
Table A3.4:<br />
Key Food Security Interventions inDistricts of Rajasthan<br />
Irrigation Extent<br />
Per Capita Value of<br />
Agricultural Output<br />
Rural Connectivity<br />
Rural Casual Wage Rate<br />
Average Monthly<br />
Per Capita Expenditure<br />
Agricultural Labourers<br />
Proportion of<br />
SCs and STs<br />
Ratio of Working Age<br />
Group Population<br />
Rural Female Literacy<br />
Access to Safe<br />
Drinking Water<br />
Access to Primary<br />
Health Centres<br />
Ajmer √ √ √ √ 4<br />
Alwar √ √ 2<br />
Bharatpur √ √ √ 3<br />
Bhilwara √ √ √ √ √ 5<br />
Dausa √ √ √ √ 4<br />
Dhaulpur √ √ √ 3<br />
North Eastern Jaipur √ √ 2<br />
Jhunjhunu √ 1<br />
Karauli √ √ √ √ √ 5<br />
Sawai Madhopur √ √ √ √ 4<br />
Sikar √ √ 2<br />
Tonk √ √ √ √ 4<br />
Baran √ √ √ √ √ √ 6<br />
Bundi √ √ √ 3<br />
South Eastern Chittaurgarh √ √ √ √ 4<br />
Jhalawar √ √ √ √ √ 5<br />
Kota √ √ 2<br />
Southern Banswara √ √ √ √ √ √ 6<br />
Dungarpur √ √ √ √ √ √ 6<br />
Rajsamand √ √ √ √ √ 5<br />
Udaipur √ √ √ √ √ √ √ 7<br />
No. of Indicators<br />
Appendix II<br />
127
The Food Security Atlas of Rural Rajasthan is part of the<br />
series of eight Atlases produced by the Institute for Human<br />
Development (IHD) and the UN World Food Programme<br />
(WFP). The other states covered in this series are: Bihar,<br />
Chhattisgarh, Jharkhand, Madhya Pradesh, Maharashtra,<br />
Orissa and Uttar Pradesh. The Atlases carry out a district-level<br />
analysis of food security for each of these states.<br />
The purpose of the Atlas is to identify regions and districts<br />
within the state that require priority attention in order to<br />
improve their food security status. This is followed by an<br />
identification of the characteristics that differentiate the<br />
better-off from the worse-off districts. These characteristics<br />
of food insecure regions and districts are used to put forward<br />
a set of recommended interventions that could be expected<br />
to improve food security.<br />
It is hoped that the Atlas will stimulate further analysis, action<br />
and advocacy for reducing the incidence of hunger.<br />
World Food<br />
Programme<br />
The UN World Food Programme (WFP)<br />
2 Poorvi Marg, Vasant Vihar<br />
New Delhi 110057<br />
www.wfp.org