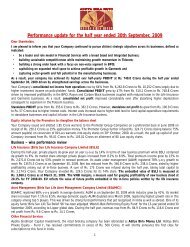
Performance update for the half year ended 30 September 2008
Performance update for the half year ended 30 September 2008
Performance update for the half year ended 30 September 2008

You also want an ePaper? Increase the reach of your titles
YUMPU automatically turns print PDFs into web optimized ePapers that Google loves.
Dear Shareholders,<br />
I am pleased to in<strong>for</strong>m you that your Company continued to work on its defined strategy of building a strong<br />
foundation <strong>for</strong> all <strong>the</strong> businesses which includes<br />
<br />
<br />
<br />
<br />
achieving pan India presence in <strong>the</strong> Telecom business;<br />
enhancing market share through expansion of customer reach and augmenting its portfolio in <strong>the</strong> Financial<br />
Services business;<br />
trans<strong>for</strong>mation from a wholesale garment company to a “High-end apparel retailing” company through continued<br />
expansion of retail space and<br />
improving operating efficiency through full utilisation of existing capacity and partnering with new customers<br />
through cost effective sites and locations in <strong>the</strong> BPO business.<br />
As a result, while your company has grown in revenues as per plan, <strong>the</strong> consolidated profitability does not truly reflect<br />
<strong>the</strong> results of <strong>the</strong> investments and ef<strong>for</strong>ts made due to<br />
a) The gestating impact of <strong>the</strong> aggressive growth initiatives bunched toge<strong>the</strong>r and<br />
b) The nature of Life Insurance business where new business premium, though profitable in <strong>the</strong> long run, causes<br />
strain in <strong>the</strong> first <strong>year</strong> due to <strong>the</strong> accounting procedure of amortising all expenses in <strong>the</strong> first <strong>year</strong> itself.<br />
Revenues on growth path<br />
Your Company’s standalone revenues, during <strong>the</strong> <strong>half</strong>-<strong>year</strong> <strong>ended</strong> <strong>30</strong>th <strong>September</strong> <strong>2008</strong>, grew by 42% from Rs. 1,701.5<br />
Crores to Rs. 2,415.6 Crores, largely driven by higher volumes and better realisation in <strong>the</strong> Fertilisers and <strong>the</strong> Carbon<br />
Black businesses.<br />
Your Company’s consolidated revenues rose by 37% from Rs. 4,979.7 Crores to Rs. 6,822.5 Crores. The growth<br />
businesses contributed 72% of <strong>the</strong> consolidated revenues led by Life Insurance (28% share), Telecom (20%), BPO (13%)<br />
and Garments (8%).<br />
Standalone Results<br />
Consolidated Results<br />
Half Year <strong>ended</strong> <strong>30</strong>th <strong>September</strong> Particulats Half Year <strong>ended</strong> <strong>30</strong>th <strong>September</strong><br />
<strong>2008</strong> 2007 Growth % <strong>2008</strong> 2007 Growth %<br />
2,415.6 1,701.5 42% Net income from Operations 6,822.5 4,979.7 37%<br />
344.0 281.8 22% Operating Profit (PBDIT) 482.2 595.3 -19%<br />
106.9 88.6 21% Net Profit/(Loss) after Monority Interest (132.9) 142.5 -193%<br />
Investment phase of growth businesses had gestating impact on consolidated profitability<br />
Standalone net profit, during <strong>the</strong> <strong>half</strong>-<strong>year</strong>, surged by 21% from Rs. 88.6 Crores to Rs. 106.9 Crores. At <strong>the</strong><br />
consolidated level, your Company has reported a net loss of Rs. 132.9 Crores against net profit of Rs. 142.5 Crores<br />
attained in <strong>the</strong> corresponding <strong>half</strong> of <strong>the</strong> preceding <strong>year</strong>. This was largely due to <strong>the</strong> growing share of new business<br />
premium and higher spends on expansion of distribution network in <strong>the</strong> Life Insurance business, which are its key<br />
growth drivers. The pre-launch expenses of stores in <strong>the</strong> apparel retail business, lower capacity utilisation in <strong>the</strong><br />
contract manufacturing business and <strong>the</strong> start up costs and brand building activities <strong>for</strong> Mumbai circle in <strong>the</strong> Telecom<br />
business also impacted <strong>the</strong> consolidated profitability.<br />
2
Business-wise <strong>Per<strong>for</strong>mance</strong> review<br />
Telecom [Idea Cellular Limited]<br />
During <strong>the</strong> <strong>half</strong> <strong>year</strong>, <strong>the</strong> Telecom business registered a 47% rise in revenues at Rs. 4,472.7 Crores up from Rs. 3,039.5<br />
Crores attained in corresponding <strong>half</strong> of <strong>the</strong> previous <strong>year</strong>. Idea ranked 5th with 9.6% all India market share and <strong>30</strong>.38<br />
million subscribers (excluding Spice) as on <strong>30</strong>th <strong>September</strong> <strong>2008</strong>. In 8 established operating circles, Idea ranks 2 nd with<br />
19.6% market share which reflects its brand strength. After <strong>the</strong> launch of operations in Mumbai and Bihar (including<br />
Jharkhand) circles and acquisition of controlling stake in Spice that operates in Punjab and Karnataka circles, Idea is now<br />
operational in 15 circles. With <strong>the</strong> planned launch of services in Tamil Nadu (including Chennai) and Orissa circles by<br />
<strong>the</strong> financial <strong>year</strong> end, Idea’s footprint will cover approximately 90% of India’s telephony potential.<br />
Idea has received Rs. 72.9 billion through <strong>the</strong> sale of 14.99% stake to TM International at Rs. 156.96 per share.<br />
Consequently, Nuvo’s stake in Idea now stands at 27.02%. Idea’s subsidiary Aditya Birla Telecom (ABTL) has also received<br />
clearance from <strong>the</strong> Foreign Investment Promotion Board (FIPB) to sell 20% stake to Providence <strong>for</strong> USD 640 million.<br />
ABTL has license to operate in Bihar & Jharkhand and will hold 16% stake in <strong>the</strong> proposed Indus towers Joint Venture<br />
(JV). After this deal, <strong>the</strong> financial position and leveraging capacity of Idea will fur<strong>the</strong>r streng<strong>the</strong>n. Cash inflows from <strong>the</strong>se<br />
deals will be used to fund capex requirements <strong>for</strong> existing and new circles as well as <strong>for</strong> bidding <strong>for</strong> <strong>the</strong> 3G spectrum.<br />
Idea, during <strong>the</strong> <strong>half</strong> <strong>year</strong>, reported lower net profit at Rs. 407.2 Crores vis-à-vis Rs. 528.9 Crores. The start up costs <strong>for</strong><br />
Mumbai circle coupled with higher interest costs <strong>for</strong> new acquisition impacted <strong>the</strong> profitability.<br />
Going <strong>for</strong>ward, <strong>the</strong> business is expected to benefit from its strong cash position, new roll outs and <strong>the</strong> Spice acquisition.<br />
Life Insurance [Birla Sun Life Insurance Company Limited (BSLI)]<br />
The Life Insurance business, during April to August <strong>2008</strong> <strong>for</strong> which <strong>the</strong> latest industry data is available, achieved 121%<br />
growth in new business premium income, compared to 56% growth attained by private players and ranked 5th with a<br />
market share of 8.15%. Revenues, during <strong>the</strong> <strong>half</strong> <strong>year</strong>, grew from Rs. 1,356.6 Crores to Rs. 1,895.3 Crores. BSLI has<br />
added 261 new distribution centres during <strong>the</strong> <strong>half</strong> <strong>year</strong> itself to reach a total of 600 centres. Agency <strong>for</strong>ce has been<br />
expanded to more than 132,000 agents.<br />
BSLI, during <strong>the</strong> <strong>half</strong> <strong>year</strong>, reported net loss of Rs. 346.8 Crores up from Rs. 117.5 Crores, caused by <strong>the</strong> initial strain of<br />
growing new business premium and intensification of distribution infrastructure. The new business is fully profitable.<br />
However, income from it will accrue over <strong>the</strong> policy period, as is <strong>the</strong> case with <strong>the</strong> nature of this business. To fund <strong>the</strong><br />
expansion and losses, Nuvo has invested Rs. 259 Crores <strong>for</strong> its 74% share in JV, in <strong>the</strong> <strong>half</strong> <strong>year</strong>, taking its total<br />
investment in <strong>the</strong> business to over Rs. 1200 Crores.<br />
The ramp up of distribution network lays a strong foundation <strong>for</strong> <strong>the</strong> future growth of <strong>the</strong> business.<br />
Asset Management [Birla Sun Life Asset Management Company Limited (BSAMC)]<br />
Assets under Management (AUM) of <strong>the</strong> business stood at Rs. 37,752 Crores as on <strong>September</strong> <strong>30</strong>, <strong>2008</strong>. BSAMC ranked<br />
5th with 7.1% share in Industry’s average AUM. It is <strong>the</strong> only AMC amongst top 10 players to achieve double digit<br />
growth in average AUM during <strong>the</strong> calendar <strong>year</strong> since December 2007. During <strong>the</strong> <strong>half</strong> <strong>year</strong>, revenues rose by 89% to Rs.<br />
84.9 Crores and net profit increased to Rs. 9.6 Crores this <strong>year</strong> vis-à-vis Rs. 2.4 Crores in <strong>the</strong> previous <strong>year</strong>. BSMAC was<br />
presented “Mutual Fund House of <strong>the</strong> Year” award by ‘CNBC TV18-Crisil’ besides winning 5 CNBC TV18-Crisil<br />
Awards, 2 ICRA awards and 4 Lipper Awards during <strong>the</strong> <strong>year</strong> <strong>for</strong> consistent fund per<strong>for</strong>mance across various asset classes.<br />
It was also named as a runner up in <strong>the</strong> “Best Mutual Fund House” category by ‘Outlook Money NDTV Profit Awards <strong>2008</strong>’.<br />
ITES-BPO & IT [Aditya Birla Minacs Worldwide Limited & PSI Data Systems Limited]<br />
Aditya Birla Minacs, <strong>the</strong> BPO subsidiary, posted 18% rise in revenues at Rs. 884 Crores during <strong>the</strong> <strong>half</strong> <strong>year</strong>. Amidst<br />
global slowdown, North America region maintained revenues at 180 million Canadian dollars while Asia Pacific region<br />
posted <strong>30</strong>% rise in revenues at 27 million US dollars. Adversely impacted by <strong>the</strong> <strong>for</strong>ex rates and high manpower costs,<br />
<strong>the</strong> net loss increased from Rs. 28.2 Crores to Rs. 49.4 Crores.<br />
In <strong>the</strong> direction of optimising seats and sites utilization, one site was closed and its business was shifted to a more cost<br />
effective site. To support new business from low cost locations, we have added 80 seats at Baroda and are also expanding<br />
3
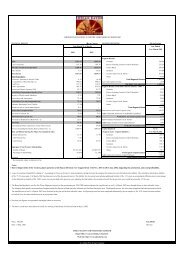
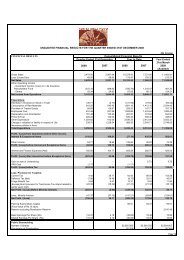
FINANCIAL RESULTS FOR THE QUARTER AND THE HALF YEAR ENDED <strong>30</strong>TH SEPTEMBER, <strong>2008</strong><br />
(Rs. Crores)<br />
Consolidated Financial Results FINANCIAL RESULTS Standalone Financial Results<br />
Quarter <strong>ended</strong> Half Year <strong>ended</strong> Year <strong>ended</strong> Quarter <strong>ended</strong> Half Year <strong>ended</strong> Year <strong>ended</strong><br />
<strong>30</strong>th <strong>September</strong> <strong>30</strong>th <strong>September</strong> 31st March <strong>30</strong>th <strong>September</strong> <strong>30</strong>th <strong>September</strong> 31st March<br />
<strong>2008</strong> 2007 <strong>2008</strong> 2007 <strong>2008</strong> <strong>2008</strong> 2007 <strong>2008</strong> 2007 <strong>2008</strong><br />
(Audited)<br />
(Audited)<br />
3,629.2 2,821.9 6,888.8 5,036.9 12,252.0 Gross Sales 1,373.9 950.8 2,486.9 1,763.1 4,055.6<br />
63.3 52.1 124.5 98.5 213.3 Less: Excise Duty 63.3 52.1 124.5 98.5 213.3<br />
3,566.0 2,769.8 6,764.3 4,938.4 12,038.7 Net Sales 1,310.6 898.7 2,362.4 1,664.6 3,842.3<br />
28.1 25.8 58.3 41.3 124.2 O<strong>the</strong>r Operating Income 26.0 22.8 53.2 37.0 110.8<br />
3,594.1 2,795.6 6,822.5 4,979.7 12,162.9 Net Income from Operations 1,336.6 921.4 2,415.6 1,701.5 3,953.1<br />
Expenditure:<br />
(48.9) (31.5) (85.8) (75.8) (93.2) Decrease / (Increase) in Stock in Trade (39.0) (32.4) (59.8) (71.5) (83.7)<br />
681.0 462.2 1,261.9 871.7 2,004.4 Consumption of Raw Materials 650.2 426.7 1,193.1 805.3 1,874.0<br />
89.0 51.4 131.8 81.8 187.8 Purchase of Traded Goods 79.5 51.4 122.3 81.8 187.8<br />
639.9 493.9 1,220.4 901.9 1,995.4 Employees Cost 77.7 67.9 146.4 126.8 258.2<br />
160.4 124.4 316.5 239.6 524.9 Depreciation and Amortisation 40.5 35.2 79.3 66.2 141.1<br />
202.8 95.6 3<strong>30</strong>.0 182.7 438.8 Power & Fuel 166.5 78.7 261.8 148.3 357.0<br />
1,195.5 820.9 2,267.9 1,499.8 3,552.3 O<strong>the</strong>r Expenditure 213.9 173.2 417.0 337.0 738.5<br />
660.3 628.1 1,275.6 949.5 3,040.4 Change in valuation of liability in respect of Life - - - - -<br />
- - - - - Insurance policies in <strong>for</strong>ce - - - - -<br />
3,580.1 2,645.0 6,718.3 4,651.2 11,650.9 Total Expenditure 1,189.4 800.7 2,160.1 1,494.0 3,473.0<br />
14.0 150.6 104.2 328.5 512.0 Profit from Operations be<strong>for</strong>e O<strong>the</strong>r Income,<br />
Interest & Exceptional Items 147.3 120.7 255.6 207.6 480.1<br />
36.9 13.0 61.4 27.2 64.3 O<strong>the</strong>r Income 7.0 2.5 9.2 8.0 12.7<br />
50.9 163.6 165.7 355.7 576.3 Profit be<strong>for</strong>e Interest and Exceptional Items 154.2 123.2 264.7 215.5 492.9<br />
158.2 102.2 295.0 188.0 425.0 Interest and Finance Expenses (Net) 52.6 47.4 98.7 90.9 179.0<br />
(107.3) 61.4 (129.4) 167.7 151.3 Profit after Interest but be<strong>for</strong>e Exceptional Items 101.6 75.9 166.1 124.7 313.8<br />
- - - 0.7 0.7 Gain on sale of Undertaking - - - 0.7 0.7<br />
(107.3) 61.4 (129.4) 168.4 152.0 Profit be<strong>for</strong>e Tax 101.6 75.9 166.1 125.4 314.6<br />
Less: Provision <strong>for</strong> Taxation:<br />
51.6 23.7 89.0 40.4 103.6 Current Tax 43.5 17.3 68.6 29.4 78.1<br />
(5.2) 12.0 (0.8) 16.0 45.6 Deferred Tax (Net) (8.4) 4.3 (11.6) 8.8 25.2<br />
5.1 2.8 8.5 5.2 11.8 Fringe Benefit Tax 1.1 0.9 2.2 1.7 3.9<br />
- (1.4) 0.7 (3.1) (35.1) (Excess)/short provision <strong>for</strong> Tax/Income Tax<br />
refund related to earlier <strong>year</strong>s (net) - (1.4) - (3.1) (35.7)<br />
(158.8) 24.3 (226.8) 110.0 26.2 Net Profit (Be<strong>for</strong>e Minority Interest) 65.3 54.9 106.9 88.6 243.1<br />
(54.2) (23.5) (93.8) (32.5) (124.6) Less : Minority Interest<br />
(104.6) 47.8 (132.9) 142.5 150.8 Net Profit 65.3 54.9 106.9 88.6 243.1<br />
95.0 93.3 95.0 Paid Up Equity Share Capital 95.0 93.3 95.0<br />
(Face Value of Rs.10 each)<br />
3,510.5 Reserve excluding Revaluation Reserve 3,551.3<br />
(11.1) 5.1 (14.2) 15.3 16.0 Basic Earnings Per Share (Rs) 6.9 5.9 11.3 9.5 26.0<br />
(11.1) 5.1 (14.2) 15.3 15.9 Diluted Earnings Per Share (Rs) 6.9 5.9 11.2 9.5 26.0<br />
Aggregate of Public Shareholding<br />
Number of Shares 53,520,574 53,541,638 53,564,907<br />
Percentage of Shareholding 56.3% 57.4% 56.4%<br />
Notes:<br />
1 The company has entered an agreement with <strong>the</strong> promoters of Apollo Sindhoori Capital Investments Limited (“ASCIL”), to acquire 3,10,24,000 equity shares in ASCIL<br />
representing 56% of its capital at a price of Rs 64.08 per share aggregating to Rs 198.81 Crores, subject to compliance of <strong>the</strong> <strong>for</strong>malities and conditions precedents as mentioned<br />
in <strong>the</strong> agreement. The company will also make an open offer to acquire upto 20% of <strong>the</strong> stake in <strong>the</strong> capital, as per SEBI regulations, <strong>for</strong> which <strong>the</strong> necessary announcement has<br />
already been made. The effect of <strong>the</strong>se transactions will be given as and when completed.<br />
2 On August 13, <strong>2008</strong> Idea Cellular Limited ( IDEA) a Joint Venture Company has made preferential allotment to TMI Mauritius Ltd of 464,734,670 equity shares of Rs 10/- at a<br />
price of Rs 156.96 per share each representating 14.99% of IDEA’s equity capital post allotment. Consequently <strong>the</strong> holding of <strong>the</strong> Company in IDEA has been reduced from 31.78<br />
% to 27.02 % and <strong>the</strong> Net Worth of <strong>the</strong> Company on Consolidated basis has increased by Rs 1781 Crores.<br />
3 Previous <strong>year</strong>’s / period’s figures are regrouped / rearranged wherever necessary.<br />
4 Status of Investor Complaints <strong>for</strong> <strong>the</strong> quarter <strong>ended</strong> <strong>September</strong> <strong>30</strong>, <strong>2008</strong>.<br />
Opening Received Redressed Pending<br />
- 23 21 2<br />
5 The above results have been reviewed by <strong>the</strong> Audit Committee of <strong>the</strong> Board and taken on record at <strong>the</strong> meeting of <strong>the</strong> Board of Directors. The Statutory Auditors of <strong>the</strong> Company<br />
have carried out Limited Review of <strong>the</strong> Unaudited Standalone and Consolidated Financial Results as required under Clause 41 of Listing Agreement and <strong>the</strong> related report will be<br />
submitted to <strong>the</strong> concerned stock exchanges.<br />
4
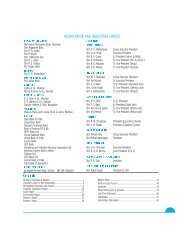
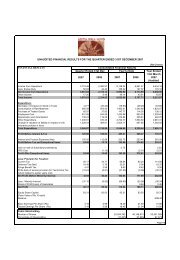
SEGMENTAL REPORTING FOR THE QUARTER AND THE HALF YEAR ENDED <strong>30</strong>TH SEPTEMBER, <strong>2008</strong><br />
(Rs. Crores)<br />
Consolidated Financial Results SEGMENT REPORTING Standalone Financial Results<br />
Quarter <strong>ended</strong> Half Year <strong>ended</strong> Year <strong>ended</strong> Quarter <strong>ended</strong> Half Year <strong>ended</strong> Year <strong>ended</strong><br />
<strong>30</strong>th <strong>September</strong> <strong>30</strong>th <strong>September</strong> 31st March <strong>30</strong>th <strong>September</strong> <strong>30</strong>th <strong>September</strong> 31st March<br />
<strong>2008</strong> 2007 <strong>2008</strong> 2007 <strong>2008</strong> <strong>2008</strong> 2007 <strong>2008</strong> 2007 <strong>2008</strong><br />
(Audited)<br />
(Audited)<br />
Segment Revenue<br />
325.0 270.1 549.2 470.7 1,025.8 Garments 283.1 220.7 461.4 381.9 825.7<br />
139.9 124.3 274.2 228.2 476.0 Rayon Yarn* 139.9 124.3 274.2 228.2 476.0<br />
338.0 190.2 635.6 351.4 863.8 Carbon Black 338.0 190.2 635.6 351.4 863.8<br />
105.9 101.3 196.7 185.4 398.9 Insulators 105.9 101.3 196.7 185.4 398.9<br />
149.3 145.3 298.0 296.7 600.3 O<strong>the</strong>r Textiles # 149.3 145.3 298.0 296.7 600.3<br />
320.2 138.5 549.5 254.8 787.5 Fertilizers 320.2 138.5 549.5 254.8 787.5<br />
69.4 42.1 133.0 77.7 197.5 Financial Services 0.3 1.2 0.3 3.9 5.3<br />
999.4 869.7 1,895.3 1,356.6 4,012.1 Life Insurance - - - - -<br />
25.2 25.2 51.1 48.7 101.1 Software - - - - -<br />
453.0 393.7 884.0 746.1 1,577.7 BPO - - - - -<br />
672.4 496.5 1,363.1 966.0 2,135.6 Telecom - - - - -<br />
3,597.5 2,796.8 6,829.6 4,982.3 12,176.3 Total Segmental Revenue 1,336.5 921.5 2,415.7 1,702.4 3,957.5<br />
(3.4) (1.2) (7.1) (2.6) (13.4) Less: Inter Segment Revenue 0.1 (0.1) (0.1) (0.9) (4.4)<br />
3,594.1 2,795.6 6,822.5 4,979.7 12,162.9 Net Income from Operations 1,336.6 921.4 2,415.6 1,701.5 3,953.1<br />
Segment Results (Profit be<strong>for</strong>e<br />
Interest and Tax - PBIT)<br />
(<strong>30</strong>.5) 12.0 (87.4) (0.7) 0.0 Garments 14.9 14.1 (8.9) 8.1 35.1<br />
18.7 27.8 48.1 46.8 91.5 Rayon Yarn* 18.7 27.8 48.1 46.8 91.5<br />
23.3 33.2 64.8 62.0 1<strong>30</strong>.3 Carbon Black 23.3 33.2 64.8 62.0 1<strong>30</strong>.3<br />
28.5 29.8 53.3 53.3 122.5 Insulators 28.5 29.8 53.3 53.3 122.5<br />
12.6 13.7 23.7 25.5 48.7 O<strong>the</strong>r Textiles # 12.6 13.7 23.7 25.5 48.7<br />
56.7 10.9 89.7 24.1 84.5 Fertilizers 56.7 10.9 89.7 24.1 84.5<br />
16.1 10.4 39.0 16.9 44.3 Financial Services (2.9) (0.6) (3.7) (0.2) (2.4)<br />
(194.3) (82.3) (338.6) (114.6) (437.7) Life Insurance - - - - -<br />
1.5 0.9 3.9 1.9 6.5 Software - - - - -<br />
(9.9) (0.3) (18.6) 5.6 (26.5) BPO - - - - -<br />
102.8 103.0 249.7 218.3 476.3 Telecom - - - - -<br />
25.5 159.2 127.6 339.2 540.5 Total Segment Result 151.9 128.9 267.1 219.6 510.2<br />
(135.5) (90.6) (255.2) (164.3) (367.0) Less: Interest & Finance Expenses (Net) (52.4) (46.2) (98.5) (88.5) (174.9)<br />
2.6 (7.2) (1.8) (7.1) (22.2) Add: Net of Unallocable Income/(Expenditure) 2.2 (6.8) (2.5) (6.4) (21.5)<br />
(107.3) 61.4 (129.4) 167.7 151.3 Profit Be<strong>for</strong>e Tax and Exceptional Items 101.6 75.9 166.1 124.7 313.8<br />
- - - 0.7 0.7 Gain on sale of Subsidiary/Undertaking - - - 0.7 0.7<br />
(107.3) 61.4 (129.4) 168.4 152.0 Profit After Exceptional Items 101.6 75.9 166.1 125.4 314.6<br />
As on <strong>30</strong>th As on <strong>30</strong>th As on 31st Capital Employed As on <strong>30</strong>th As on <strong>30</strong>th As on 31st<br />
<strong>September</strong> <strong>September</strong> March (Segment Assets - Segment Liabilities) <strong>September</strong> <strong>September</strong> March<br />
<strong>2008</strong> 2007 <strong>2008</strong> <strong>2008</strong> 2007 <strong>2008</strong><br />
846.0 616.7 746.1 Garments 552.8 414.6 471.2<br />
441.2 443.2 453.7 Rayon Yarn* 441.2 443.2 453.7<br />
974.4 566.9 667.5 Carbon Black 974.4 566.9 667.5<br />
238.7 210.5 240.0 Insulators 238.7 210.5 240.0<br />
424.1 344.3 359.3 O<strong>the</strong>r Textiles # 424.1 344.3 359.3<br />
382.8 320.5 531.3 Fertilizers 382.8 320.5 531.3<br />
331.3 209.8 <strong>30</strong>7.0 Financial Services 13.0 9.1 14.0<br />
388.0 314.9 384.6 Life Insurance - - -<br />
27.4 28.7 31.6 Software - - -<br />
1,062.6 931.5 1,005.6 BPO - - -<br />
5,736.7 2,498.3 3,218.1 Telecom - - -<br />
10,853.3 6,485.3 7,944.8 Total Segment Capital Employed 3,026.9 2,<strong>30</strong>9.2 2,737.1<br />
2,099.3 2,025.0 2,139.9 Add: Unallocated Corporate Assets 4,380.3 3,502.1 3,949.1<br />
12,952.6 8,510.3 10,084.7 Total Capital Employed 7,407.2 5,811.3 6,686.2<br />
* Including Caustic & Allied Chemicals<br />
#<br />
Spun Yarn & Fabrics<br />
5
<strong>the</strong> Manila site in Philippines by 120 seats. Substantial benefits from <strong>the</strong>se initiatives should accrue in <strong>the</strong> second <strong>half</strong> of<br />
<strong>the</strong> financial <strong>year</strong>. The business is expexted to breakeven in <strong>the</strong> last quarter.<br />
During <strong>the</strong> <strong>half</strong> <strong>year</strong>, PSI Data Systems reported revenues at Rs. 51.1 Crores and net profit at Rs. 1.5 Crores vis-à-vis Rs.<br />
48.7 Crores and Rs. 0.1 Crores respectively attained in <strong>the</strong> corresponding period of <strong>the</strong> last <strong>year</strong>.<br />
Mr. Deepak Patel who has about two decades of experience, has joined as CEO of <strong>the</strong> BPO business.<br />
Branded Garments [Esprit & Madura Garments’ FASHION brands – Louis Philippe, Van Heusen and Allen Solly &<br />
POPULAR brand – Peter England]<br />
In <strong>the</strong> Branded Garments business, revenues surged by 21% from Rs. 381.9 Crores to Rs. 461.4 Crores driven by 47%<br />
growth in sales from <strong>the</strong> retail segment. During <strong>the</strong> <strong>half</strong> <strong>year</strong>, 42 new Exclusive Brand Outlets (EBOs) were launched,<br />
taking <strong>the</strong> controlled retail space to 5.7 lacs square feet across 279 EBOs. Operating Profit, however, is lower at Rs. 13<br />
Crores vis-à-vis Rs. 22.9 Crores. Higher discounts offered to boost sales and rising lease rentals amidst gestating new<br />
stores impacted <strong>the</strong> bottom line. Going <strong>for</strong>ward, business is expected to achieve profitable growth once <strong>the</strong> gestation<br />
phase of <strong>the</strong> new stores is over.<br />
High-end apparel retailing [Peter England PEOPLE & THE COLLECTIVE]<br />
As stated earlier, Nuvo has ventured in high-end apparel retailing through two separate subsidiaries. During <strong>the</strong> <strong>half</strong> <strong>year</strong>,<br />
<strong>the</strong> first subsidiary has launched five “Peter England PEOPLE” family stores of an average size of 12,000 to 15,000 square<br />
feet generating revenues of Rs. 4 Crores. The second subsidiary has launched “THE COLLECTIVE”, a store spanning<br />
across about 17,500 square feet in <strong>the</strong> month of October <strong>2008</strong>. This Men’s exclusive store offers Madura garments’<br />
fashion brands as well as international brands under one roof. Combined, both <strong>the</strong> <strong>for</strong>mats reported net loss of Rs. 50.5<br />
Crores including business and brand building costs.<br />
Contract Manufacturing [Madura Garments Export Limited]<br />
In <strong>the</strong> Contract Manufacturing business, sales volumes grew by 29% to 35.8 lacs pieces during <strong>the</strong> <strong>half</strong> <strong>year</strong>. Last <strong>year</strong>, in<br />
August 2007, capacity of <strong>the</strong> business was more than doubled to 15.4 million pieces. Revenues remained flat at Rs. 93.8<br />
Crores due to weak order flows impacted by <strong>the</strong> global slowdown. Consequent lower capacity utilisation has impacted<br />
profitability and resulted in net loss of Rs. 41.3 Crores. Ef<strong>for</strong>ts are on to bring back profitability through improved<br />
capacity utilisation and reducing dependence on USD business besides scaling full service provider (FSP) segment.<br />
Carbon Black [Hi-tech Carbon]<br />
The Carbon Black business registered 81% growth in revenues at Rs. 635.6 Crores during <strong>the</strong> <strong>half</strong> <strong>year</strong>. Pass on of higher<br />
CBFS (raw material) prices is partly reflected in 44% rise in realisation at Rs. 51,809 per metric tonne (MT). Brownfield<br />
expansion in second quarter of <strong>the</strong> previous <strong>year</strong> led to 26% growth in sales volumes at 118,136 MT. Carbon Black<br />
industry witnessed squeeze in operating margins due to high raw material costs led by sharp rise in crude oil prices which<br />
is passed on to customers with a time lag. Amidst <strong>the</strong>se challenges, Hi-tech Carbon posted 7% rise in operating profit at<br />
Rs. 77.1 Crores vis-à-vis Rs. 71.8 Crores. The business is accelerating project activities <strong>for</strong> Greenfield expansion by<br />
150,000 MT per annum (in two phases) at Patalganga after receiving environment clearance. First phase expansion by<br />
75,000 MT is targeted at a capex of Rs. 270 Crores.<br />
Fertilisers [Indo Gulf Fertilisers]<br />
Revenues in <strong>the</strong> Fertilisers business, during <strong>the</strong> <strong>half</strong> <strong>year</strong>, more than doubled to Rs. 549.5 Crores supported by 54%<br />
growth achieved in sales volumes at 502,610 MT. In <strong>the</strong> previous <strong>year</strong>, volumes were impacted due to plant shutdown <strong>for</strong><br />
annual maintenance <strong>for</strong> 42 days in <strong>the</strong> first quarter and breakdown <strong>for</strong> 27 days in <strong>the</strong> second quarter. Operating profit<br />
grew significantly to Rs. 99.2 Crores vis-à-vis Rs. 32.5 Crores, led by volume growth and subsidy <strong>for</strong> earlier <strong>year</strong>s. Indo-<br />
Gulf Fertilisers is set to position itself as Complete Agri-Solution provider. It has more than doubled its revenues from<br />
agri-inputs marketing to Rs. 49.1 Crores during <strong>the</strong> <strong>half</strong> <strong>year</strong>.<br />
Rayon [Indian Rayon]<br />
The Rayon business posted 20% rise in revenues at Rs. 274.2 Crores supported by improved VFY and ECU realisations.<br />
Higher production of super fine denier yarn led to 7% decrease in VFY sales volumes at 8,466 MT while VFY realisation<br />
6
ose by 17% to Rs. 196 per kg. Caustic soda sales volumes grew by 9% to 39,455 MT and ECU realisation surged by<br />
24% to Rs. 24,135 per MT. The margins in <strong>the</strong> VFY industry are adversely impacted by steep rise in input material and<br />
fuel costs. Indian Rayon managed to maintain its operating profit at Rs. 64.6 Crores amidst escalating wood pulp,<br />
sulphur and coal prices. The business continued to lay thrust on quality improvement to derive premium in exports<br />
markets.<br />
Insulators [Aditya Birla Insulators]<br />
The Insulators business, during <strong>the</strong> <strong>half</strong> <strong>year</strong>, grew by 6% in revenues at Rs. 196.7 Crores. Focus on high rating insulators<br />
led to higher realisation. The growth could have been higher but sales volumes were impacted due to higher rejections at<br />
<strong>the</strong> Halol plant. Initial stabilization process <strong>for</strong> shifting to high rating insulators caused higher rejections <strong>for</strong> which<br />
corrective actions have been taken. Despite lower volumes and rise in fuel prices, <strong>the</strong> business has maintained its<br />
operating profit at Rs. 60.5 Crores. To capture power sector growth, Aditya Birla Insulators is expanding capacity by<br />
12,000 MT (in two phases) at Rishra plant besides <strong>for</strong>aying in composite insulators at Halol plant. Both <strong>the</strong> projects are<br />
expected to go on stream by <strong>the</strong> financial <strong>year</strong> end.<br />
Textiles [Jaya Shree Textiles]<br />
The Textiles Industry witnessed stagnant domestic as well as exports demand impacted by <strong>the</strong> global slowdown. During<br />
<strong>the</strong> <strong>half</strong> <strong>year</strong>, Jaya Shree textiles posted 7% growth in revenues from <strong>the</strong> continued operations at Rs. 298 Crores. The<br />
Syn<strong>the</strong>tic Yarn segment was completely exited during second <strong>half</strong> of <strong>the</strong> previous <strong>year</strong>. Operating profit was maintained at<br />
Rs. 34 Crores, even though in <strong>the</strong> previous <strong>year</strong>, <strong>the</strong> operating profit included Rs. 2.4 Cr. from <strong>the</strong> sale of carbon credits.<br />
The business is focusing on expanding its high paying retail distribution channel under <strong>the</strong> Linen Club brand besides<br />
increasing share of value added yarns.<br />
Most of our businesses are progressing well on <strong>the</strong> designed path to leverage growth opportunities. Aditya Birla Nuvo<br />
is optimistic about meeting <strong>the</strong> challenges of strategic growth initiatives and enhancing its revenues and earnings. The<br />
investments made specifically into <strong>the</strong> Life Insurance, BPO and Garments businesses, which have created a stretch on<br />
profitability in <strong>the</strong> short term as per plan, will go a long way towards value creation <strong>for</strong> shareholders.<br />
A detailed presentation is available on your Company’s website in <strong>the</strong> ‘Investors’ section. Should you require a copy of <strong>the</strong><br />
same, please email us at nuvo.cfd@adityabirla.com<br />
Yours sincerely,<br />
Adesh Gupta<br />
Wholetime Director & CFO<br />
Aditya Birla Centre, 4th Floor, ‘A’ Wing, S.K. Ahire Marg, Worli, Mumbai - 400 0<strong>30</strong><br />
Phone No. : 6652 5570 I Fax No. : 6652 5821 I E-Mail : nuvo.cfd@adityabirla.com<br />
Mumbai, 31st October <strong>2008</strong><br />
Statements in this “<strong>Per<strong>for</strong>mance</strong> Update” describing <strong>the</strong> Company’s objectives, projections, estimates, expectations or predictions may be “<strong>for</strong>ward<br />
looking statements” within <strong>the</strong> meaning of applicable securities laws and regulations. The actual results could differ materially from those<br />
expressed or implied. The important factors that could make a difference to <strong>the</strong> Company’s operations include <strong>the</strong> global and Indian demand<br />
supply conditions, finished goods prices, feed stock availability and prices, cyclical demand and pricing in <strong>the</strong> Company’s principal markets,<br />
changes in Government regulations, tax regimes, economic developments within India and <strong>the</strong> countries within which <strong>the</strong> Company conducts<br />
business and o<strong>the</strong>r factors such as litigation and labour negotiations. The Company assume no responsibility to publicly amend, modify or revise<br />
any <strong>for</strong>ward looking statement, on <strong>the</strong> basis of any subsequent development, in<strong>for</strong>mation or events, or o<strong>the</strong>rwise<br />
7
ADITYA BIRLA NUVO LIMITED<br />
Registered Office: Indian Rayon Compound, Veraval - 362 266, Gujarat.<br />
Website: www.adityabirlanuvo.com / www.adityabirla.com<br />
Infomedia 18 Limited<br />
8