Modification of Dynamic Modulus Predictive Models for Asphalt ...
Modification of Dynamic Modulus Predictive Models for Asphalt ...
Modification of Dynamic Modulus Predictive Models for Asphalt ...

Create successful ePaper yourself
Turn your PDF publications into a flip-book with our unique Google optimized e-Paper software.
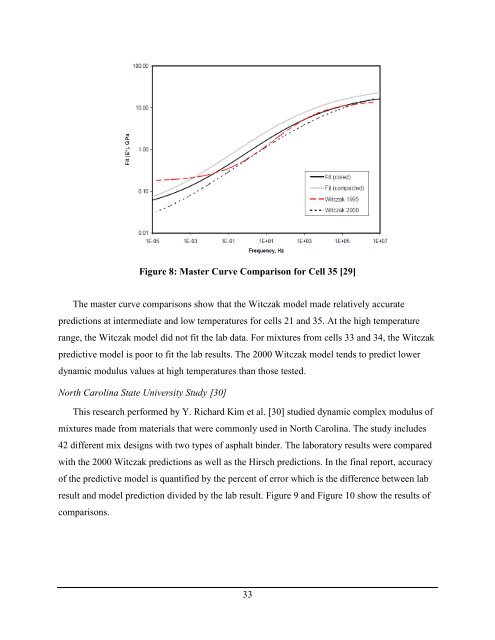
Figure 8: Master Curve Comparison <strong>for</strong> Cell 35 [29]<br />
The master curve comparisons show that the Witczak model made relatively accurate<br />
predictions at intermediate and low temperatures <strong>for</strong> cells 21 and 35. At the high temperature<br />
range, the Witczak model did not fit the lab data. For mixtures from cells 33 and 34, the Witczak<br />
predictive model is poor to fit the lab results. The 2000 Witczak model tends to predict lower<br />
dynamic modulus values at high temperatures than those tested.<br />
North Carolina State University Study [30]<br />
This research per<strong>for</strong>med by Y. Richard Kim et al. [30] studied dynamic complex modulus <strong>of</strong><br />
mixtures made from materials that were commonly used in North Carolina. The study includes<br />
42 different mix designs with two types <strong>of</strong> asphalt binder. The laboratory results were compared<br />
with the 2000 Witczak predictions as well as the Hirsch predictions. In the final report, accuracy<br />
<strong>of</strong> the predictive model is quantified by the percent <strong>of</strong> error which is the difference between lab<br />
result and model prediction divided by the lab result. Figure 9 and Figure 10 show the results <strong>of</strong><br />
comparisons.<br />
33