Modification of Dynamic Modulus Predictive Models for Asphalt ...
Modification of Dynamic Modulus Predictive Models for Asphalt ...
Modification of Dynamic Modulus Predictive Models for Asphalt ...

Create successful ePaper yourself
Turn your PDF publications into a flip-book with our unique Google optimized e-Paper software.
Percent Passing, %<br />
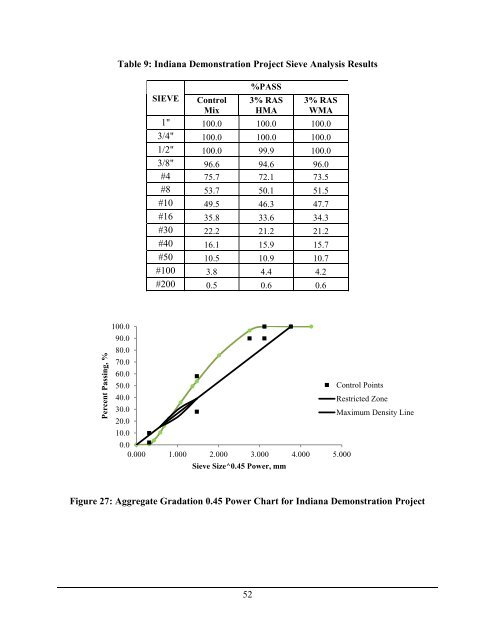
Table 9: Indiana Demonstration Project Sieve Analysis Results<br />
%PASS<br />
SIEVE Control<br />
Mix<br />
3% RAS<br />
HMA<br />
3% RAS<br />
WMA<br />
1" 100.0 100.0 100.0<br />
3/4" 100.0 100.0 100.0<br />
1/2" 100.0 99.9 100.0<br />
3/8" 96.6 94.6 96.0<br />
#4 75.7 72.1 73.5<br />
#8 53.7 50.1 51.5<br />
#10 49.5 46.3 47.7<br />
#16 35.8 33.6 34.3<br />
#30 22.2 21.2 21.2<br />
#40 16.1 15.9 15.7<br />
#50 10.5 10.9 10.7<br />
#100 3.8 4.4 4.2<br />
#200 0.5 0.6 0.6<br />
100.0<br />
90.0<br />
80.0<br />
70.0<br />
60.0<br />
50.0<br />
Control Points<br />
40.0<br />
Restricted Zone<br />
30.0<br />
Maximum Density Line<br />
20.0<br />
10.0<br />
0.0<br />
0.000 1.000 2.000 3.000 4.000 5.000<br />
Sieve Size^0.45 Power, mm<br />
Figure 27: Aggregate Gradation 0.45 Power Chart <strong>for</strong> Indiana Demonstration Project<br />
52