Modification of Dynamic Modulus Predictive Models for Asphalt ...
Modification of Dynamic Modulus Predictive Models for Asphalt ...
Modification of Dynamic Modulus Predictive Models for Asphalt ...
You also want an ePaper? Increase the reach of your titles
YUMPU automatically turns print PDFs into web optimized ePapers that Google loves.
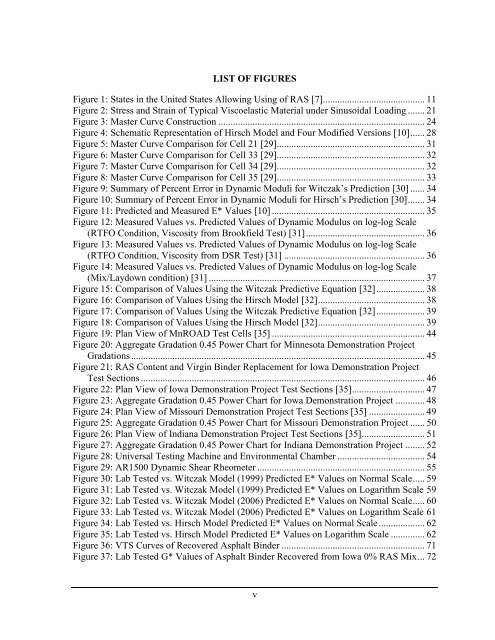
LIST OF FIGURES<br />
Figure 1: States in the United States Allowing Using <strong>of</strong> RAS [7].......................................... 11<br />
Figure 2: Stress and Strain <strong>of</strong> Typical Viscoelastic Material under Sinusoidal Loading ....... 21<br />
Figure 3: Master Curve Construction ..................................................................................... 24<br />
Figure 4: Schematic Representation <strong>of</strong> Hirsch Model and Four Modified Versions [10] ...... 28<br />
Figure 5: Master Curve Comparison <strong>for</strong> Cell 21 [29] ............................................................. 31<br />
Figure 6: Master Curve Comparison <strong>for</strong> Cell 33 [29] ............................................................. 32<br />
Figure 7: Master Curve Comparison <strong>for</strong> Cell 34 [29] ............................................................. 32<br />
Figure 8: Master Curve Comparison <strong>for</strong> Cell 35 [29] ............................................................. 33<br />
Figure 9: Summary <strong>of</strong> Percent Error in <strong>Dynamic</strong> Moduli <strong>for</strong> Witczak’s Prediction [30] ...... 34<br />
Figure 10: Summary <strong>of</strong> Percent Error in <strong>Dynamic</strong> Moduli <strong>for</strong> Hirsch’s Prediction [30] ....... 34<br />
Figure 11: Predicted and Measured E* Values [10] ............................................................... 35<br />
Figure 12: Measured Values vs. Predicted Values <strong>of</strong> <strong>Dynamic</strong> <strong>Modulus</strong> on log-log Scale<br />
(RTFO Condition, Viscosity from Brookfield Test) [31] ................................................. 36<br />
Figure 13: Measured Values vs. Predicted Values <strong>of</strong> <strong>Dynamic</strong> <strong>Modulus</strong> on log-log Scale<br />
(RTFO Condition, Viscosity from DSR Test) [31] .......................................................... 36<br />
Figure 14: Measured Values vs. Predicted Values <strong>of</strong> <strong>Dynamic</strong> <strong>Modulus</strong> on log-log Scale<br />
(Mix/Laydown condition) [31] ......................................................................................... 37<br />
Figure 15: Comparison <strong>of</strong> Values Using the Witczak <strong>Predictive</strong> Equation [32] .................... 38<br />
Figure 16: Comparison <strong>of</strong> Values Using the Hirsch Model [32] ............................................ 38<br />
Figure 17: Comparison <strong>of</strong> Values Using the Witczak <strong>Predictive</strong> Equation [32] .................... 39<br />
Figure 18: Comparison <strong>of</strong> Values Using the Hirsch Model [32] ............................................ 39<br />
Figure 19: Plan View <strong>of</strong> MnROAD Test Cells [35] ............................................................... 44<br />
Figure 20: Aggregate Gradation 0.45 Power Chart <strong>for</strong> Minnesota Demonstration Project<br />
Gradations ......................................................................................................................... 45<br />
Figure 21: RAS Content and Virgin Binder Replacement <strong>for</strong> Iowa Demonstration Project<br />
Test Sections ..................................................................................................................... 46<br />
Figure 22: Plan View <strong>of</strong> Iowa Demonstration Project Test Sections [35] .............................. 47<br />
Figure 23: Aggregate Gradation 0.45 Power Chart <strong>for</strong> Iowa Demonstration Project ............ 48<br />
Figure 24: Plan View <strong>of</strong> Missouri Demonstration Project Test Sections [35] ....................... 49<br />
Figure 25: Aggregate Gradation 0.45 Power Chart <strong>for</strong> Missouri Demonstration Project ...... 50<br />
Figure 26: Plan View <strong>of</strong> Indiana Demonstration Project Test Sections [35] .......................... 51<br />
Figure 27: Aggregate Gradation 0.45 Power Chart <strong>for</strong> Indiana Demonstration Project ........ 52<br />
Figure 28: Universal Testing Machine and Environmental Chamber .................................... 54<br />
Figure 29: AR1500 <strong>Dynamic</strong> Shear Rheometer ..................................................................... 55<br />
Figure 30: Lab Tested vs. Witczak Model (1999) Predicted E* Values on Normal Scale ..... 59<br />
Figure 31: Lab Tested vs. Witczak Model (1999) Predicted E* Values on Logarithm Scale 59<br />
Figure 32: Lab Tested vs. Witczak Model (2006) Predicted E* Values on Normal Scale ..... 60<br />
Figure 33: Lab Tested vs. Witczak Model (2006) Predicted E* Values on Logarithm Scale 61<br />
Figure 34: Lab Tested vs. Hirsch Model Predicted E* Values on Normal Scale ................... 62<br />
Figure 35: Lab Tested vs. Hirsch Model Predicted E* Values on Logarithm Scale .............. 62<br />
Figure 36: VTS Curves <strong>of</strong> Recovered <strong>Asphalt</strong> Binder ........................................................... 71<br />
Figure 37: Lab Tested G* Values <strong>of</strong> <strong>Asphalt</strong> Binder Recovered from Iowa 0% RAS Mix ... 72<br />
v


