

Putnam Short Duration Income Fund - Putnam Investments
Putnam Short Duration Income Fund - Putnam Investments
Putnam Short Duration Income Fund - Putnam Investments

You also want an ePaper? Increase the reach of your titles
YUMPU automatically turns print PDFs into web optimized ePapers that Google loves.
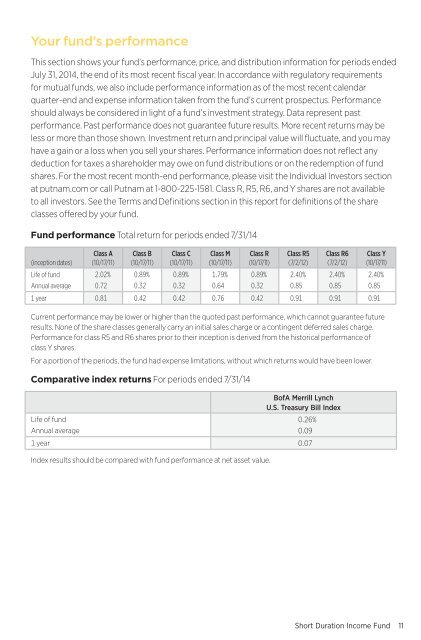
Your fund’s performance<br />
This section shows your fund’s performance, price, and distribution information for periods ended<br />
July 31, 2014, the end of its most recent fiscal year. In accordance with regulatory requirements<br />
for mutual funds, we also include performance information as of the most recent calendar<br />
quarter-end and expense information taken from the fund’s current prospectus. Performance<br />
should always be considered in light of a fund’s investment strategy. Data represent past<br />
performance. Past performance does not guarantee future results. More recent returns may be<br />
less or more than those shown. Investment return and principal value will fluctuate, and you may<br />
have a gain or a loss when you sell your shares. Performance information does not reflect any<br />
deduction for taxes a shareholder may owe on fund distributions or on the redemption of fund<br />
shares. For the most recent month-end performance, please visit the Individual Investors section<br />
at putnam.com or call <strong>Putnam</strong> at 1-800-225-1581. Class R, R5, R6, and Y shares are not available<br />
to all investors. See the Terms and Definitions section in this report for definitions of the share<br />
classes offered by your fund.<br />
<strong>Fund</strong> performance Total return for periods ended 7/31/14<br />
Class A Class B Class C Class M Class R Class R5 Class R6 Class Y<br />
(inception dates) (10/17/11) (10/17/11) (10/17/11) (10/17/11) (10/17/11) (7/2/12) (7/2/12) (10/17/11)<br />
Life of fund 2.02% 0.89% 0.89% 1.79% 0.89% 2.40% 2.40% 2.40%<br />
Annual average 0.72 0.32 0.32 0.64 0.32 0.85 0.85 0.85<br />
1 year 0.81 0.42 0.42 0.76 0.42 0.91 0.91 0.91<br />
Current performance may be lower or higher than the quoted past performance, which cannot guarantee future<br />
results. None of the share classes generally carry an initial sales charge or a contingent deferred sales charge.<br />
Performance for class R5 and R6 shares prior to their inception is derived from the historical performance of<br />
class Y shares.<br />
For a portion of the periods, the fund had expense limitations, without which returns would have been lower.<br />
Comparative index returns For periods ended 7/31/14<br />
BofA Merrill Lynch<br />
U.S. Treasury Bill Index<br />
Life of fund 0.26 %<br />
Annual average 0.09<br />
1 year 0.07<br />
Index results should be compared with fund performance at net asset value.<br />
<strong>Short</strong> <strong>Duration</strong> <strong>Income</strong> <strong>Fund</strong> 11


