

Putnam Short Duration Income Fund - Putnam Investments
Putnam Short Duration Income Fund - Putnam Investments
Putnam Short Duration Income Fund - Putnam Investments

You also want an ePaper? Increase the reach of your titles
YUMPU automatically turns print PDFs into web optimized ePapers that Google loves.
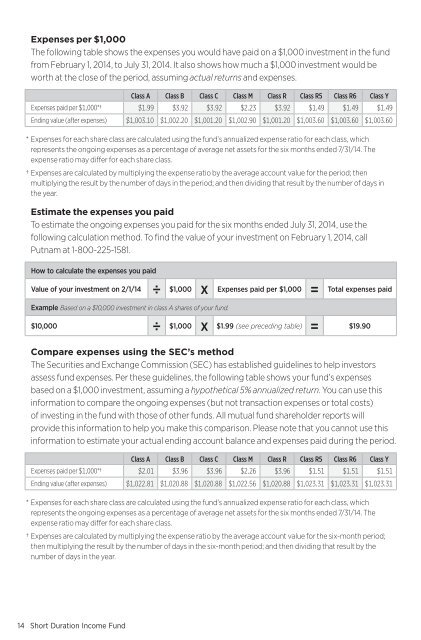
Expenses per $1,000<br />
The following table shows the expenses you would have paid on a $1,000 investment in the fund<br />
from February 1, 2014, to July 31, 2014. It also shows how much a $1,000 investment would be<br />
worth at the close of the period, assuming actual returns and expenses.<br />
Class A Class B Class C Class M Class R Class R5 Class R6 Class Y<br />
Expenses paid per $1,000*† $1.99 $3.92 $3.92 $2.23 $3.92 $1.49 $1.49 $1.49<br />
Ending value (after expenses) $1,003.10 $1,002.20 $1,001.20 $1,002.90 $1,001.20 $1,003.60 $1,003.60 $1,003.60<br />
* Expenses for each share class are calculated using the fund’s annualized expense ratio for each class, which<br />
represents the ongoing expenses as a percentage of average net assets for the six months ended 7/31/14. The<br />
expense ratio may differ for each share class.<br />
† Expenses are calculated by multiplying the expense ratio by the average account value for the period; then<br />
multiplying the result by the number of days in the period; and then dividing that result by the number of days in<br />
the year.<br />
Estimate the expenses you paid<br />
To estimate the ongoing expenses you paid for the six months ended July 31, 2014, use the<br />
following calculation method. To find the value of your investment on February 1, 2014, call<br />
<strong>Putnam</strong> at 1-800-225-1581.<br />
How to calculate the expenses you paid<br />
Value of your investment on 2/1/14<br />
÷ $1,000 x Expenses paid per $1,000 =<br />
Total expenses paid<br />
Example Based on a $10,000 investment in class A shares of your fund.<br />
$10,000<br />
÷ $1,000 x $1.99 (see preceding table) =<br />
$19.90<br />
Compare expenses using the SEC’s method<br />
The Securities and Exchange Commission (SEC) has established guidelines to help investors<br />
assess fund expenses. Per these guidelines, the following table shows your fund’s expenses<br />
based on a $1,000 investment, assuming a hypothetical 5% annualized return. You can use this<br />
information to compare the ongoing expenses (but not transaction expenses or total costs)<br />
of investing in the fund with those of other funds. All mutual fund shareholder reports will<br />
provide this information to help you make this comparison. Please note that you cannot use this<br />
information to estimate your actual ending account balance and expenses paid during the period.<br />
Class A Class B Class C Class M Class R Class R5 Class R6 Class Y<br />
Expenses paid per $1,000*† $2.01 $3.96 $3.96 $2.26 $3.96 $1.51 $1.51 $1.51<br />
Ending value (after expenses) $1,022.81 $1,020.88 $1,020.88 $1,022.56 $1,020.88 $1,023.31 $1,023.31 $1,023.31<br />
* Expenses for each share class are calculated using the fund’s annualized expense ratio for each class, which<br />
represents the ongoing expenses as a percentage of average net assets for the six months ended 7/31/14. The<br />
expense ratio may differ for each share class.<br />
† Expenses are calculated by multiplying the expense ratio by the average account value for the six-month period;<br />
then multiplying the result by the number of days in the six-month period; and then dividing that result by the<br />
number of days in the year.<br />
14 <strong>Short</strong> <strong>Duration</strong> <strong>Income</strong> <strong>Fund</strong>


