

Putnam Short Duration Income Fund - Putnam Investments
Putnam Short Duration Income Fund - Putnam Investments
Putnam Short Duration Income Fund - Putnam Investments

Create successful ePaper yourself
Turn your PDF publications into a flip-book with our unique Google optimized e-Paper software.
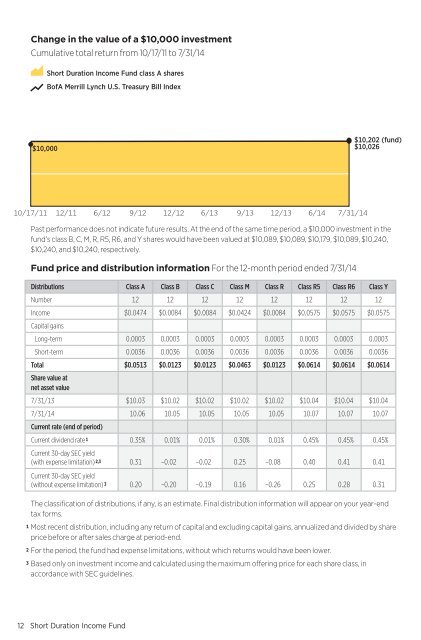
Change in the value of a $10,000 investment<br />
Cumulative total return from 10/17/11 to 7/31/14<br />
<strong>Short</strong> <strong>Duration</strong> <strong>Income</strong> <strong>Fund</strong> class A shares<br />
BofA Merrill Lynch U.S. Treasury Bill Index<br />
$10,000<br />
$10,202 (fund)<br />
$10,026<br />
10/17/11 12/11 6/12 9/12 12/12 6/13 9/13 12/13 6/14 7/31/14<br />
Past performance does not indicate future results. At the end of the same time period, a $10,000 investment in the<br />
fund’s class B, C, M, R, R5, R6, and Y shares would have been valued at $10,089, $10,089, $10,179, $10,089, $10,240,<br />
$10,240, and $10,240, respectively.<br />
<strong>Fund</strong> price and distribution information For the 12-month period ended 7/31/14<br />
Distributions Class A Class B Class C Class M Class R Class R5 Class R6 Class Y<br />
Number 12 12 12 12 12 12 12 12<br />
<strong>Income</strong> $0.0474 $0.0084 $0.0084 $0.0424 $0.0084 $0.0575 $0.0575 $0.0575<br />
Capital gains<br />
Long-term 0.0003 0.0003 0.0003 0.0003 0.0003 0.0003 0.0003 0.0003<br />
<strong>Short</strong>-term 0.0036 0.0036 0.0036 0.0036 0.0036 0.0036 0.0036 0.0036<br />
Total $0.0513 $0.0123 $0.0123 $0.0463 $0.0123 $0.0614 $0.0614 $0.0614<br />
Share value at<br />
net asset value<br />
7/31/13 $10.03 $10.02 $10.02 $10.02 $10.02 $10.04 $10.04 $10.04<br />
7/31/14 10.06 10.05 10.05 10.05 10.05 10.07 10.07 10.07<br />
Current rate (end of period)<br />
Current dividend rate 1 0.35% 0.01% 0.01% 0.30% 0.01% 0.45% 0.45% 0.45%<br />
Current 30-day SEC yield<br />
(with expense limitation) 2,3 0.31 –0.02 –0.02 0.25 –0.08 0.40 0.41 0.41<br />
Current 30-day SEC yield<br />
(without expense limitation) 3 0.20 –0.20 –0.19 0.16 –0.26 0.25 0.28 0.31<br />
The classification of distributions, if any, is an estimate. Final distribution information will appear on your year-end<br />
tax forms.<br />
1 Most recent distribution, including any return of capital and excluding capital gains, annualized and divided by share<br />
price before or after sales charge at period-end.<br />
2 For the period, the fund had expense limitations, without which returns would have been lower.<br />
3 Based only on investment income and calculated using the maximum offering price for each share class, in<br />
accordance with SEC guidelines.<br />
12 <strong>Short</strong> <strong>Duration</strong> <strong>Income</strong> <strong>Fund</strong>


